This article provides a step-by-step tutorial for a linear static analysis of a Wheeled Loader Arm.
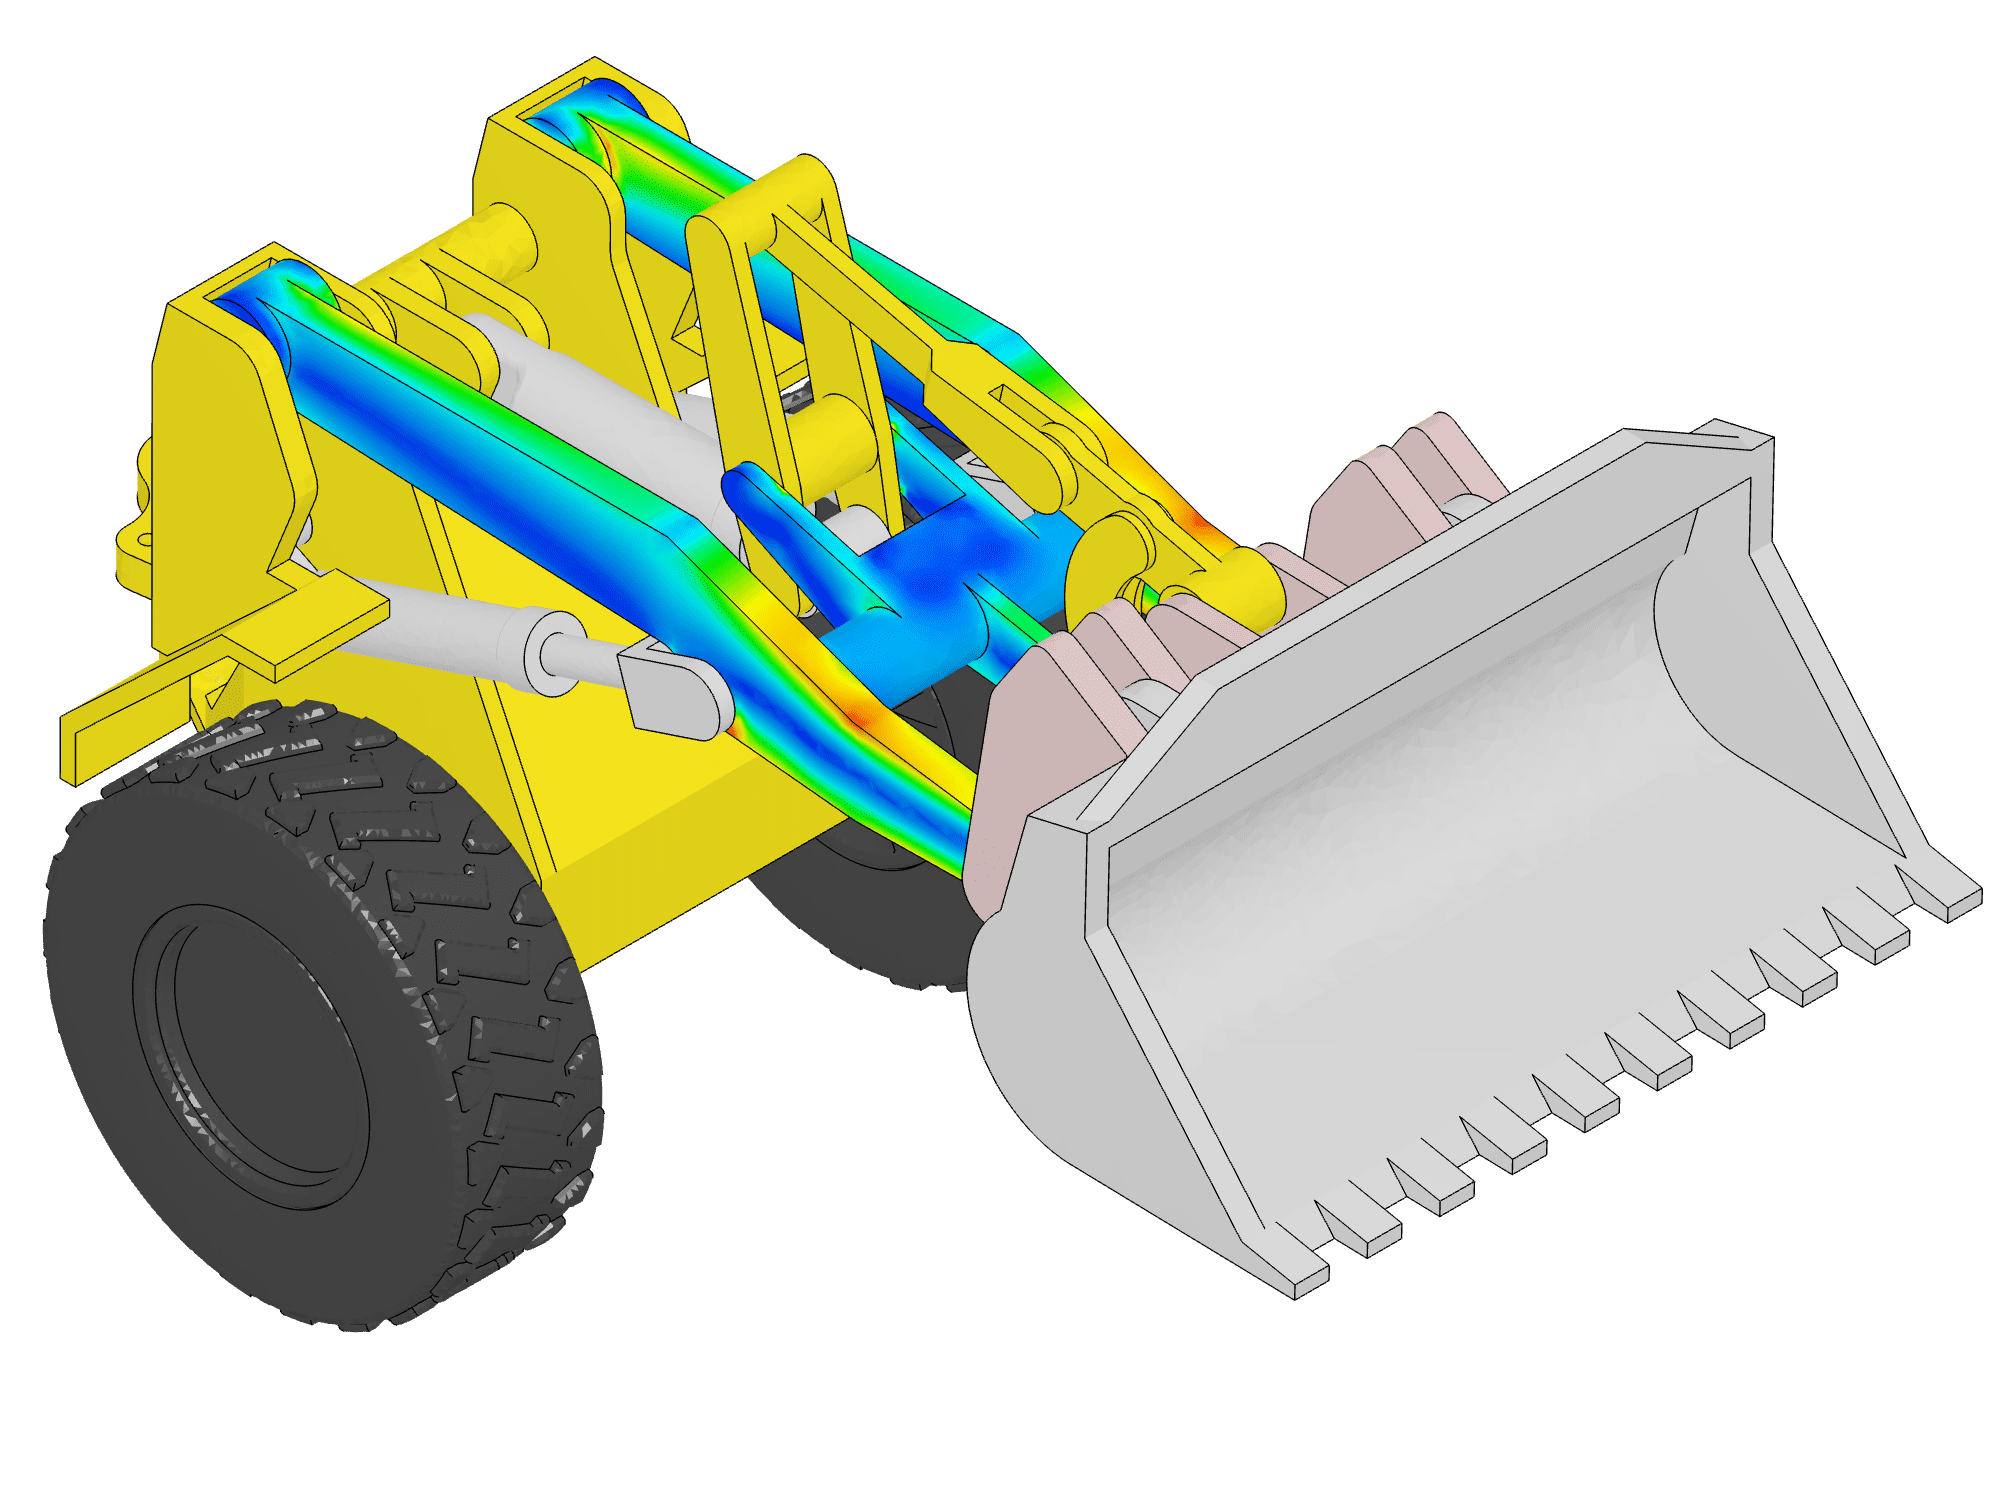
This tutorial demonstrates the process of setting up and executing a linear static analysis on a wheel loader arm using SimScale. The steps covered follow the standard SimScale simulation workflow and include:
- CAD Preparation – Import and prepare the geometry
- Simulation Setup – Define physics, materials, and boundary conditions
- Meshing – Generate the mesh using the default settings
- Simulation Run – Execute the simulation
- Post-Processing – Analyze and visualize the results
Objectives
Throughout the tutorial, the following tasks will be performed:
- Apply boundary conditions, materials, and other simulation properties
- Generate the mesh using SimScale’s standard meshing algorithm
- Visualize the resulting stress field
- Apply solid color visualization for volume rendering
- Create a safety factor field
- Measure displacements at a specific control point
1. Prepare the CAD Model and Select the Analysis Type
Begin by selecting the button below. This action copies the tutorial project, including the geometry, into the SimScale Workbench for further setup and simulation.
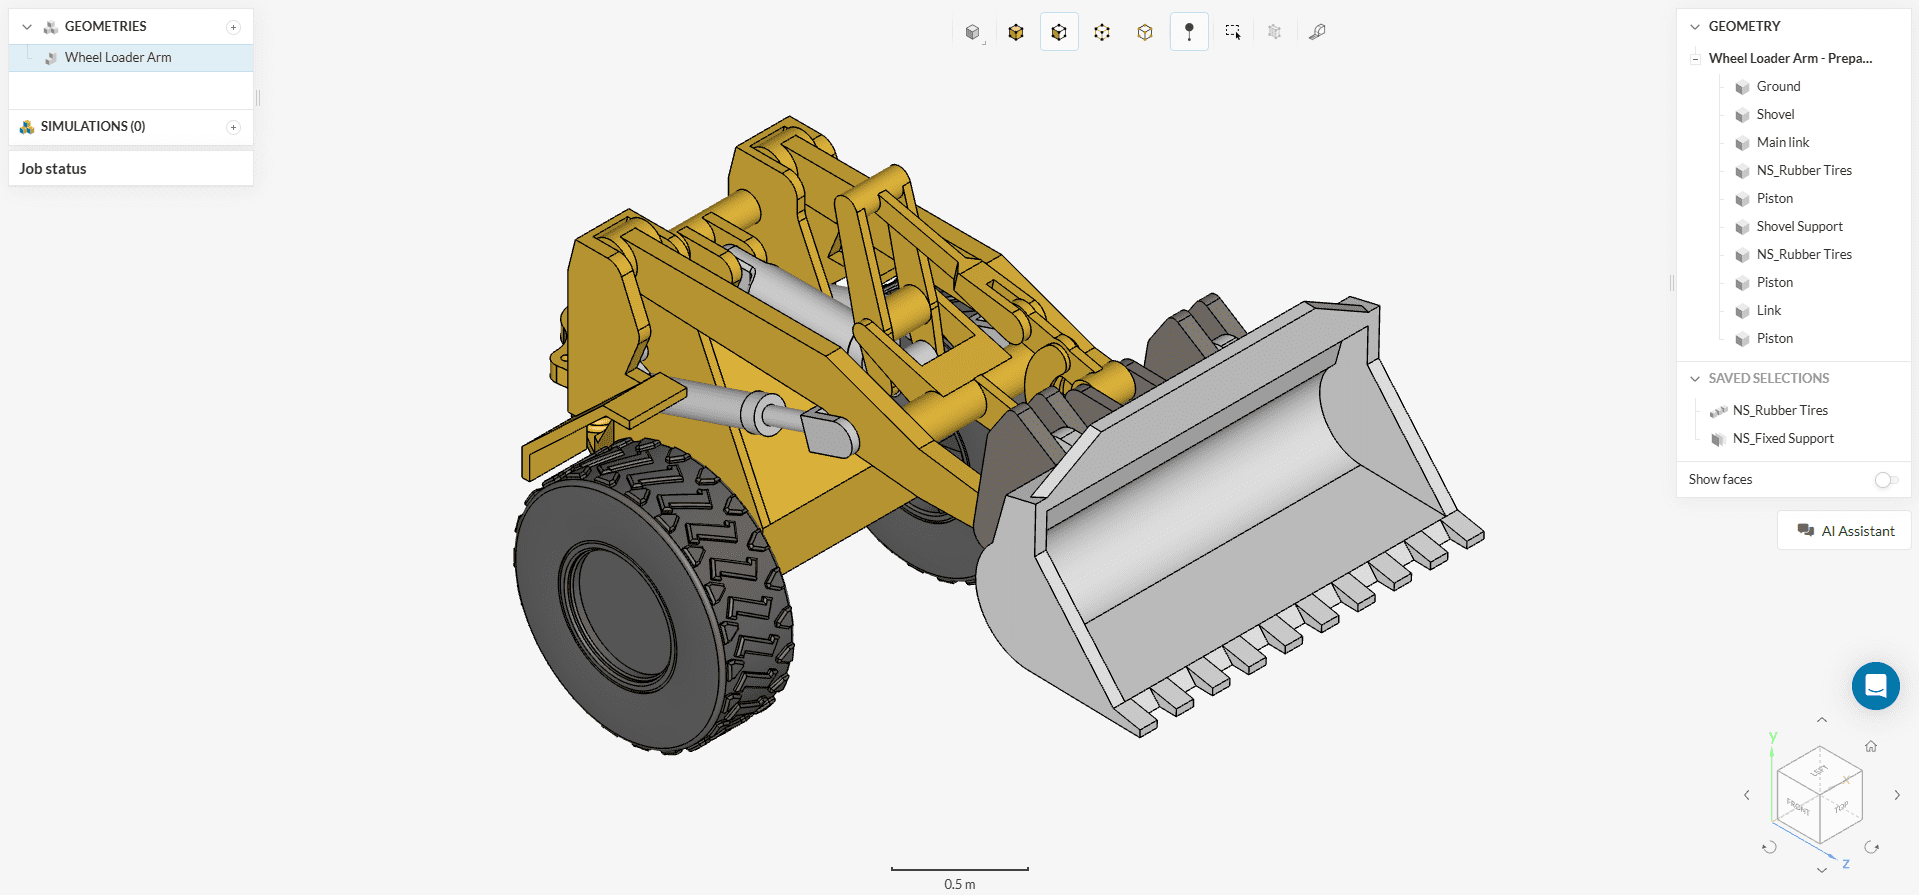
Once the tutorial project is imported, the Workbench will display an empty simulation setup along with the geometry. The image below illustrates the expected view after the import is complete.
1.1 Create the Simulation
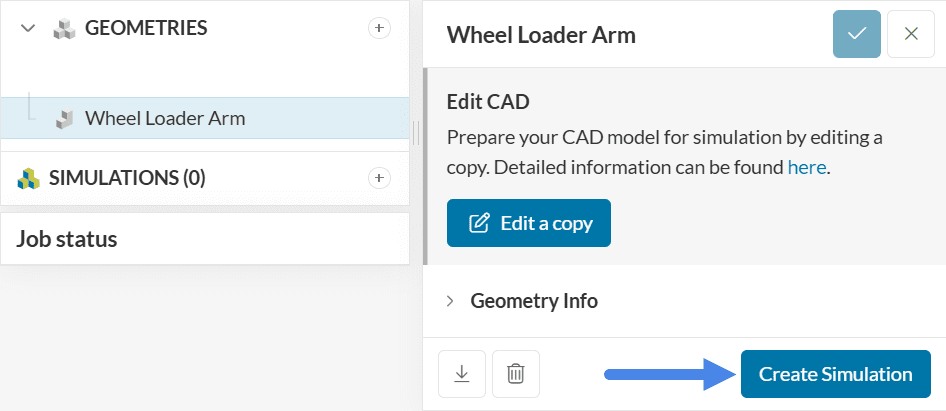
To begin the simulation setup, use the ‘Create Simulation’ button located in the geometry dialog box. This opens the simulation creation panel where analysis types can be selected.
At this stage, the simulation type selection panel appears, allowing the choice of the desired analysis type from the available options.
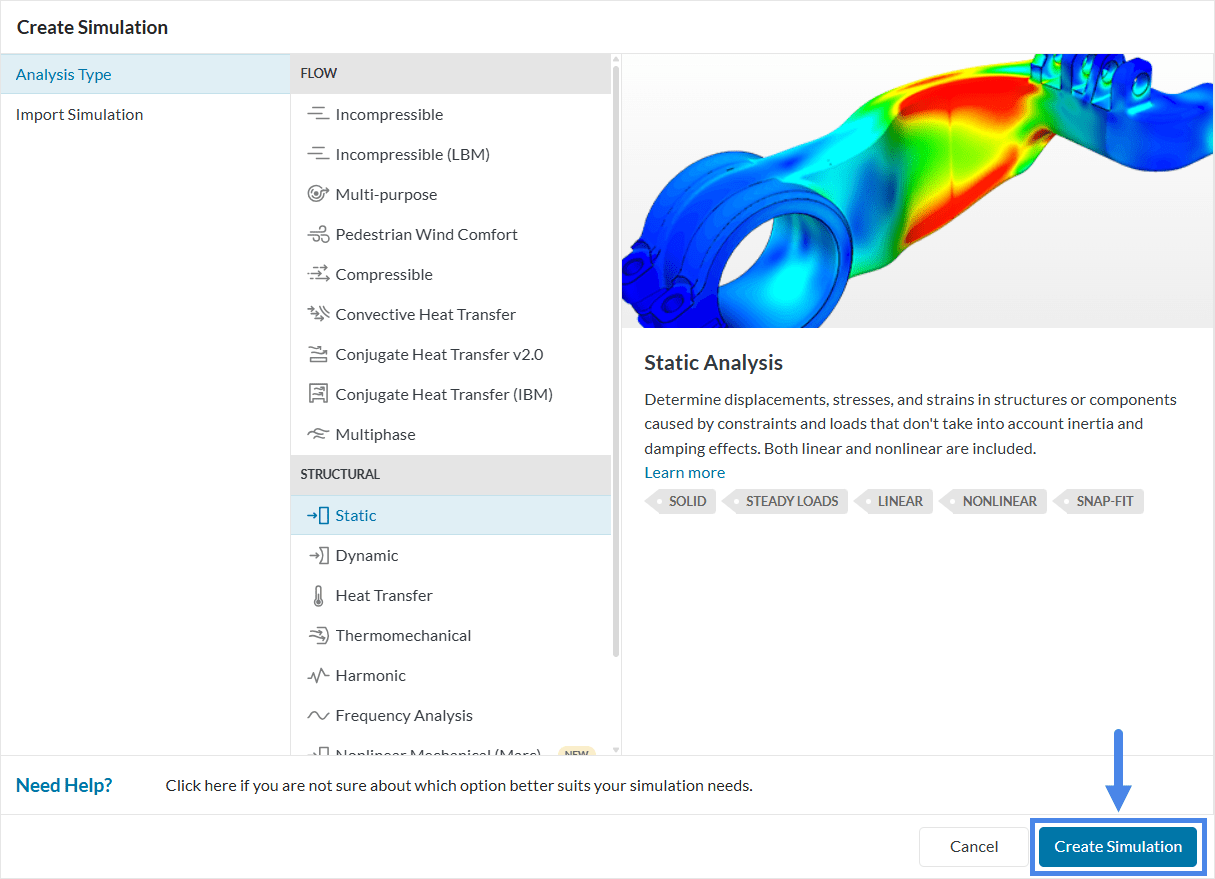
Select the ‘Static’ analysis type for this simulation.
The platform then displays the simulation tree, which lists all settings that must be defined before running the analysis.
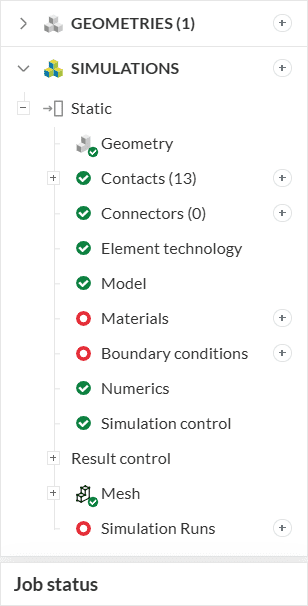
The setup for the linear static analysis of the wheel loader arm can now begin.
2. Simulation Settings
Before running the simulation, define the following key settings:
- Contacts between different parts of the assembly
- Gravity direction to simulate the effect of weight
- Materials assigned to the tires and components of the wheel loader
- Boundary conditions to reflect physical constraints and loads
2.1 Contact Settings
The first tab to configure is ‘Contacts’. Since the geometry was prepared according to best practices, all relevant faces are in direct contact in the CAD model. As a result, SimScale automatically assigns bonded contacts between touching faces when the geometry is added to the simulation.
The only required adjustment is to enable the ‘Allow node merging’ option. This setting ensures a continuous stress field across the entire assembly, leading to improved accuracy in contact modeling.
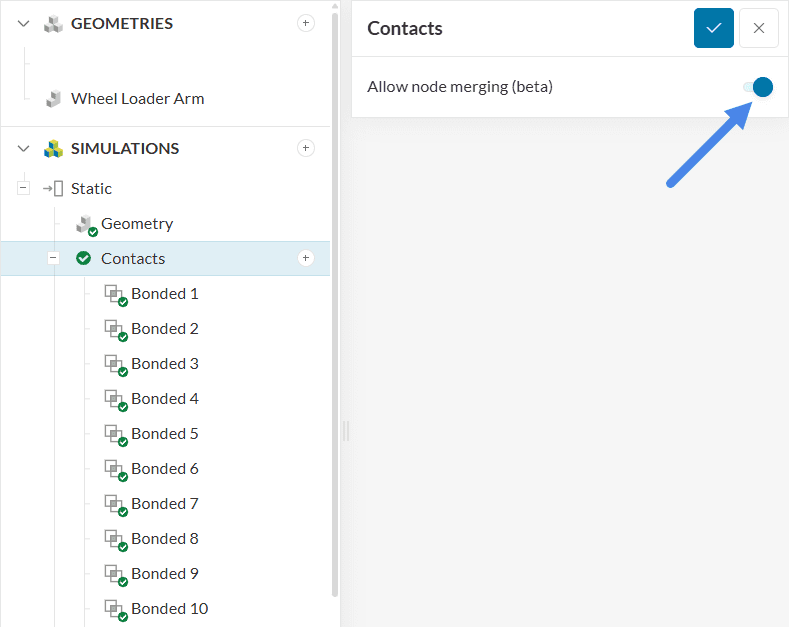
Note that this simulation uses only bonded contacts, which are of the linear kind. Bonded contacts assume a perfect connection between the selected surfaces, meaning no relative motion is allowed at the interface. The corresponding nodes on both surfaces share the same displacement, effectively creating a rigid connection between the parts in the context of the linear static analysis. To learn more about linear contacts, please check the relevant documentation.
2.2 Direction of Gravity
The gravity direction and magnitude significantly influence the simulation results, as the weight of the wheel loader arm contributes substantially to the overall load. Define gravity settings by selecting ‘Model’ from the simulation tree.
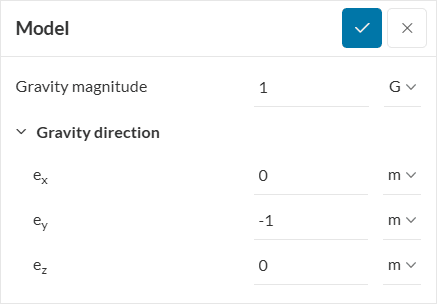
In this setup, gravity is defined with a magnitude of 1 g (equivalent to 9.81 m/s²) and acts in the negative y-direction.
2.3 Define a Material
The material for the different parts in the wheel loader arm assembly must also be defined. To select a material, click on ‘Materials’ in the simulation tree. This action opens the solid materials library, as shown in the image below.
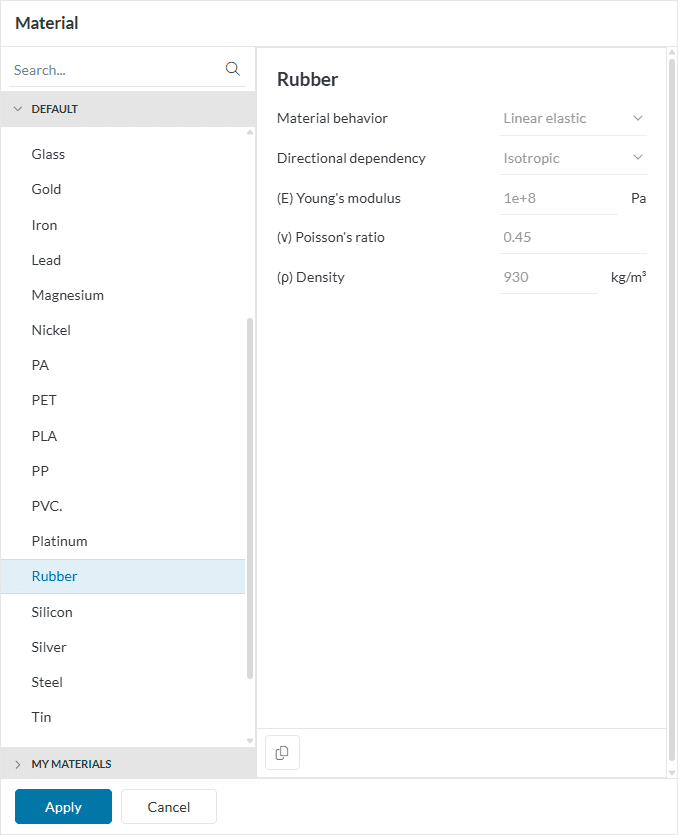
Begin by assigning material to the tires. Select ‘Rubber’ from the materials library and confirm the selection by clicking ‘Apply’. Then, use the assignment box to select the appropriate volumes. The tires can be found in the right-hand panel under ‘Saved Selections’.
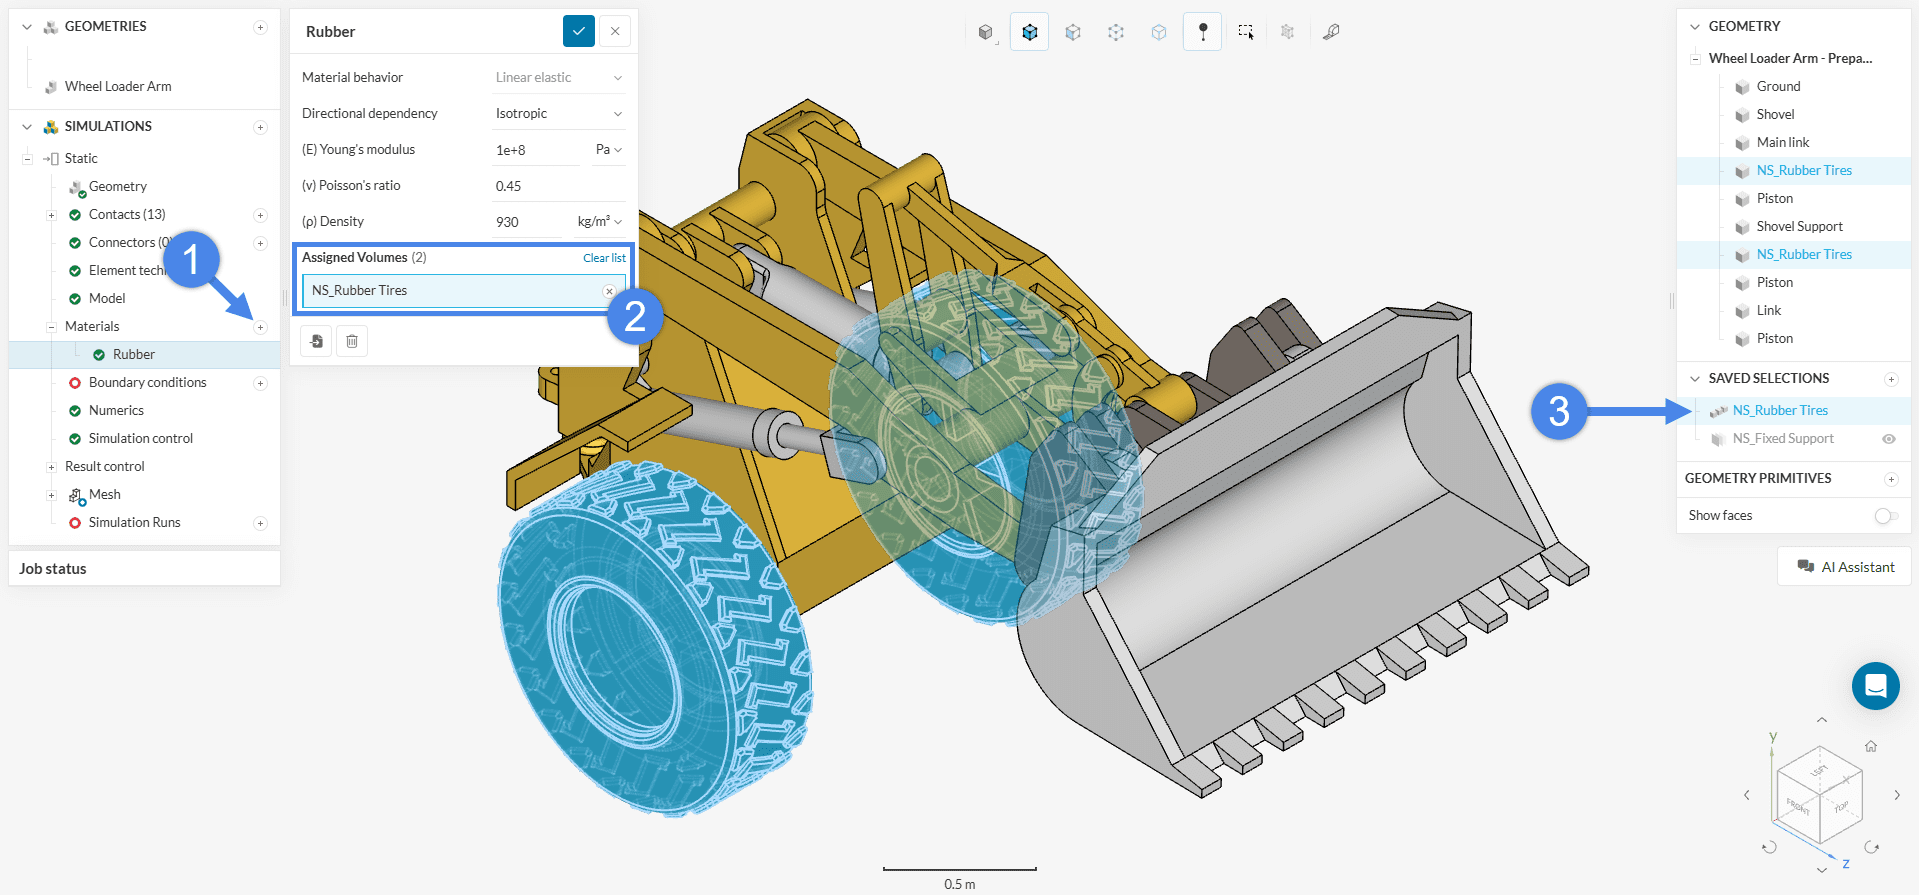
Click the check icon to save the material assignment.
Next, define the material for the remaining components of the assembly. Create a new material, then hide the rubber tires by clicking the eye icon in the right-hand panel. To assign the material, either:
- Right-click anywhere in the Workbench and choose ‘Assign all’, or
- Manually select all parts of the geometry except for the tires and assign the material.
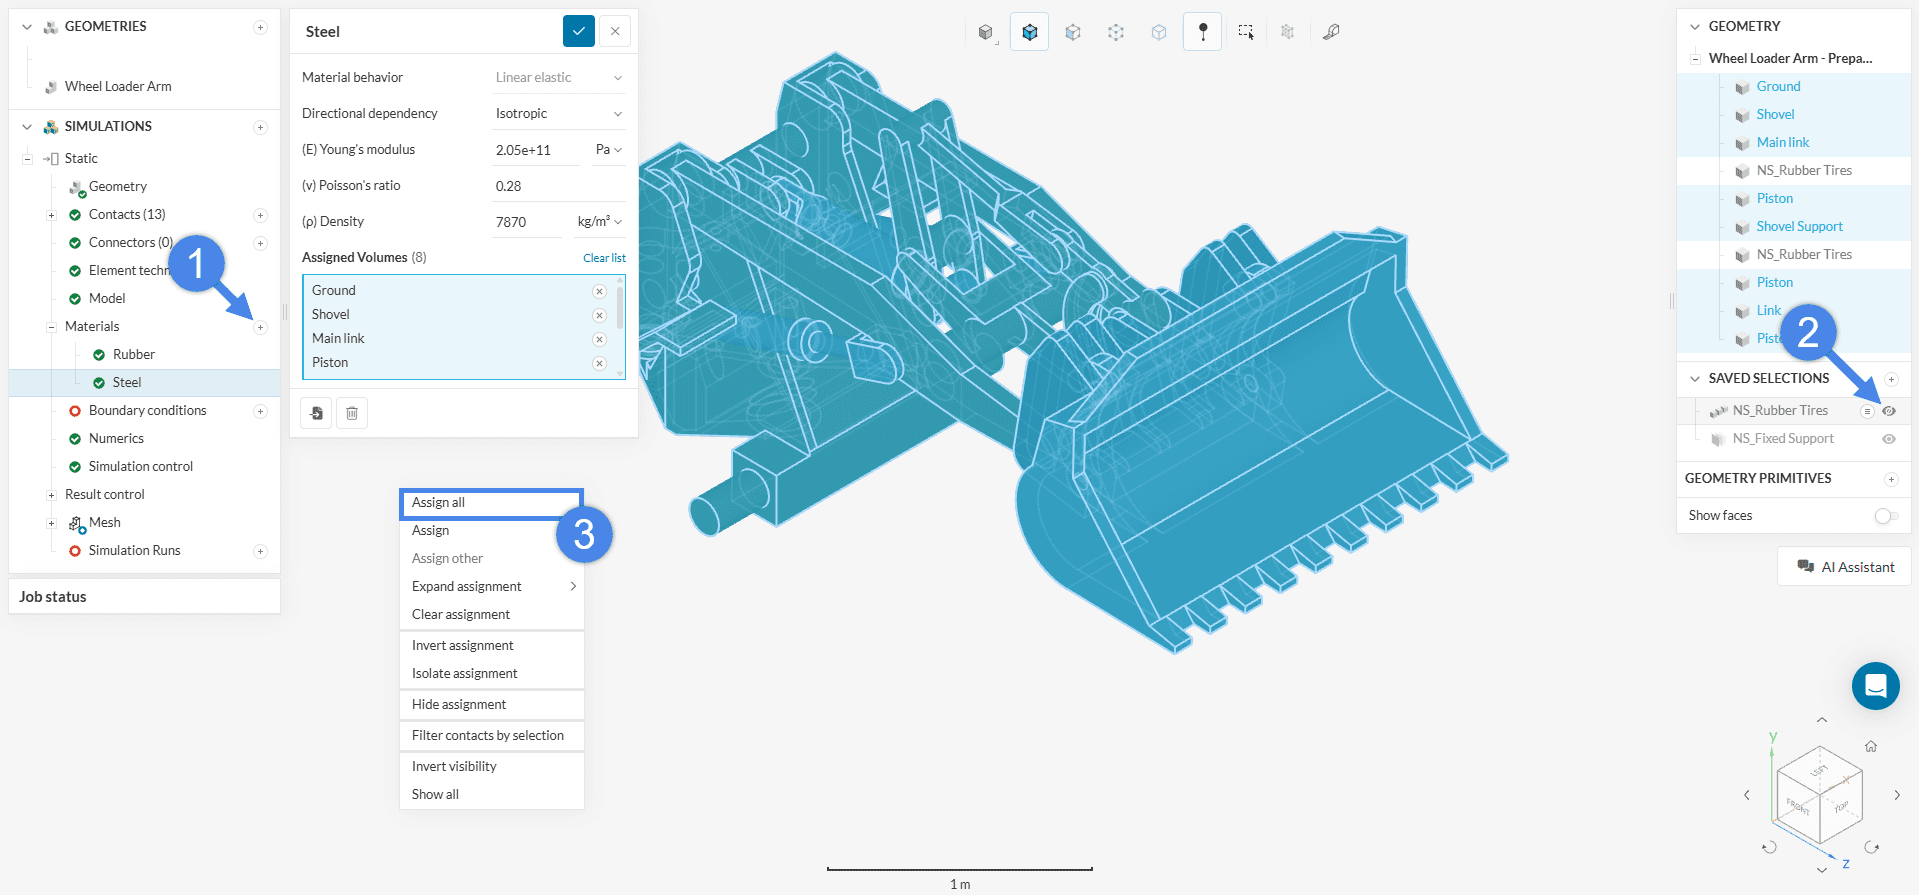
Custom materials can be defined by adjusting the material properties manually. It is also possible to assign a custom name to the material for easier identification within the project.
2.4 Assign the Boundary Conditions
Boundary conditions are essential for accurately simulating real-world behavior. They define the physical constraints and loads applied to the design. In this simulation, both ‘Fixed support‘ and ‘Force‘ boundary conditions are used. The image below provides an overview of the setup and physics involved.

The following steps describe how to assign each boundary condition required for the simulation.
a. Fixed Support
To define the first boundary condition, click the ‘+’ button next to ‘Boundary conditions’. From the list of options, select ‘Fixed support’. In the ‘Assigned faces’ section, open the selection box and choose the NS_Fixed Support entry from the ‘Saved Selections’ panel.
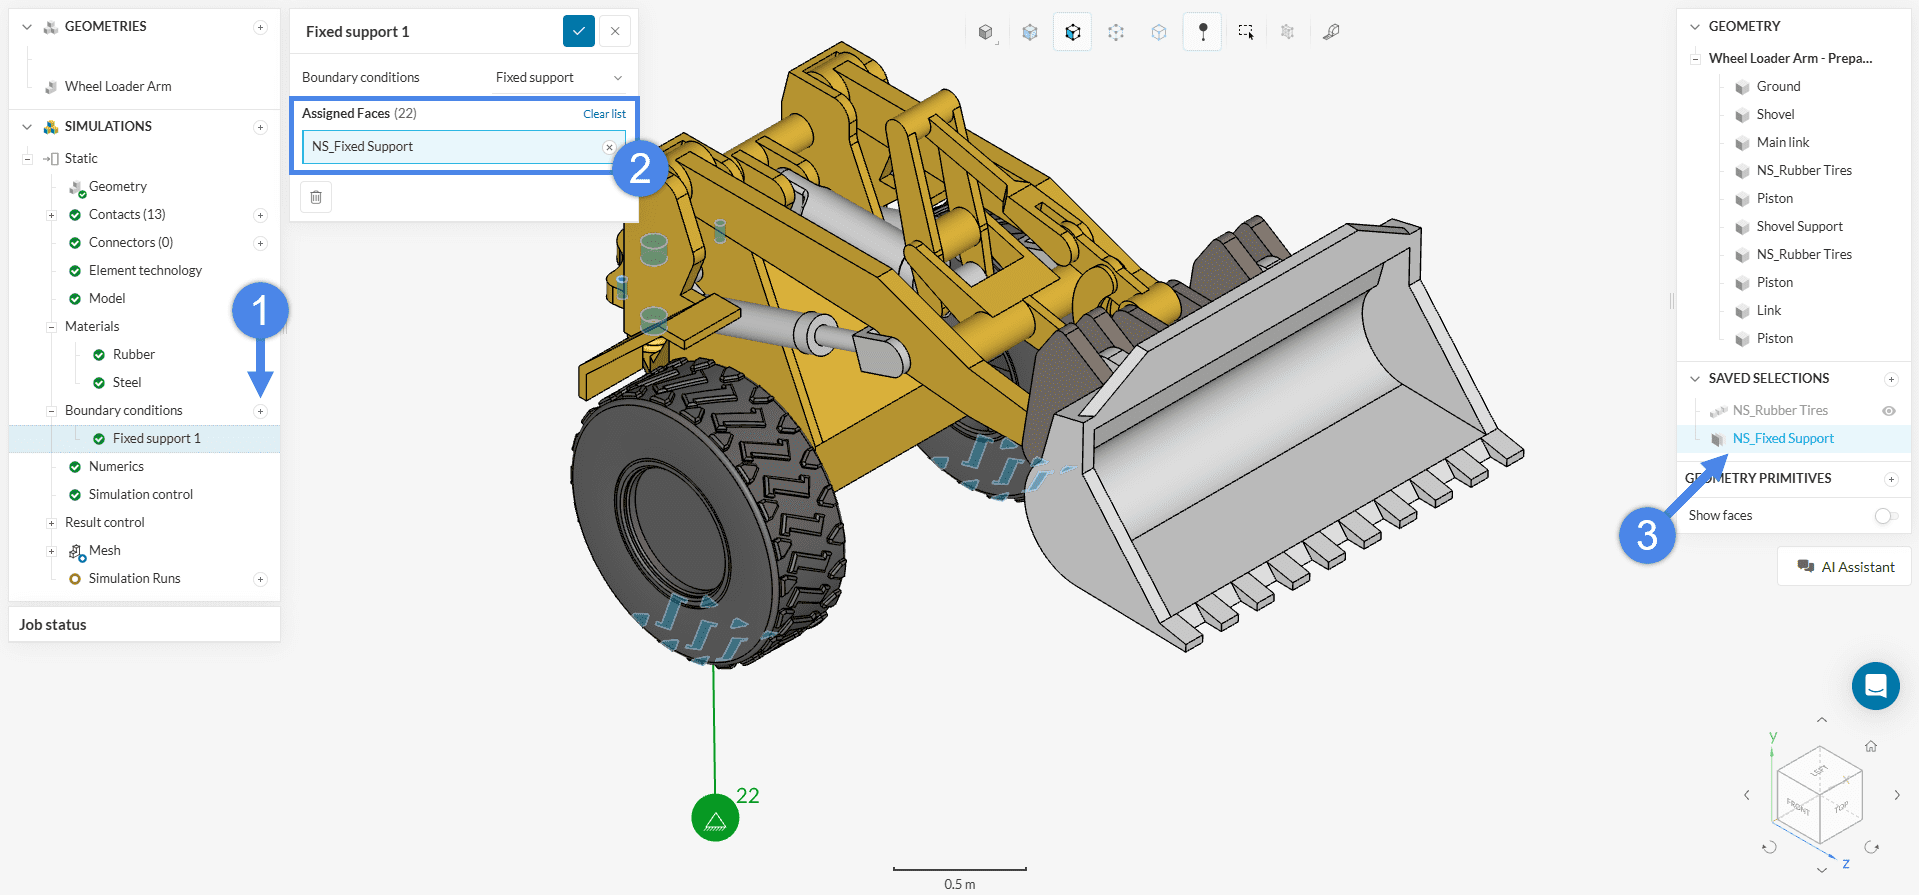
b. Force
Repeat the same process to create a ‘Force’ boundary condition. Click the ‘+’ button next to ‘Boundary conditions’, select ‘Force’ from the list, and proceed with the required assignments.
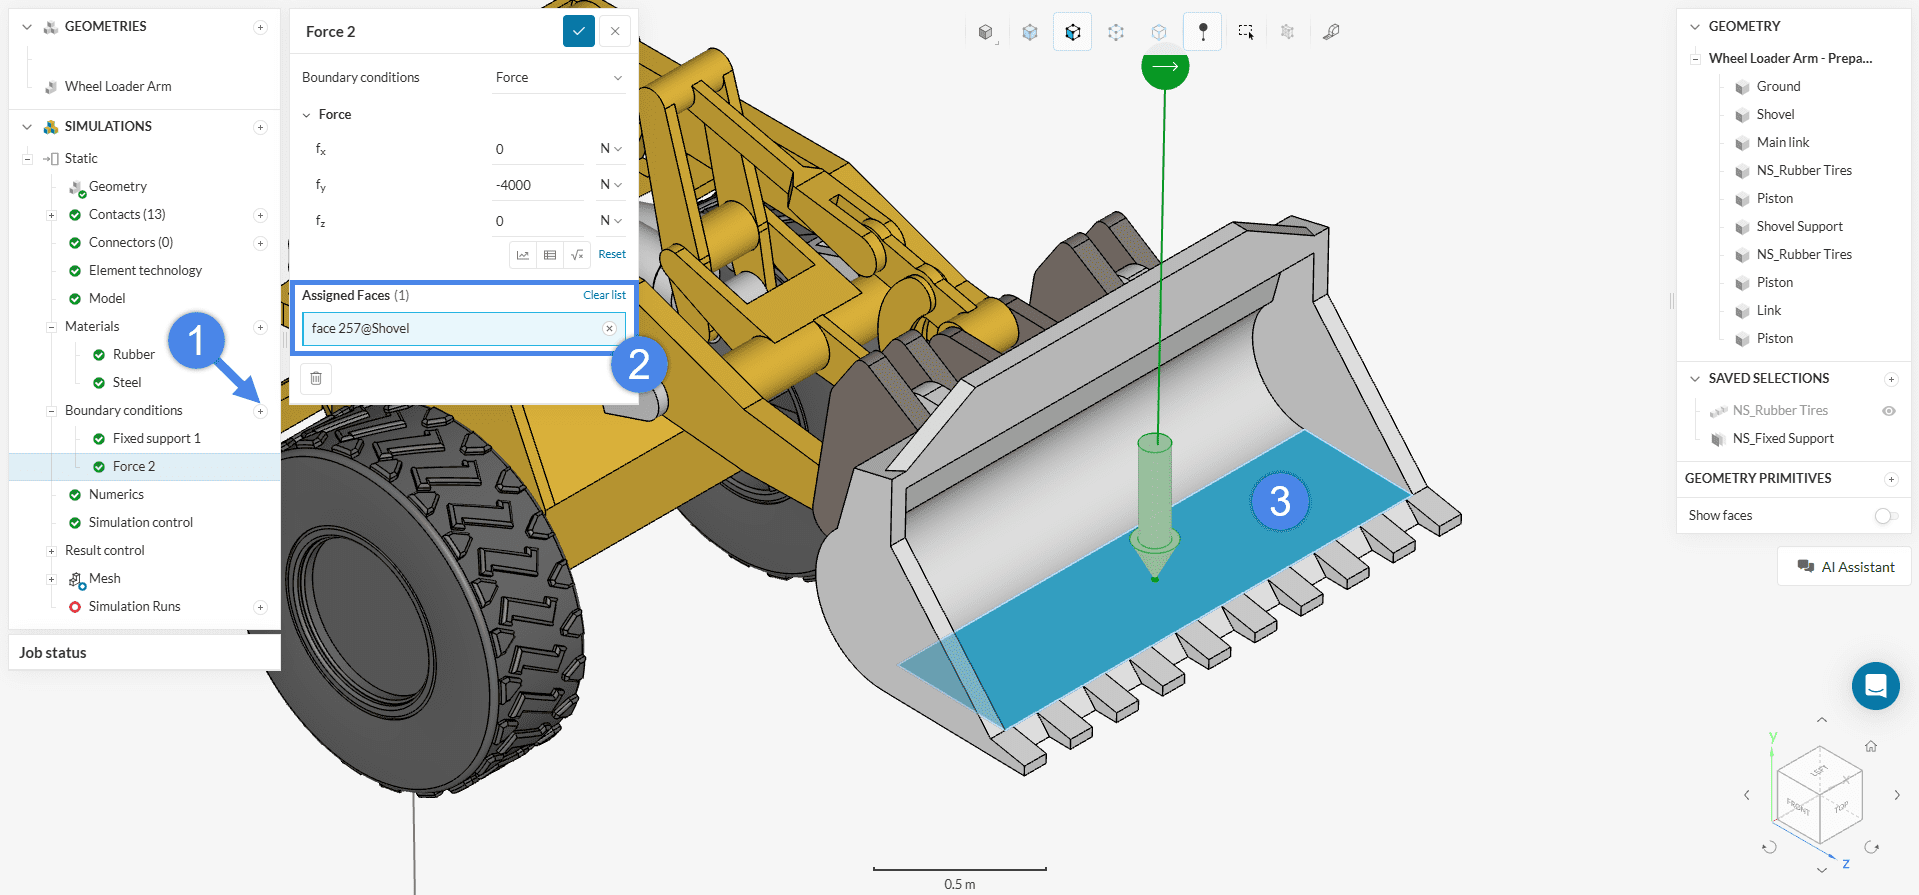
Define the force as –4000 N in the y-direction, based on the orientation indicated by the cube in the viewer.
2.5 Result Control
Displacement at a specific point is a key result in static analyses. To monitor this quantity, create a result control at the desired location.
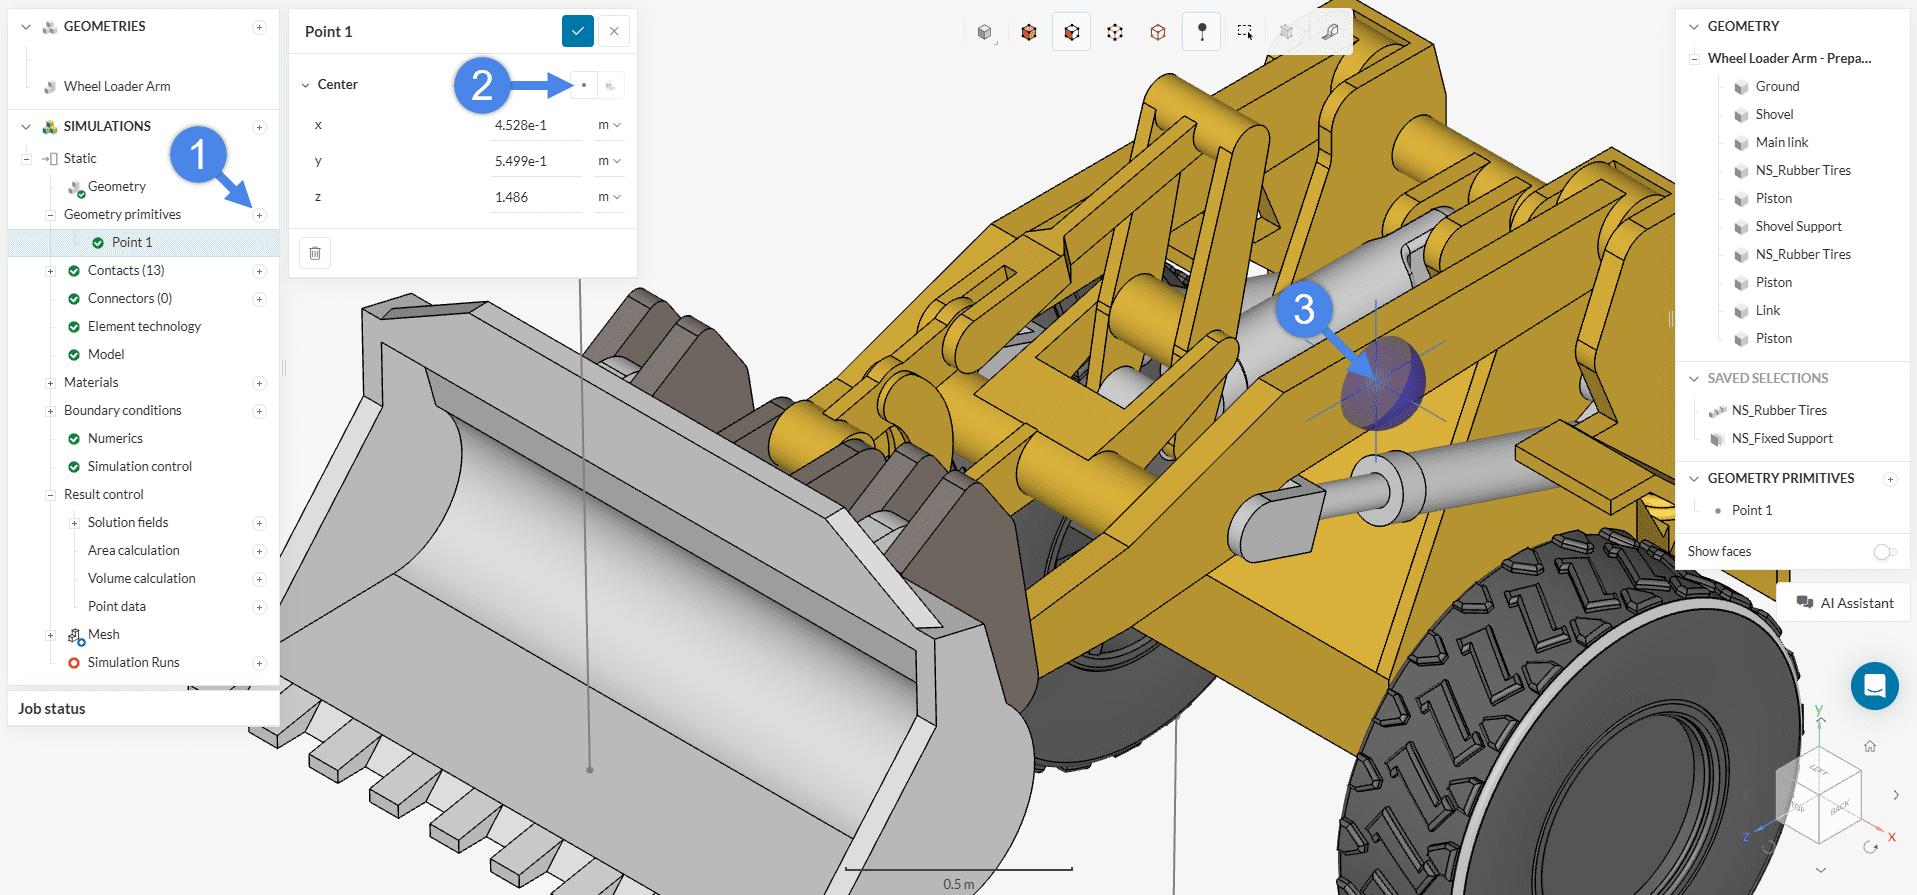
Begin by creating a point geometry primitive via ‘Geometry Primitives’ > ‘Point’. Use the ‘Pick from Viewer’ option to select a point on the surface of the wheel loader arm. This point will serve as the reference for the displacement measurement.
Next, navigate to ‘Result Control’ > ‘Point data’ and create a new control item. Assign it to the previously defined ‘Point 1’ to track the displacement at that location.
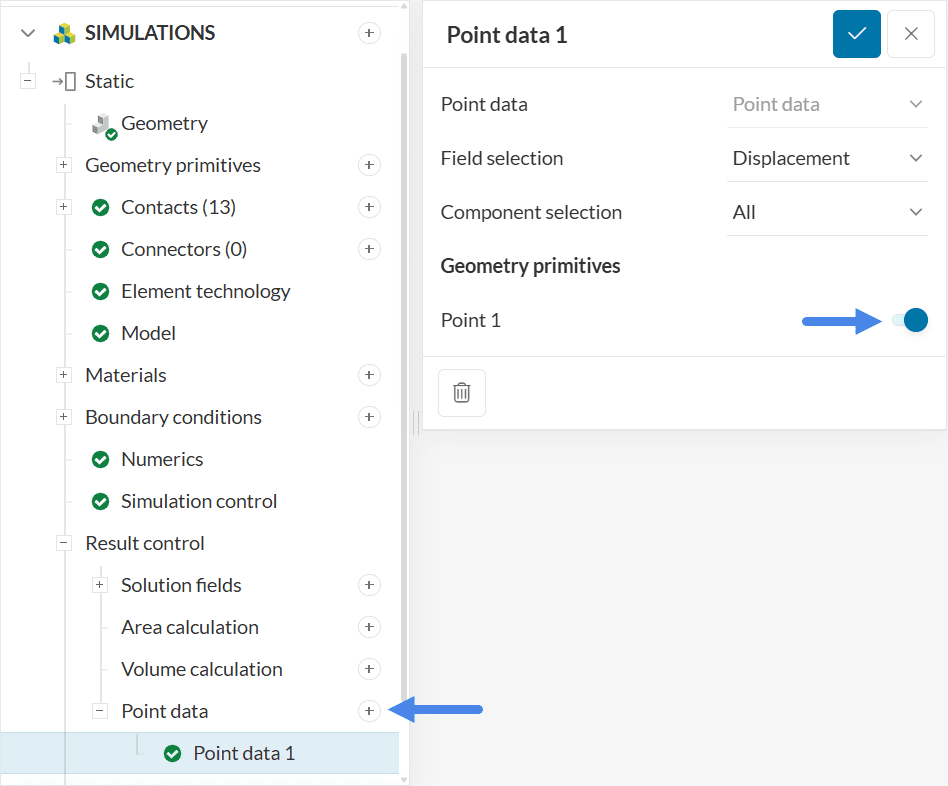
The displacement results for each spatial direction can be accessed under Completed run > ‘Point data’ once the simulation finishes.
Note
No changes were made for the Numerics and Result control settings for this tutorial as default settings will be sufficient.
3. Mesh
To generate the mesh, use the ‘Standard’ meshing algorithm, which is automated and typically provides good results for most geometries.
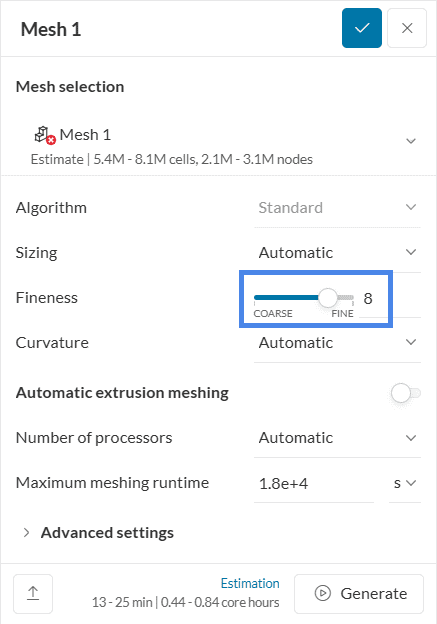
For this simulation, adjust the fineness level to 8 instead of the default value of 5. In linear static simulations, SimScale automatically creates second-order meshes, which enhance the accuracy of the analysis.
Why 2nd Order Elements?
Second-order elements are generally recommended for static analyses due to their improved accuracy in capturing deformation and stress gradients. For more details, refer to the article: Which type of finite element should I use?
The mesh order can be specified under the Element Technology tab in the simulation tree. More information is available here: Element Technology
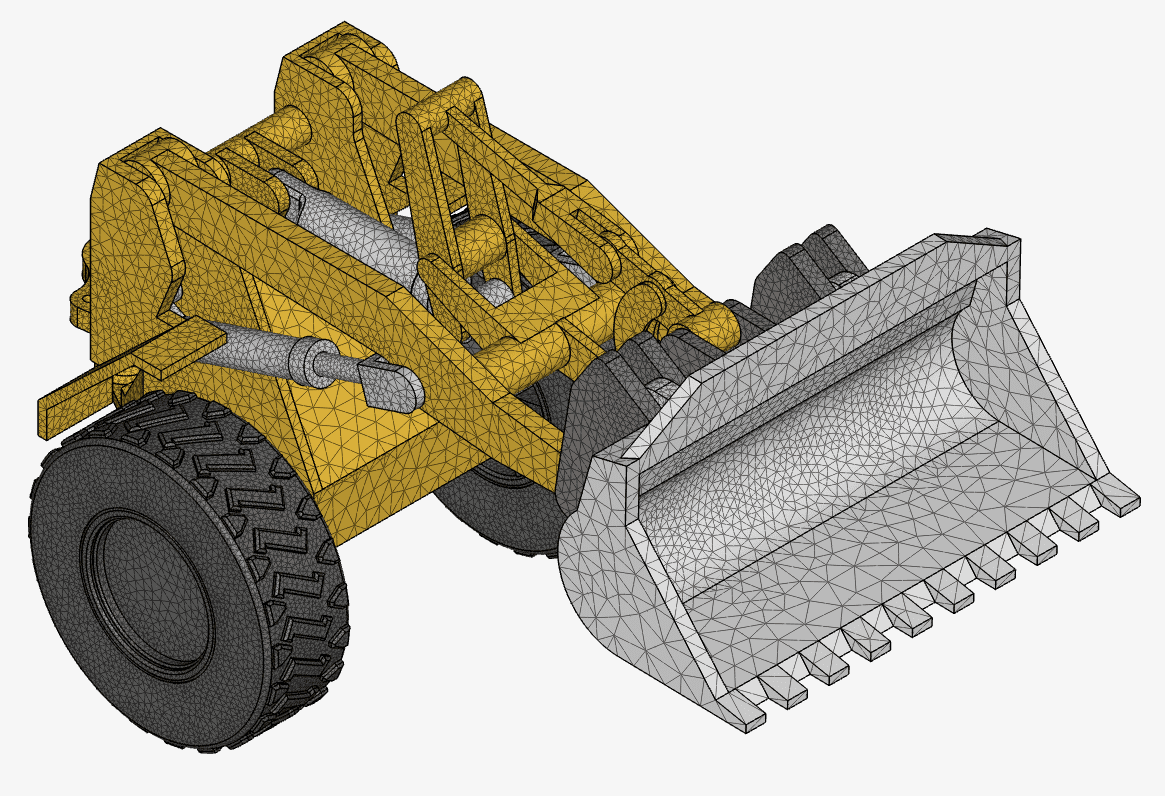
The resulting mesh appears as shown below, illustrating the geometry discretized with second-order elements and a fineness level of 8.
Related Meshing Knowledge Base Articles
For further guidance on meshing techniques and best practices, consider reviewing the following knowledge base articles:
4. Start the Simulation
To start the simulation, click the ‘+’ button next to ‘Simulation Runs’ in the simulation tree. This initiates a new run using the defined setup and mesh.
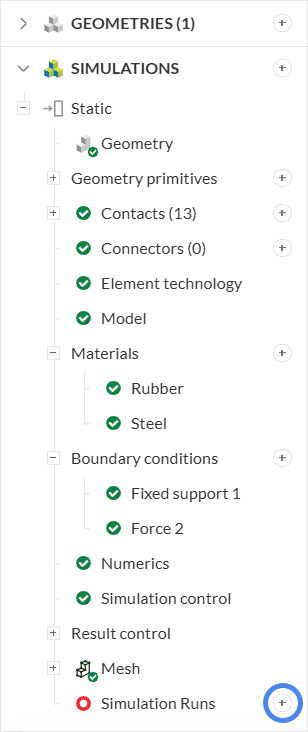
A dialog box appears displaying an estimate of the computing resources required to run the simulation. Proceed by clicking ‘Start’ to begin the simulation run.
5. Post-Processing
Once the simulation run finishes, results can be accessed in one of the following ways:
- Click on ‘Solution fields’ under the simulation run, or
- Click on the ‘Post-process results’ button in the run dialog.
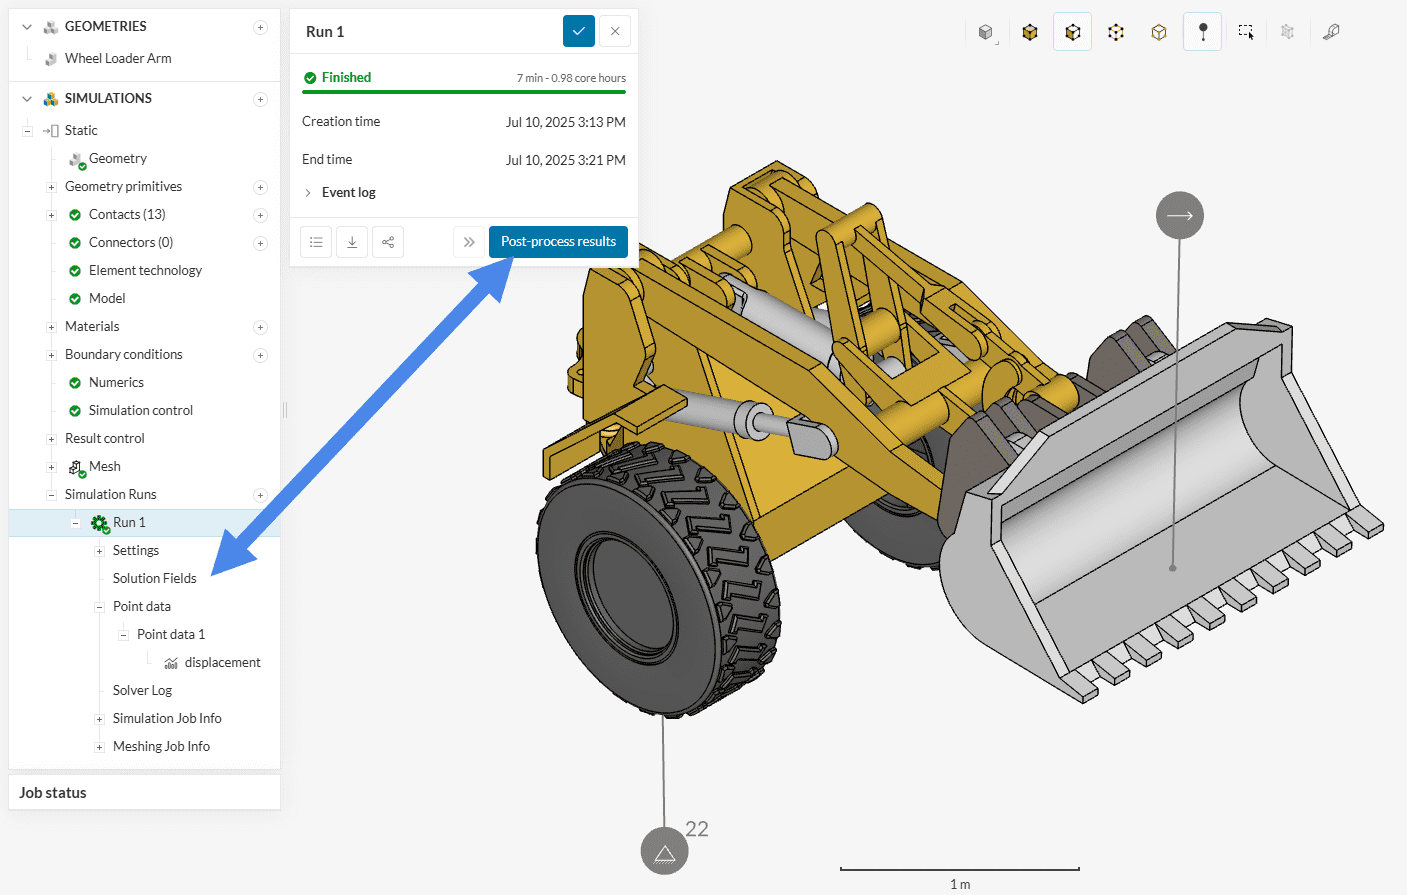
In the post-processing environment, analysis of the simulation results can begin. This tutorial focuses on the following post-processing tasks:
- Visualizing the von Mises stress field
- Changing the volume rendering to solid colors instead of result fields
- Creating a safety factor field
- Reviewing the result control data for displacement at the defined point
5.1 Von Mises Stress
To analyze the von Mises stress on the wheel loader arm:
- Set ‘Parts Color’ to von Mises Stress in the post-processing panel
- Change the stress units from Pa to MPa for improved readability
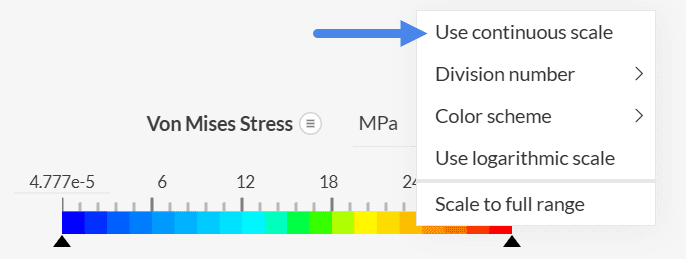
- Adjust the upper threshold of the color legend to 30 MPa to enhance contrast and detail in the stress distribution

When stress gradients are clearly visible, switching to a continuous scale provides a smoother and more accurate visualization. To enable this, right-click on the legend and select Use continuous scale.
Volume color customization
For improved visual clarity or to generate presentation-ready images, volume colors can be customized in the post-processor.
To change the color of specific volumes:
- Select the desired volumes
- Right-click and choose ‘Edit color’
- Pick a preferred color from the palette
The example below illustrates this feature applied to the tires.
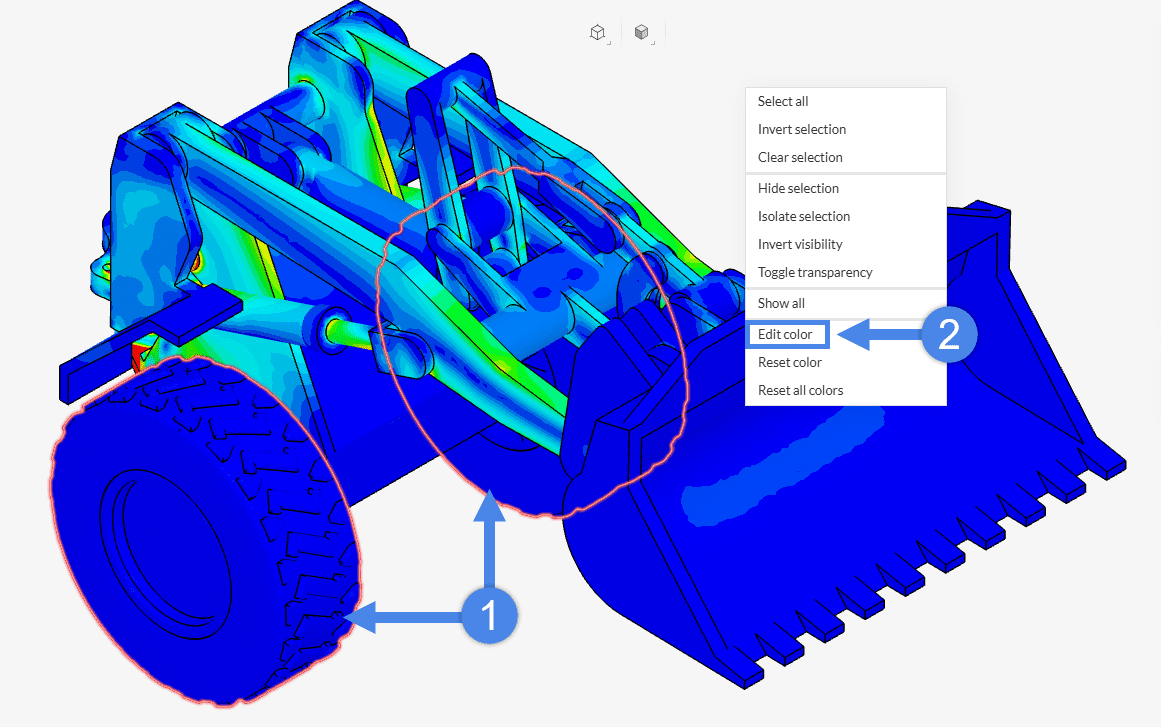
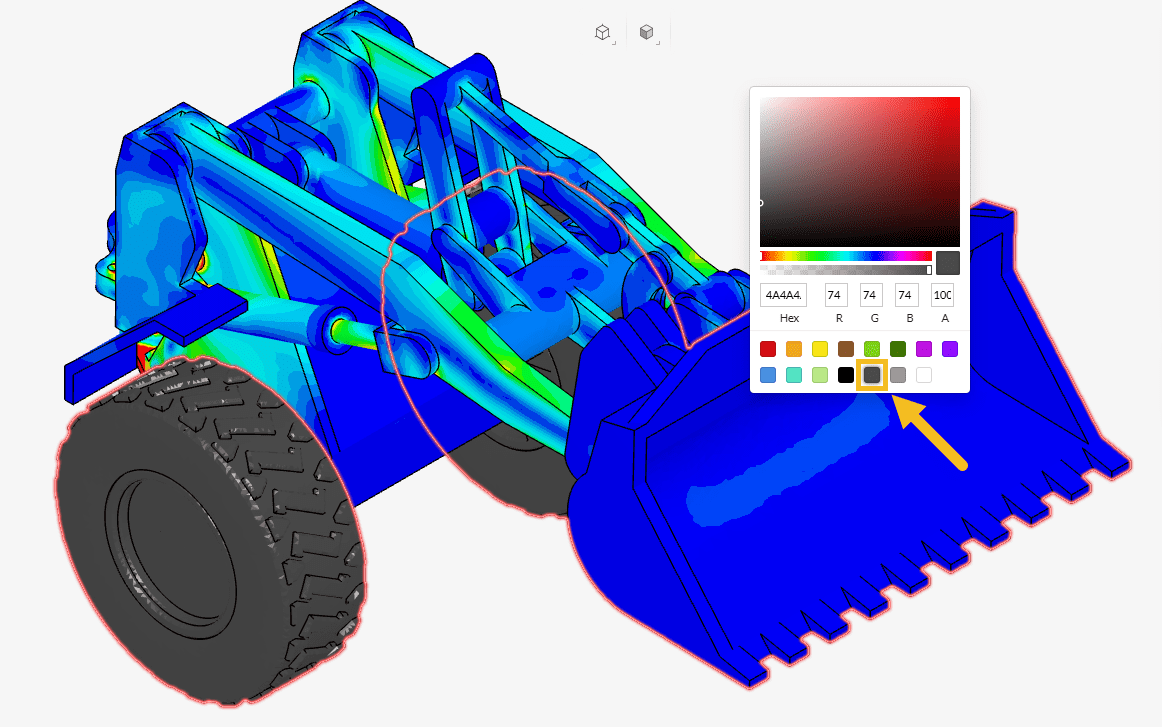
Figure 22: How to assign a solid color to individual parts in the Wheel Loader Arm assembly
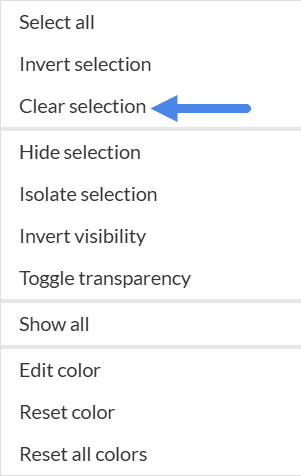
To assign a solid color to additional parts:
- Right-click anywhere in the viewer and select ‘Clear selection’
- Select the new volumes to be edited
- Right-click and repeat the ‘Edit color’ workflow as previously described
This process can be repeated for each group of parts requiring a different solid color.
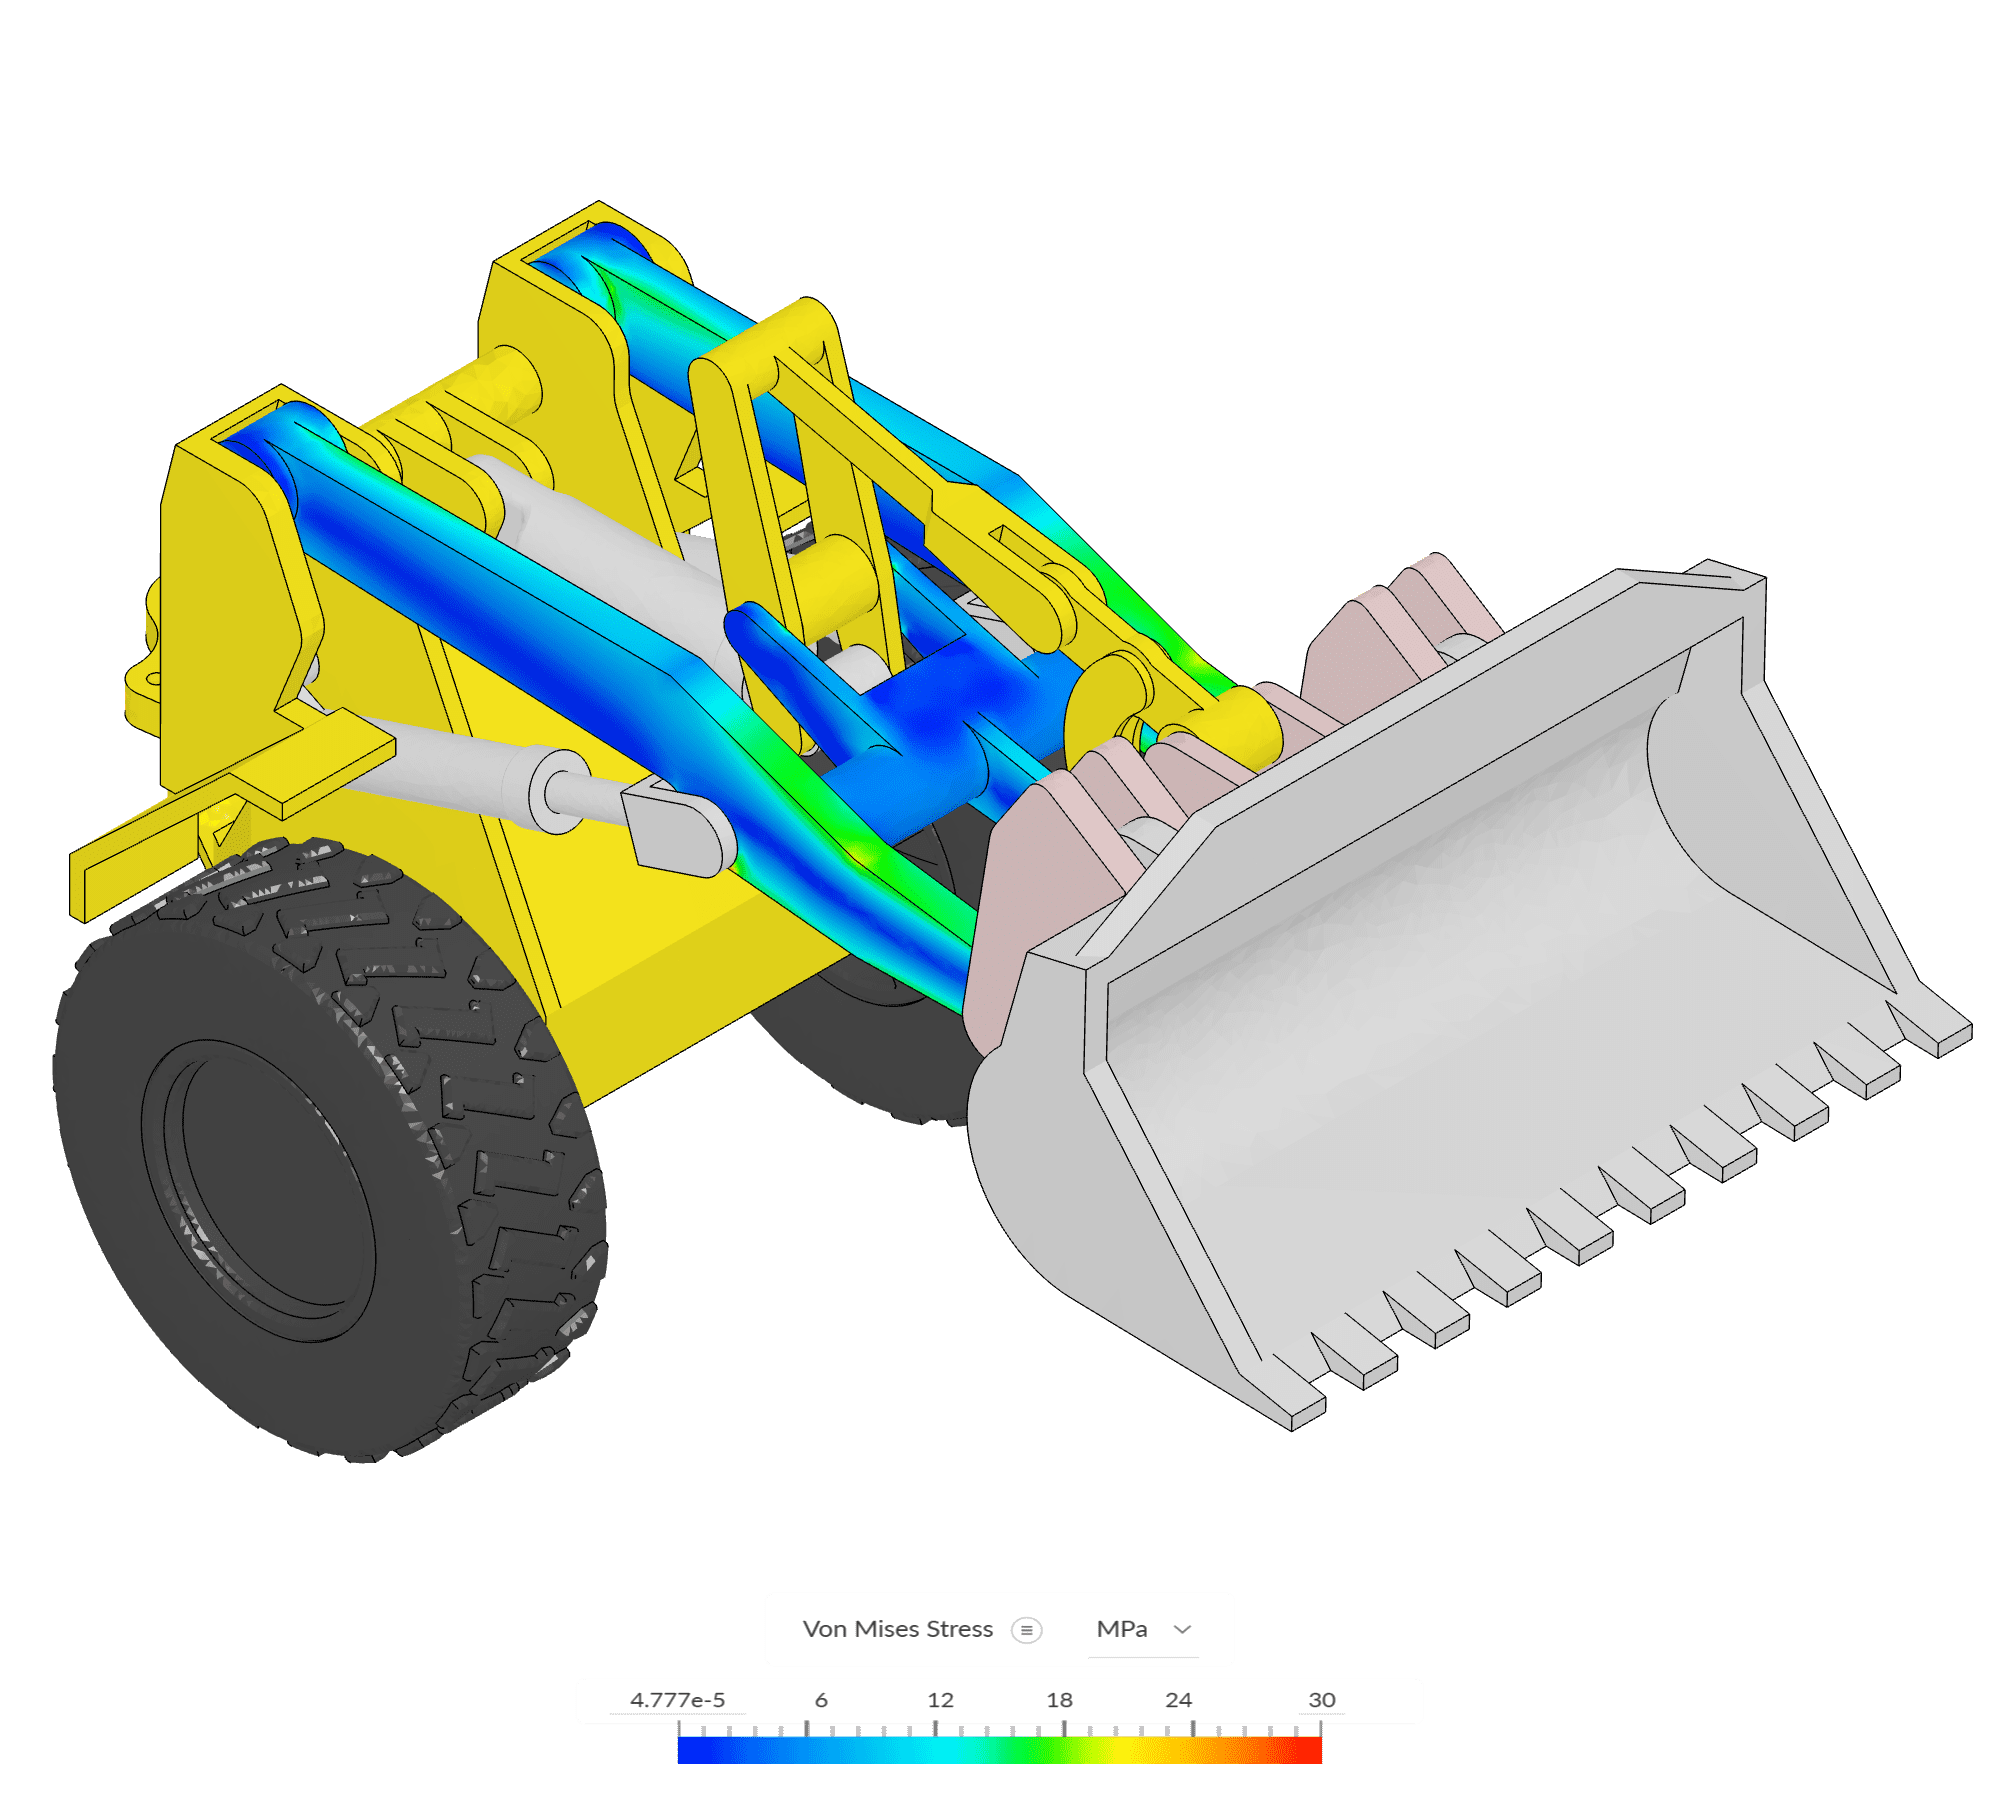
Final visualization
After adjusting the legend, configuring the field display, and applying the desired solid colors, the von Mises stress field becomes clearly visible while highlighting the Main Link component.
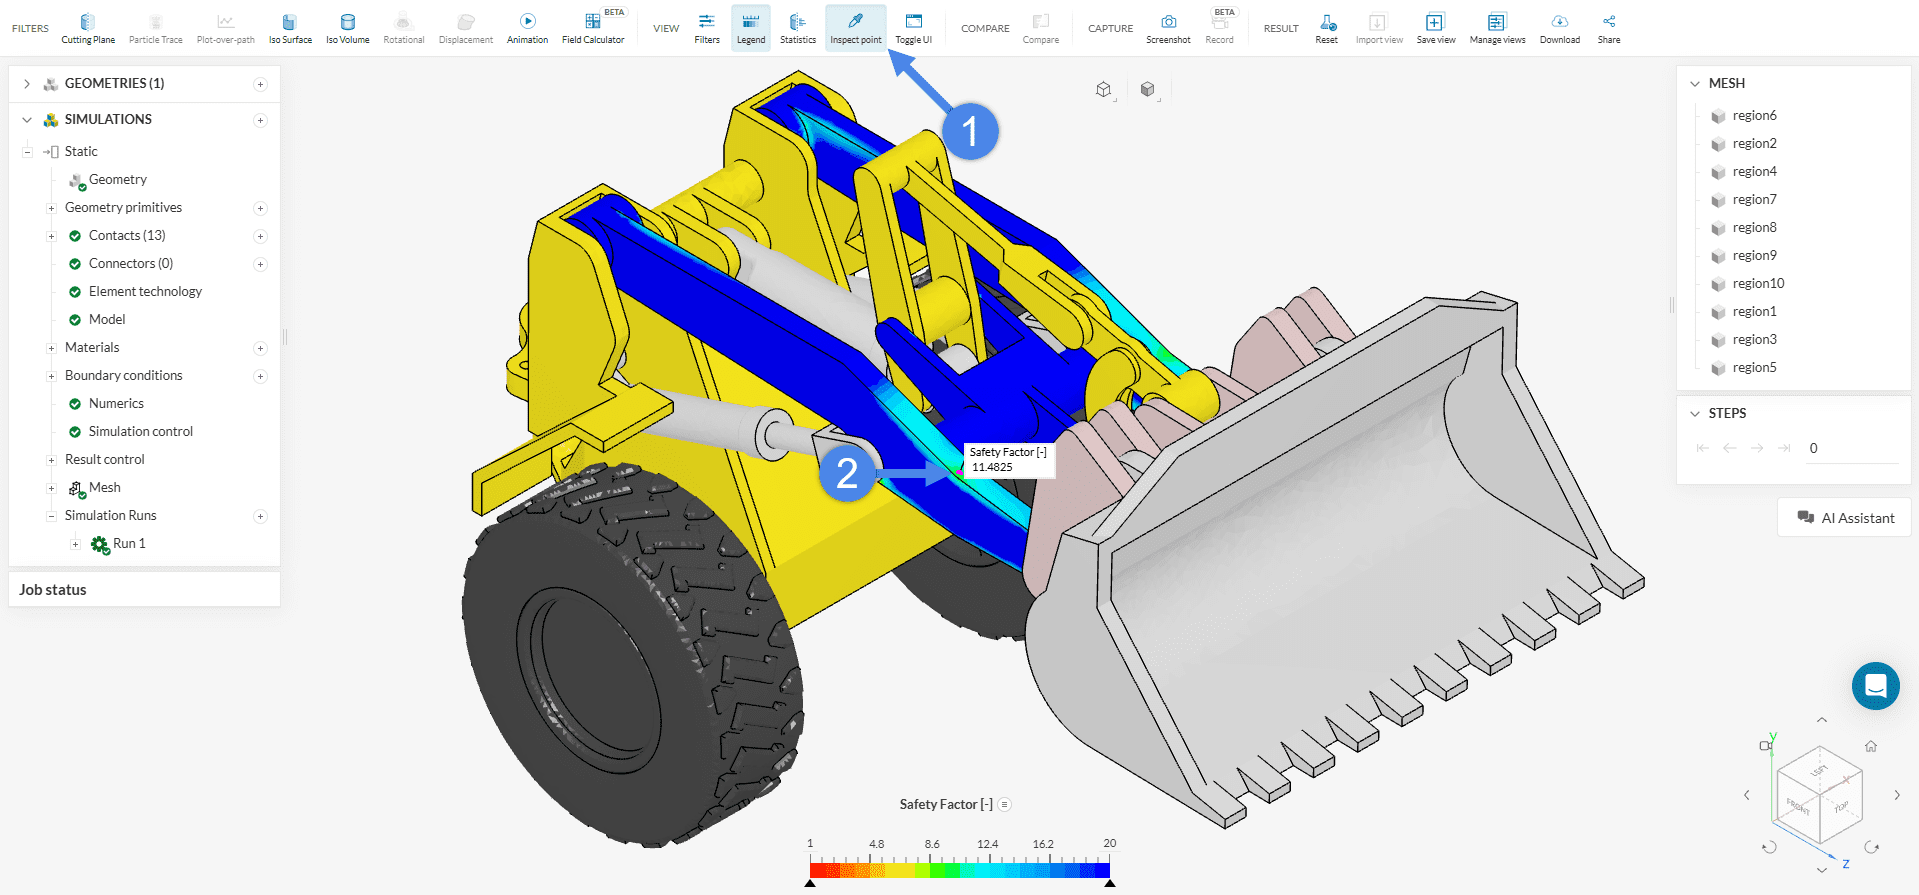
5.2 Create a Safety Factor Visualization
An important result in structural analysis is the Safety Factor field, which provides insight into how close the structure is to failure. It is calculated as:
$$ S_f = \frac{\sigma_y}{\sigma_{vm}} $$
where:
- is the material yield strength
- is the von Mises stress
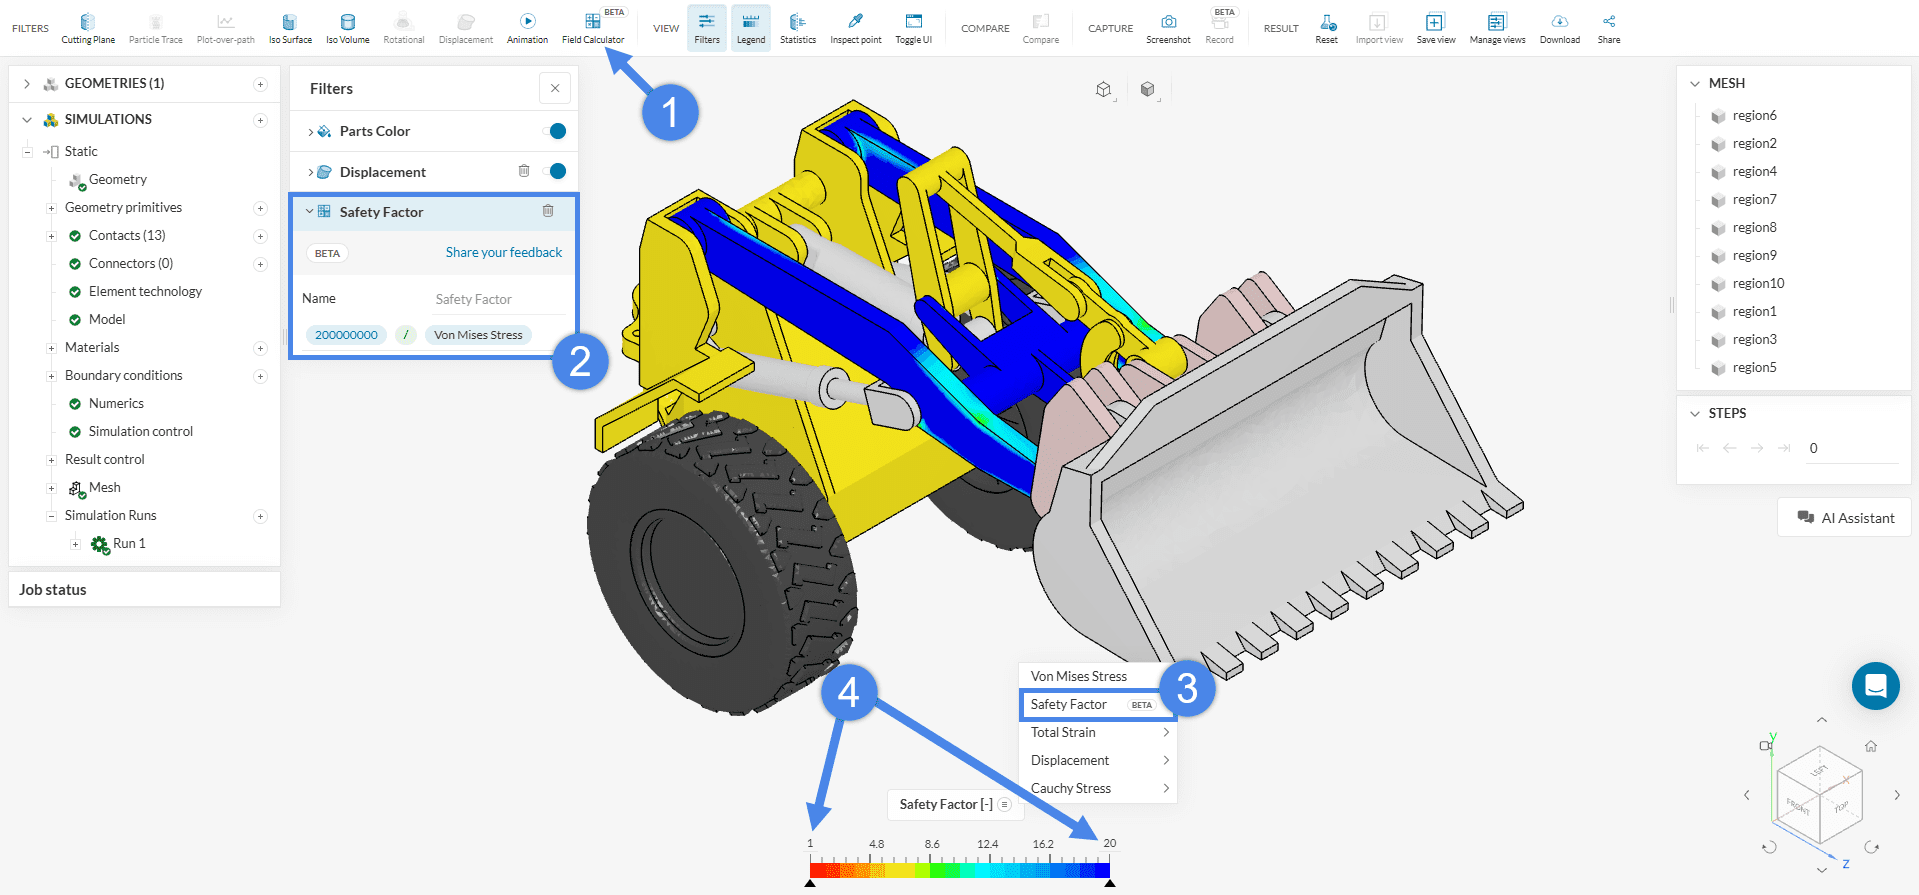
This field can be created using the ‘Field Calculator‘ in the post-processor, as illustrated in Figure 25.
To visualize the safety factor:
- Enable the new field in the legend
- Adjust the legend limits for better contrast
- Right-click the legend and select the ‘Normal inverted’ color scheme, which highlights lower (more critical) values more effectively
Below are key considerations when using the ‘Field Calculator’ in the post-processor:
- Press
Enterafter each input (numbers, operators like +, -, *, /, parentheses, fields such as Von Mises Stress, or functions likeabs,sqrtto apply it to the expression. - All inputs must use SI units. For stress, this means working in Pascals (Pa), not MPa or kpsi.
- Once a field is created using the calculator, it cannot be edited. To make changes, a new field must be created.
- After generating the field and adjusting the visualization, use the ‘Inspect Point’ tool to click on any region of the model and retrieve the corresponding field value.
5.3 Displacement at the control point
To access the displacement values:
- Navigate to ‘Run 1’ > ‘Point data’ in the simulation tree
- Click on the result item to visualize a table displaying the displacement components (x, y, z) at the specified control point
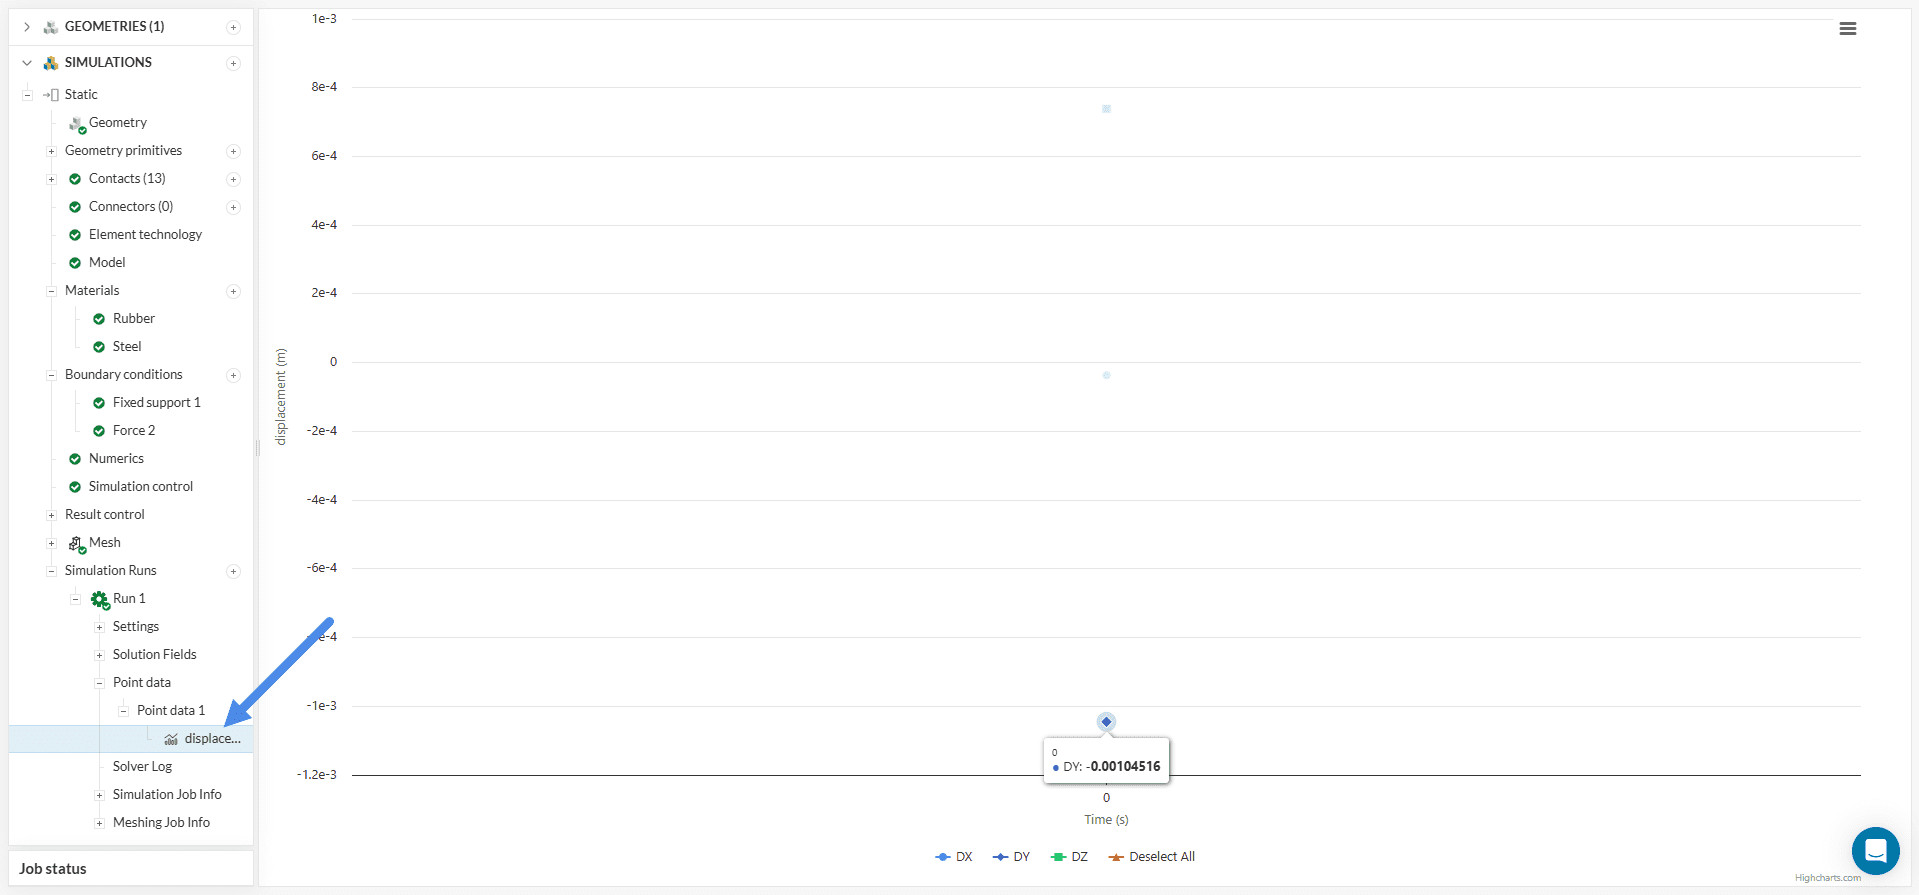
The displacement measured at the control point indicates that the maximum deformation occurs in the y-direction, which aligns with the direction of the applied force. The observed displacement is approximately 1 mm.
Congratulations! You finished the tutorial!
Note
If you have questions or suggestions, please reach out either via the forum or contact us directly.