Documentation
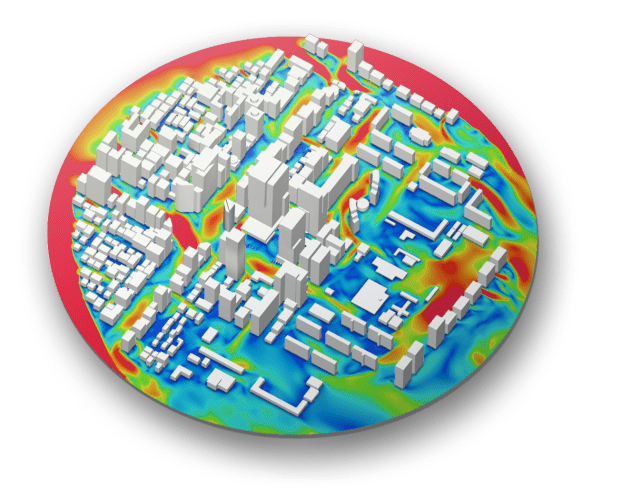
The Pedestrian Wind Comfort (PWC) analysis type is used to assess the effects of building’s external aerodynamics on pedestrians which typically returns a comfort map in an exported environment representing the activities that can be done and where. This is usually done to demonstrate that new development (e.g. building) does not interfere with pedestrian comfort, or if it can be used to experiment with mitigation features (trees, screens, and canopies for example) to ensure that pedestrians remain comfortable.
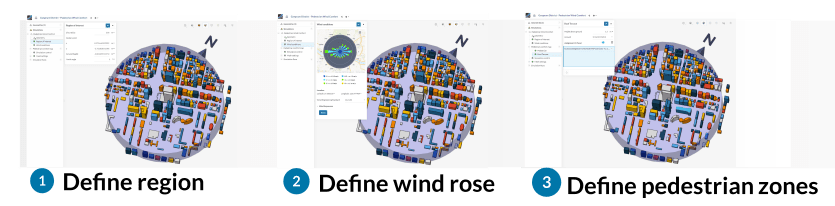
The PWC analysis type is extremely streamlined to allow the user to set up and run a simulation from geometry upload in minutes with 3 simple steps. The setup is automated using best practices and validation exercises to ensure that fast results are complemented with accuracy. Although this highly automated workflow is in place, much of the parameters can be manually adjusted if required.
The underlying technology used to solve the fluid flow around the buildings is the Lattice Boltzmann Method (LBM), by Pacefish®\(^1\). There are several key things that make this stand out in comparison to its competition. LBM is able to solve almost regardless of the geometry quality given to it, and therefore, geometry preparation and cleaning are almost removed provided some guidelines are followed. In some real cases, this has reduced weeks of CAD preparation work to a matter of hours.
LBM method also uses a different technology to solve on. Where the standard OpenFOAM solvers use CPUs, LBM uses GPUs (Graphics processors) enabling many more parallel processes to occur, and therefore solve times are rarely longer than a few hours for a complex case. This puts the PWC solver in a good place where users can expect an entire turnaround in a day once they are familiar with the processes. This solver uses the k-omega SST DDES turbulence model.
Our PWC analysis type takes all the standard geometry formats that we advertise in the geometry upload section of the documentation. Typically, however, geometry comes from one of the common tools used by architect firms and wind engineers, which are mainly Revit and Rhino (others exist and if they can export STL then they are also fine). Therefore the main format types relevant here are Rhino (.3dm) and STL (.stl).
More details regarding geometry requirements and how to prepare the CAD for best results with Pedestrian Wind Comfort can be found here.
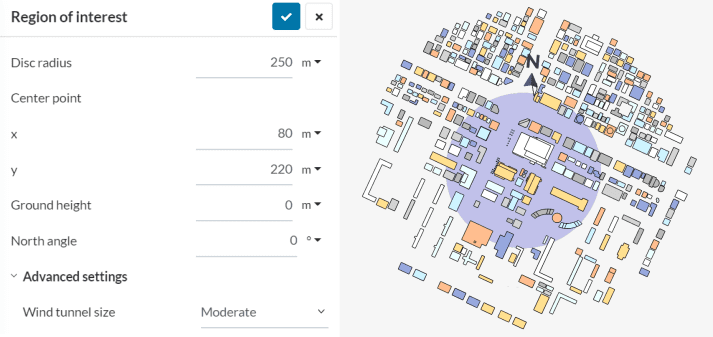
The Region of interest is a very important stage of simulation setup. The core functionality of the region of interest is to define the area around the main building/area on which the pedestrian comfort should be evaluated. Additionally, it is used as a reference to automatically size and orient the virtual wind tunnel.
The settings panel has the following parameters:
More details on how to correctly define the region of interest parameters can be found here.
Under Wind conditions not only the local wind statistics for the target area are defined, but also the wind engineering standard, according to which the analysis will be run and the results will be evaluated.
Currently, four different Wind Engineering Standards are available on SimScale – Eurocode EN 1991-1-4, the standard in Europe including the UK; AS/NZS 1170.2, the standard in Australia and New Zealand; NEN8100, the standard for the Netherlands and most recently also the London City Wind Microclimate Guidelines, which were specifically designed for the City of London region.
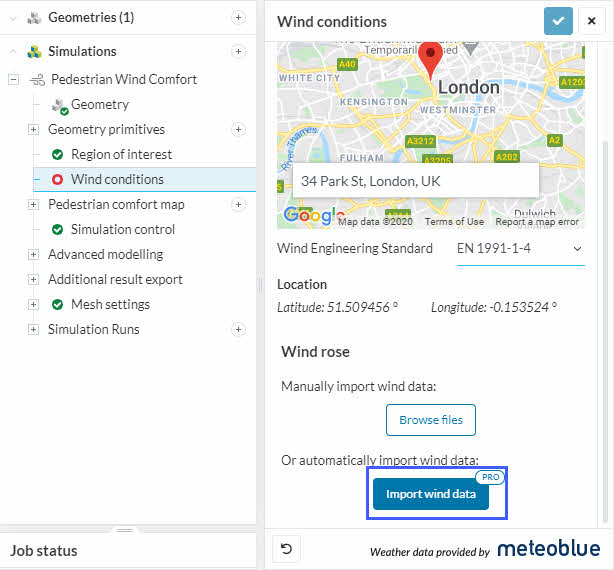
More details about the correct setup of the wind conditions can be found here.
Wind comfort study should be assessed at the mean pedestrian level since the comfort level is correlated to pedestrian-level winds. Height above ground input should be defined by taking pedestrian height into account. A ground reference can be set as an absolute reference height or as a relative reference height.
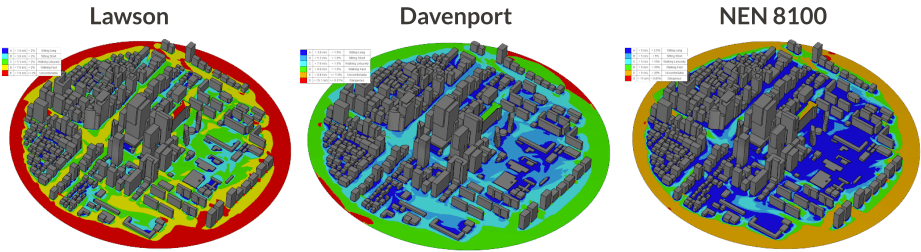
The reference height used will be the height at which the comfort criteria will calculated. Currently, SimScale has implemented a number of comfort criteria, for example: Lawson criterion, Davenport criterion, NEN8100 Comfort criterion and others.
More details regarding the setup of the pedestrian height can be found here.
Simulation control contains all the necessary parameters to control the run-time of the simulation. The maximum run time and the number of fluid passes is defined in this part.
The maximum runtime defines the maximum runtime for the simulation in physical time and the number of fluid passes defines how long a transient simulation runs (counted in seconds).
More details on how to define the runtime and the number of fluid passes can be found here.
Additional physical parameters can be defined in advanced modelling. The additional parameters which can be defined are Surface roughness and Porous objects.
If the effect of friction on the flow wants to be observed then it is necessary to define the surface roughness. The value defined for the surface roughness is the equivalent sand-grain roughness and can be set manually by the user.
Porous media is used to model permeable obstructions such as trees, hedges, windscreens, and other wind mitigation measures. When air flows through a porous body, a pressure gradient along the direction of the flow is generated. Using porous media simplification reduces CAD and mesh complexity, and saves computational time and expenses.
More details on defining surface roughness and porous media can be found here.
Under Additional result export, a user may define additional results such as:
Custom comfort and safety criteria can be defined using CSV files. More details can be found below:
The settings for transient output and statistical averaging are the same for PWC and Incompressible LBM analysis types and thus can be found detailed here.
Attention!
The default results that are written down with every PWC analysis include the last 20% of the calculation per direction, both average and transient, but only on the Pedestrian level:
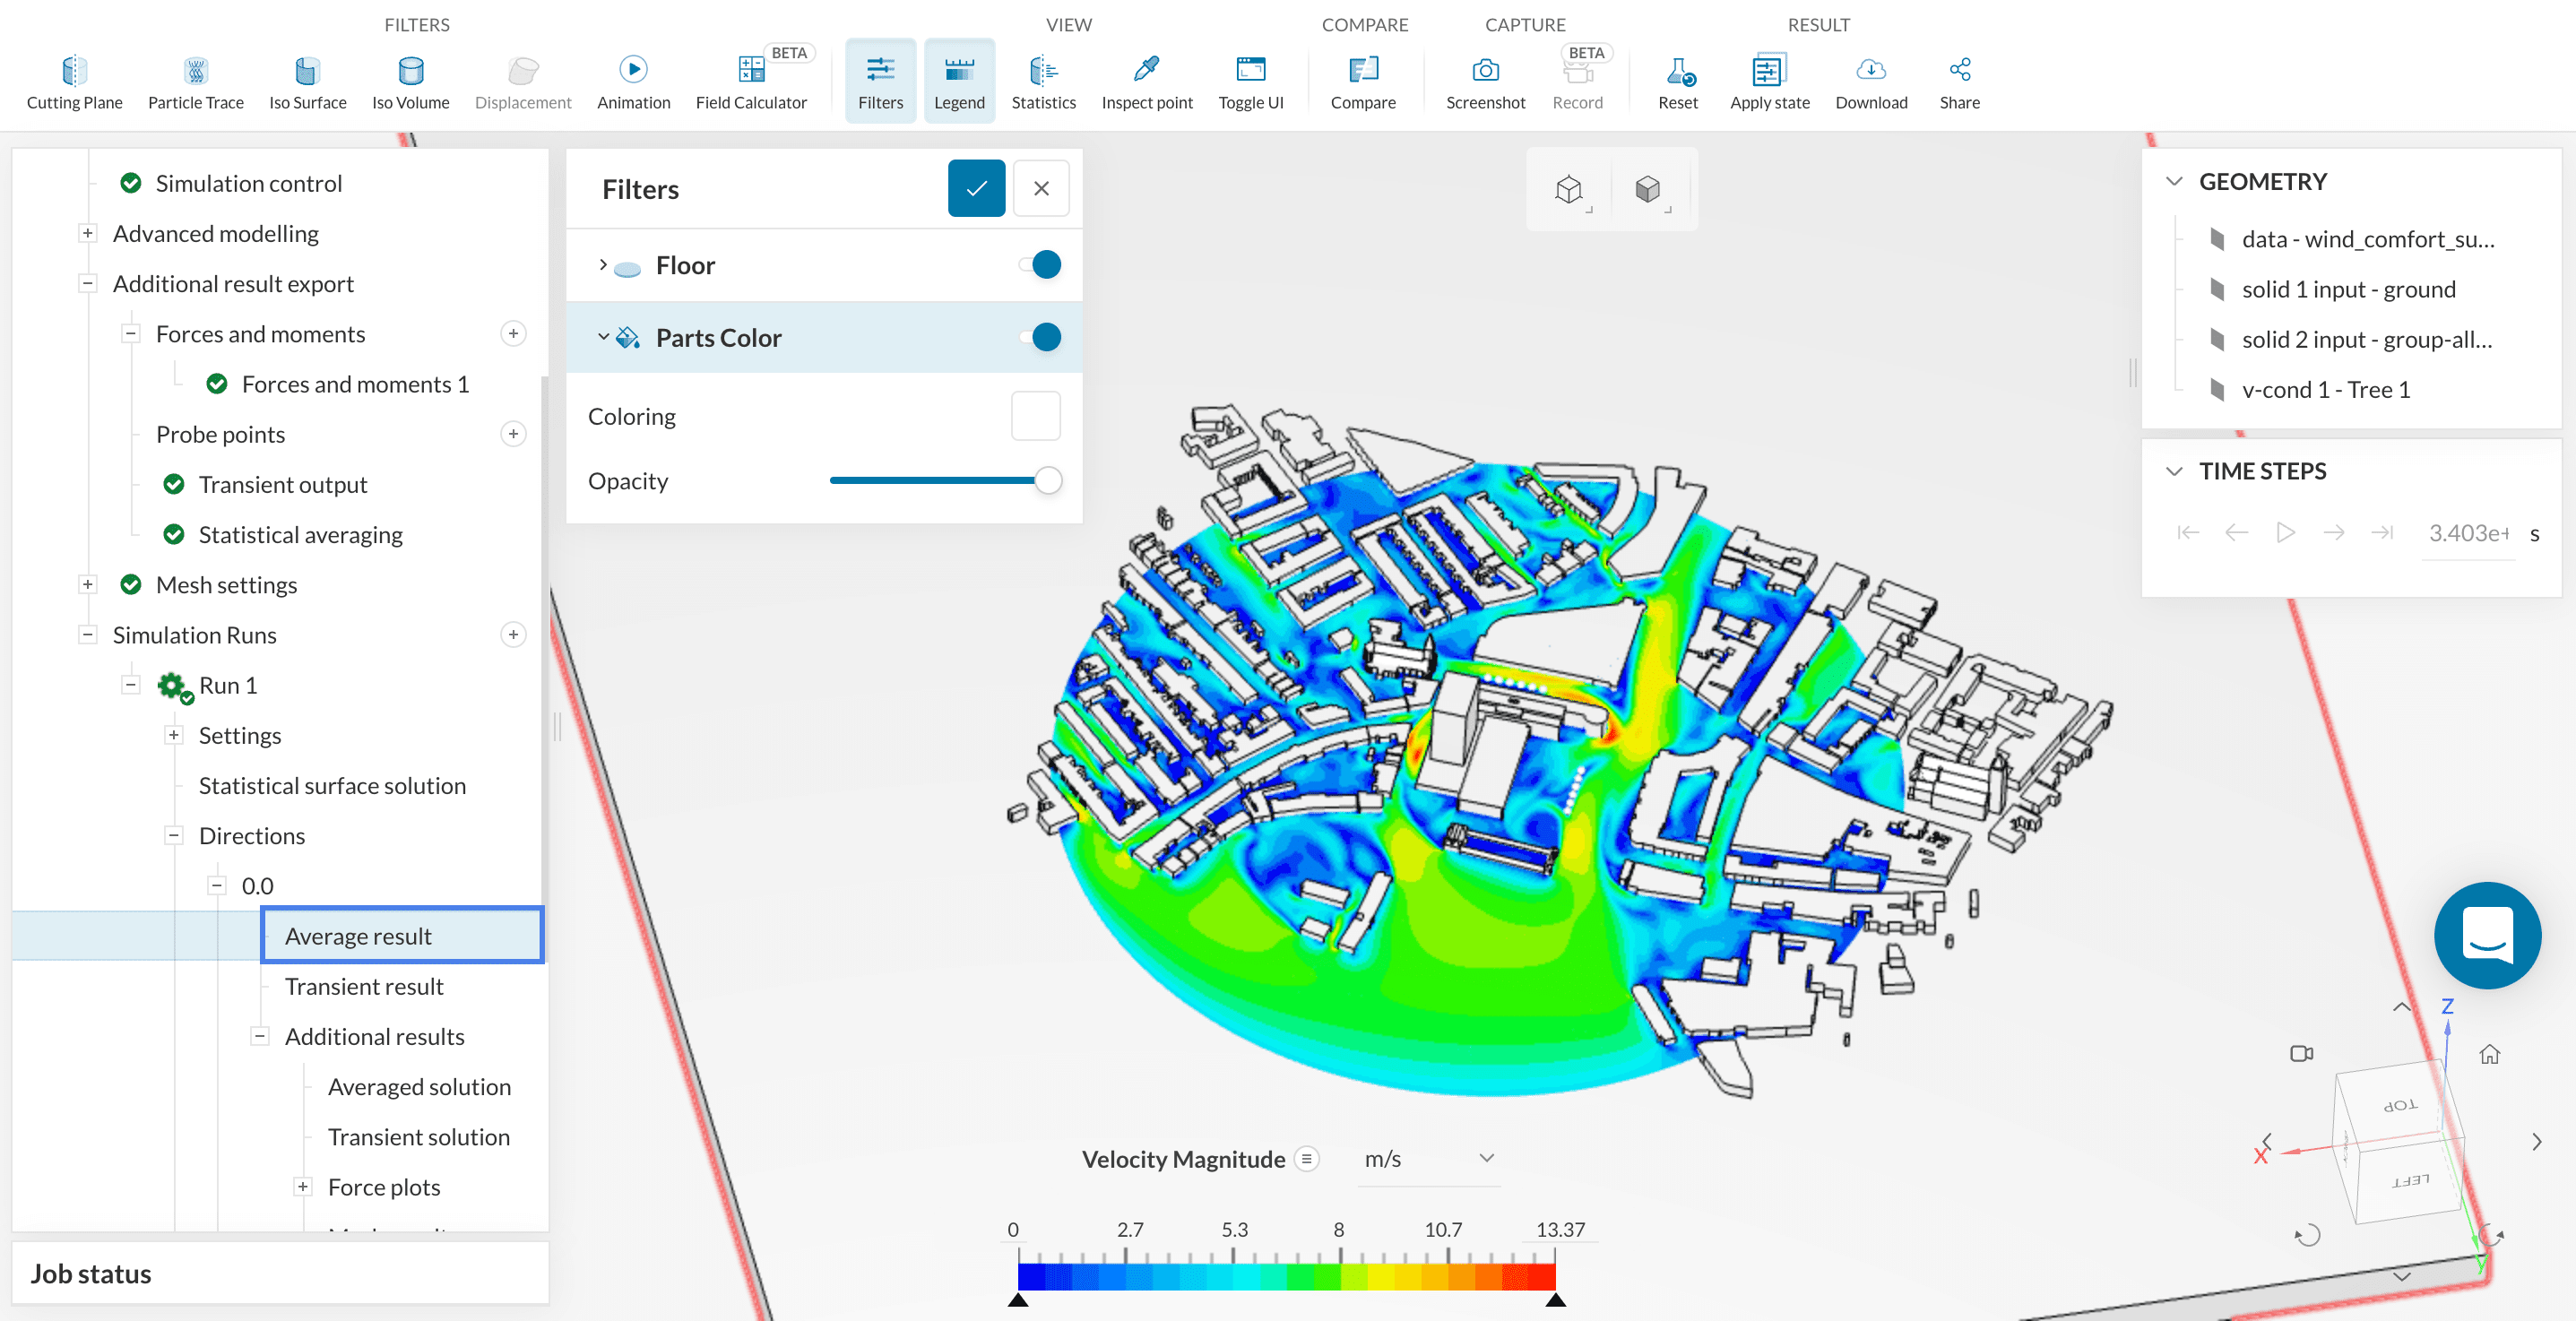
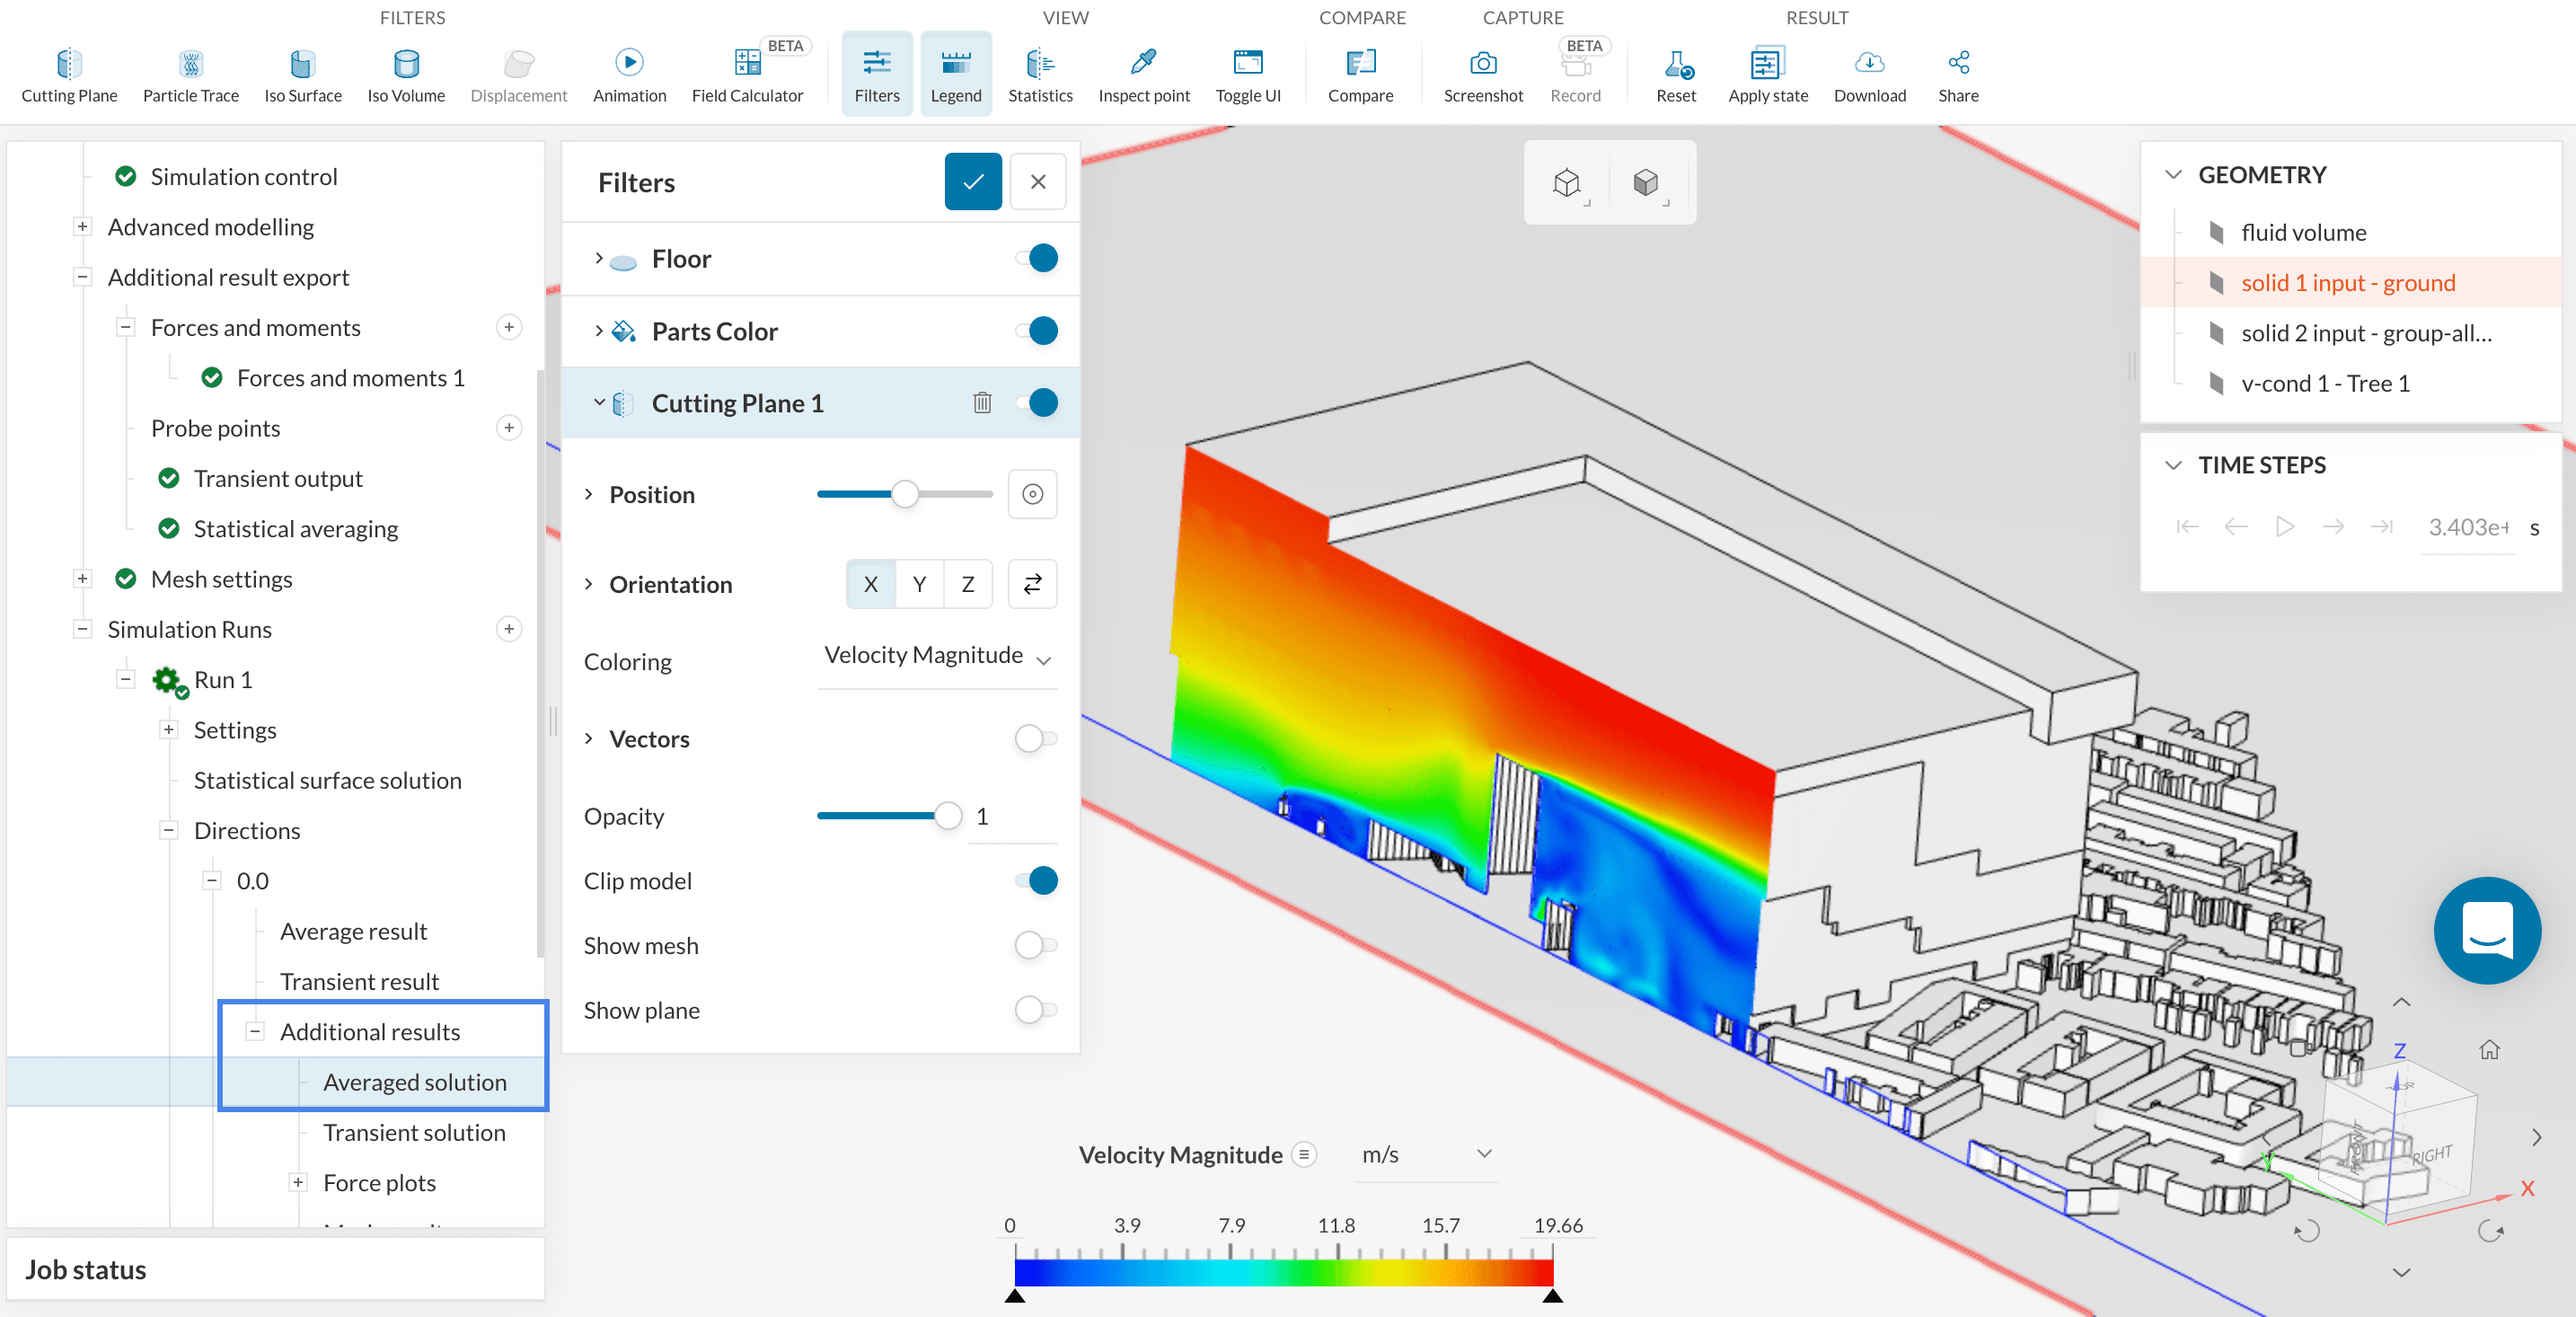
As seen on Figure 6, the default results do not include 3D data, only the solution on the ground. When 3D results are required, the Additional Results sets can be used:
The mesh generated for a pedestrian wind comfort simulation is based on the lattice Boltzmann method. Here a Cartesian background mesh is generated, that is composed of cube elements that are not necessarily aligned with the geometry of the buildings or the terrain.
The necessary fineness of the mesh can be defined in the global mesh settings and refinements can be added to the mesh in the refinements settings.
More details regarding the setup of the mesh can be found here.
Additionally, the mesh and geometry guidelines for the City of London are described here.
When all of the settings and physical conditions are applied, a simulation run can begin. The solver runs a simulation in each direction in parallel and will be compiled into the statistical results based on the comfort criteria once it is finished.
More details regarding how to start a run and the information of the run can be seen here.
Residuals and Convergence
You won’t see the residuals or convergence plots in a PWC or an Incompressible LBM analysis, because these are explicit solvers.
Once all individual wind directions have been computed and also the statistical analysis on the wind comfort had been carried out, the simulation run changes to ‘Finished‘ state, and the user is informed via email that the results of the run are now ready for visualization.
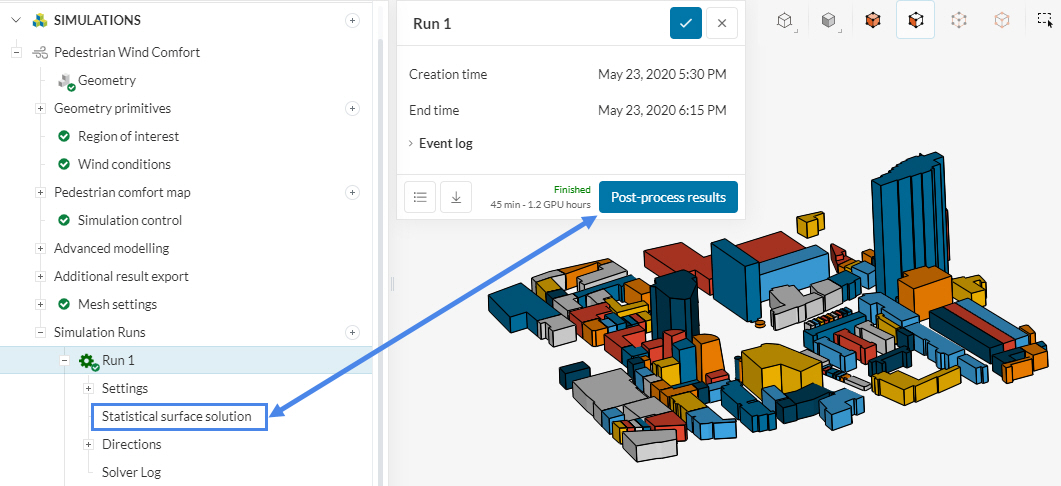
Clicking either the ‘Post-process results‘ button, or the highlighted item ‘Statistical surface solution‘ will open the comfort analysis results in the online post-processor.
Note
Results for individual wind direction along with aditional results exported will be stored under Directions below Statistical surface solution.
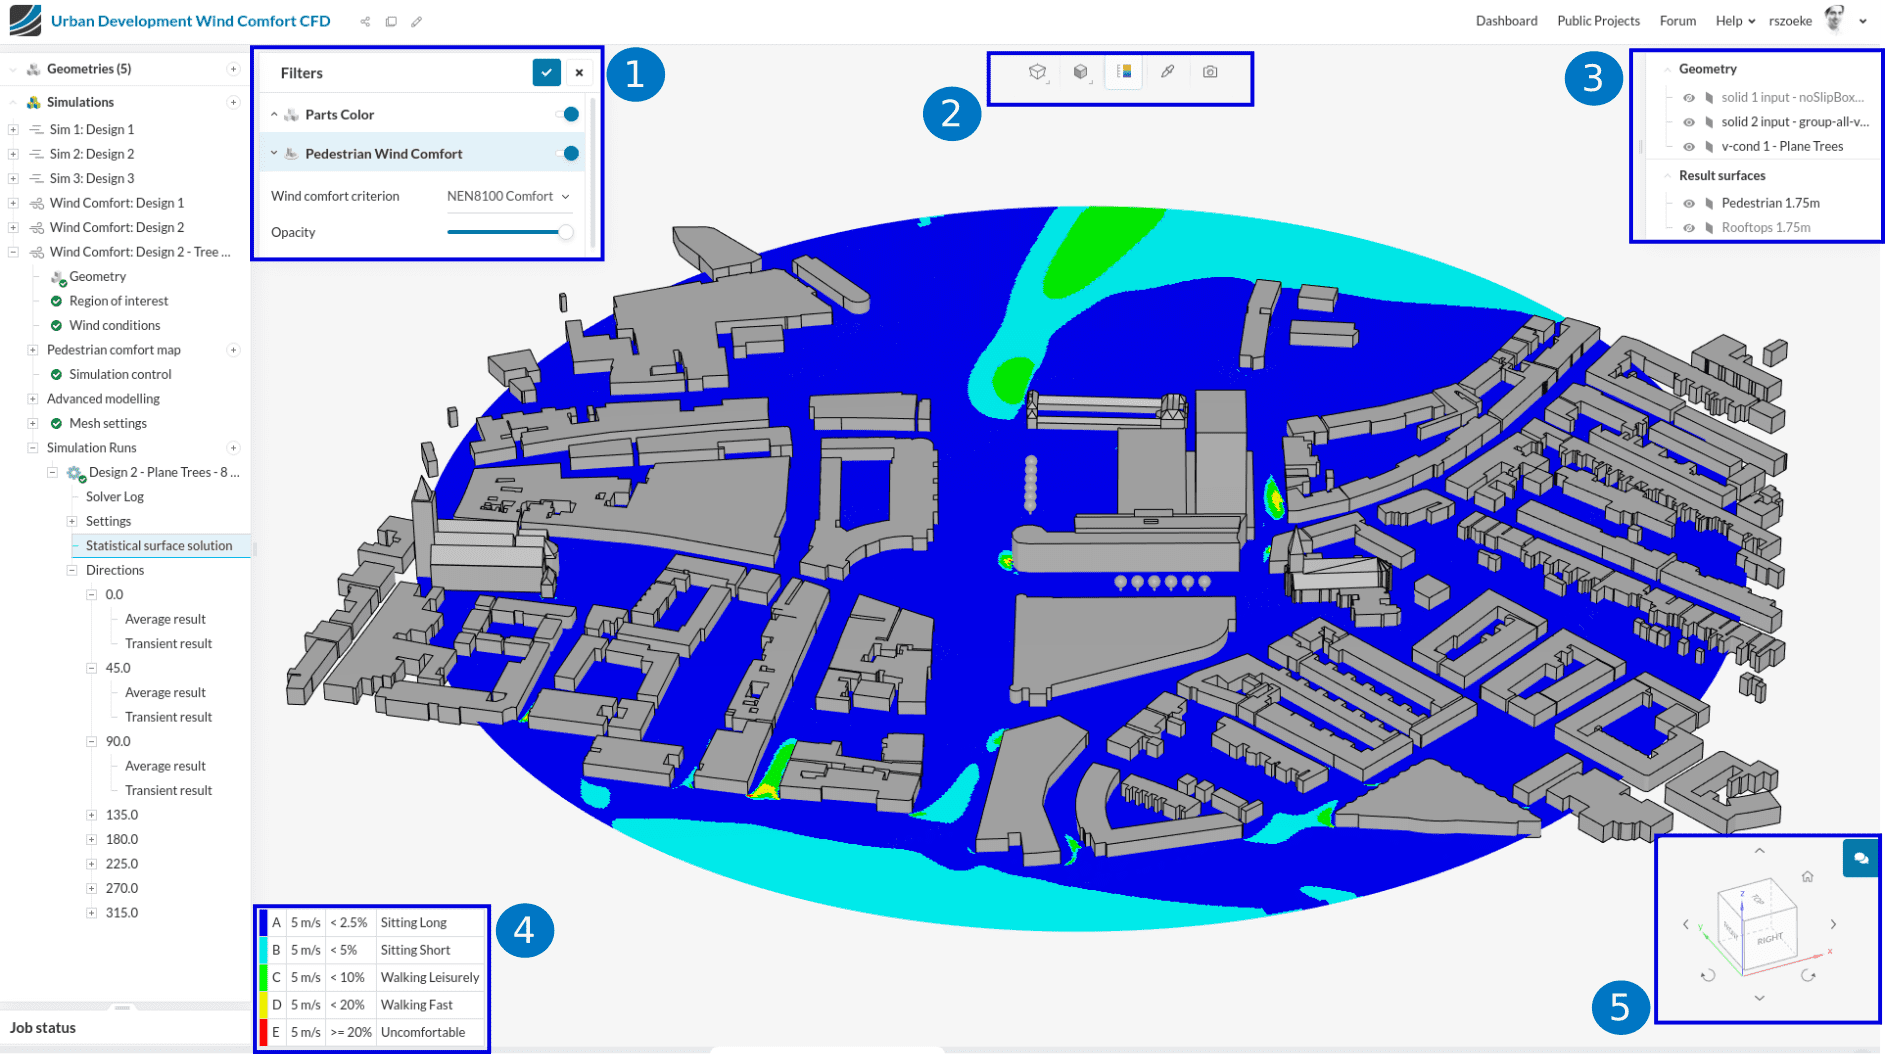
Above highlighted are the 5 main comfort analysis interaction items for the post-processor:
References
Last updated: June 20th, 2023
We appreciate and value your feedback.
What's Next
Geometry for Pedestrian Wind Comfortpart of: Pedestrian Wind Comfort Analysis
Sign up for SimScale
and start simulating now