Wind Conditions in PWC
Wind conditions are important when setting up a Pedestrian Wind Comfort simulation. Their definition controls the boundary conditions that describe the wind flow characteristics. In this part of the simulation setup, there are two factors; the wind conditions themselves including speed direction and frequency, and the wind exposures. These will be described in detail in the following documentation.
Defining the Wind Conditions
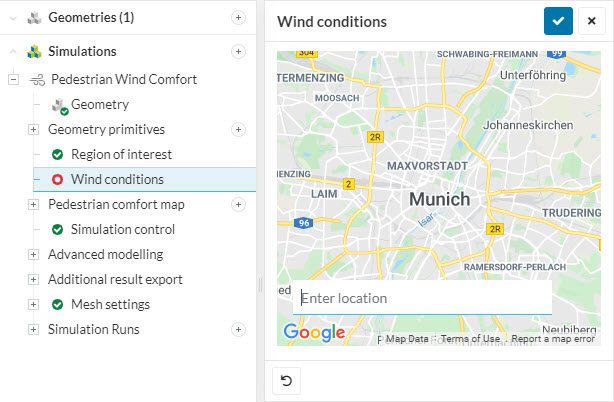
Wind conditions can be defined in two ways, either by uploading data in the form of a .stat file (common for downloading wind data from external sources) or by automatically accessing it based on the location from our connected database with Meteoblue. Under either of these methods, the first step is to type in a location. The more accurate this is, the more precise the weather data can be provided if importing from Meteoblue (London versus 34 Park St, London SE1 XXX for example).
Once the location has been defined, the user will be given a drop-down to specify a Wind Engineering Standard, where the choices are:
- EN 1991-1-4: the standard in Europe including the UK
- AS/NZS 1170.2: the standard in Australia and New Zealand
- NEN 8100: the standard in The Netherlands but also used in some Scandinavian countries as they do not have their own
- AIJ (2004): the standard in Japan
- London Microclimate: a standard that was specifically designed for the City of London region.
For both the EN 1991-1-4 and AS/NZS 1170.2 standards, the user can upload a *.stat file or select data from the available meteoblue database.
Note
For the NEN 8100 standard, the user has to manually upload data in text format (*.text, *.txt) straight from the government provided NPR 6097:2006 program, while for the London City Wind Microclimate Guidelines no data upload is needed as the standard already includes the wind data to be used.
Important
When using the EN 1991-1-4 or AS/NZS 1170.2 standard a maximum of 36 wind directions can be manually uploaded, whereas for NEN 8100 that limit is 12. When importing data from meteoblue, this limit is reduced to 16. For London Microclimate, a maximum of 36 wind directions can be confirmed.
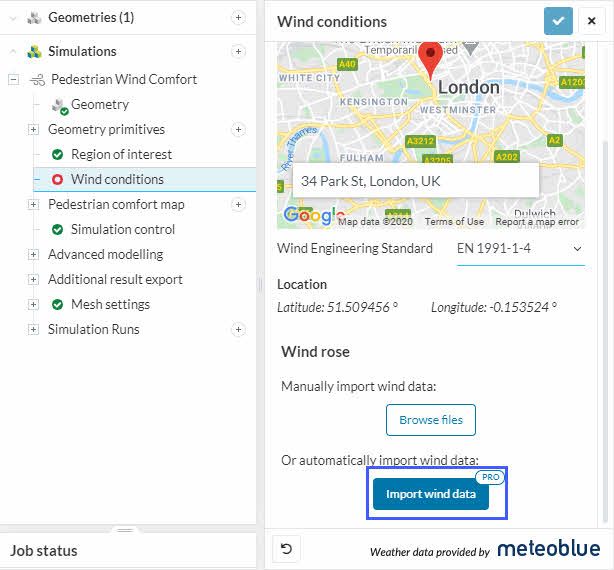
For uploading the file with the wind data, one simply needs to follow the upload file prompt and select the file on their local hard drive to be uploaded and used. A detailed guide here. For using the connected data, select Import wind data (as highlighted below), and the wind conditions will be automatically loaded.
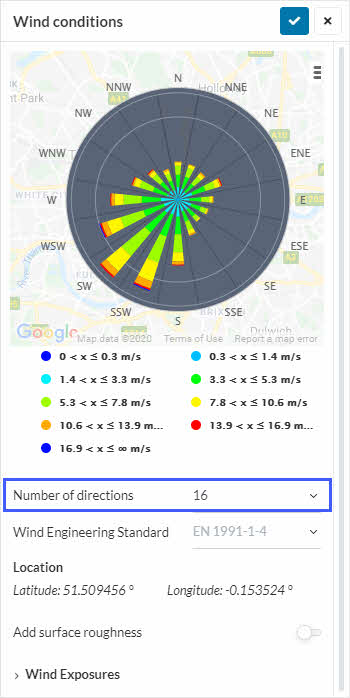
Once the data has been imported, SimScale can reduce the number of wind directions to a specified lower number (minimum 1 direction). This is important because more wind directions defined imply more simulation resources used, which will drive up costs when unnecessary. For example, some basic analysis in an early architecture design might need only 2 or 4 directions, but submitting evidence for city planning to the Council might require 16 or 36 directions. The smallest analysis will be 1 direction aligned to the north.
Surface Roughness
Surface roughness can also be applied outside the region of interest by toggling-on the Add surface roughness option. Additionally, you can also add surface roughness to specific faces and volumes under the Advanced modelling node in the pwc simulation tree. Read more on that here.
Surface roughness can have a significant impact on wind comfort results. Please follow this knowledge base article for more information:
Wind Exposures
Wind exposures essentially control how the wind speeds vary due to the presence of specific terrain characteristics. Different terrains cause different velocity gradient vertical to the ground commonly referred to as the atmospheric boundary layer (ABL) which can be a topic on its own, but for PWC analysis, its definition is as simple as defining the exposure category that corresponds to the surroundings outside of the simulation extent. This might be, for example, Urban area in all directions if simulating a region within The City of London, or Coastal area for some directions and Urban area or Suburban area for the remaining when simulating a coastal city like Miami, Florida.
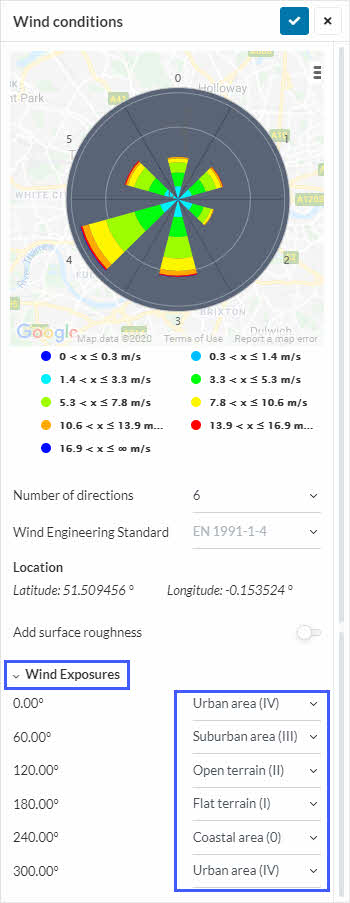
SimScale gives you the control of exposure for every direction.
Exposures can be defined in the Wind conditions space in a drop down box as depicted below:
Wind Exposure Categories- Eurocode En 1991-1-4
- To understand how different terrain types are classified into wind exposure categories here is an example for the Eurocode En 1991-1-4. There are 5 terrain or wind categories in Eurocode En 1991-1-4\(^2\) (page 92)
- Coastal area (Category 0)
- Flat terrain (Category 1)
- Open terrain (Category 2)
- Suburban area (Category 3)
- Urban area (Category 4)
| Terrain Type | Wind Exposure Category | Schematic |
| Coastal area | Category 0 | 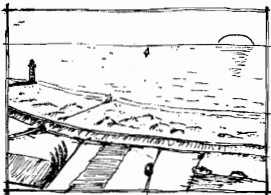 |
| Flat terrain | Category 1 | 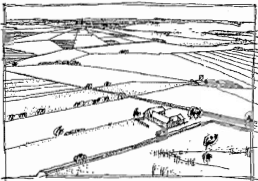 |
| Open terrain | Category 2 | 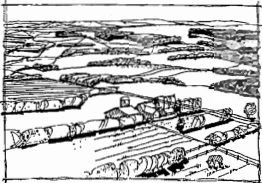 |
| Suburban area | Category 3 | 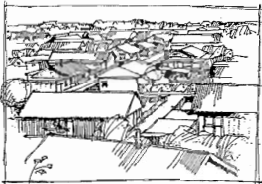 |
| Urban area | Category 4 | 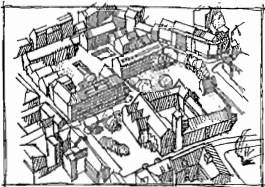 |
To understand how important exposure setting is, we can have a look at the following plot showing ABLs for different exposure categories using the EN 1991-1-4 standard.
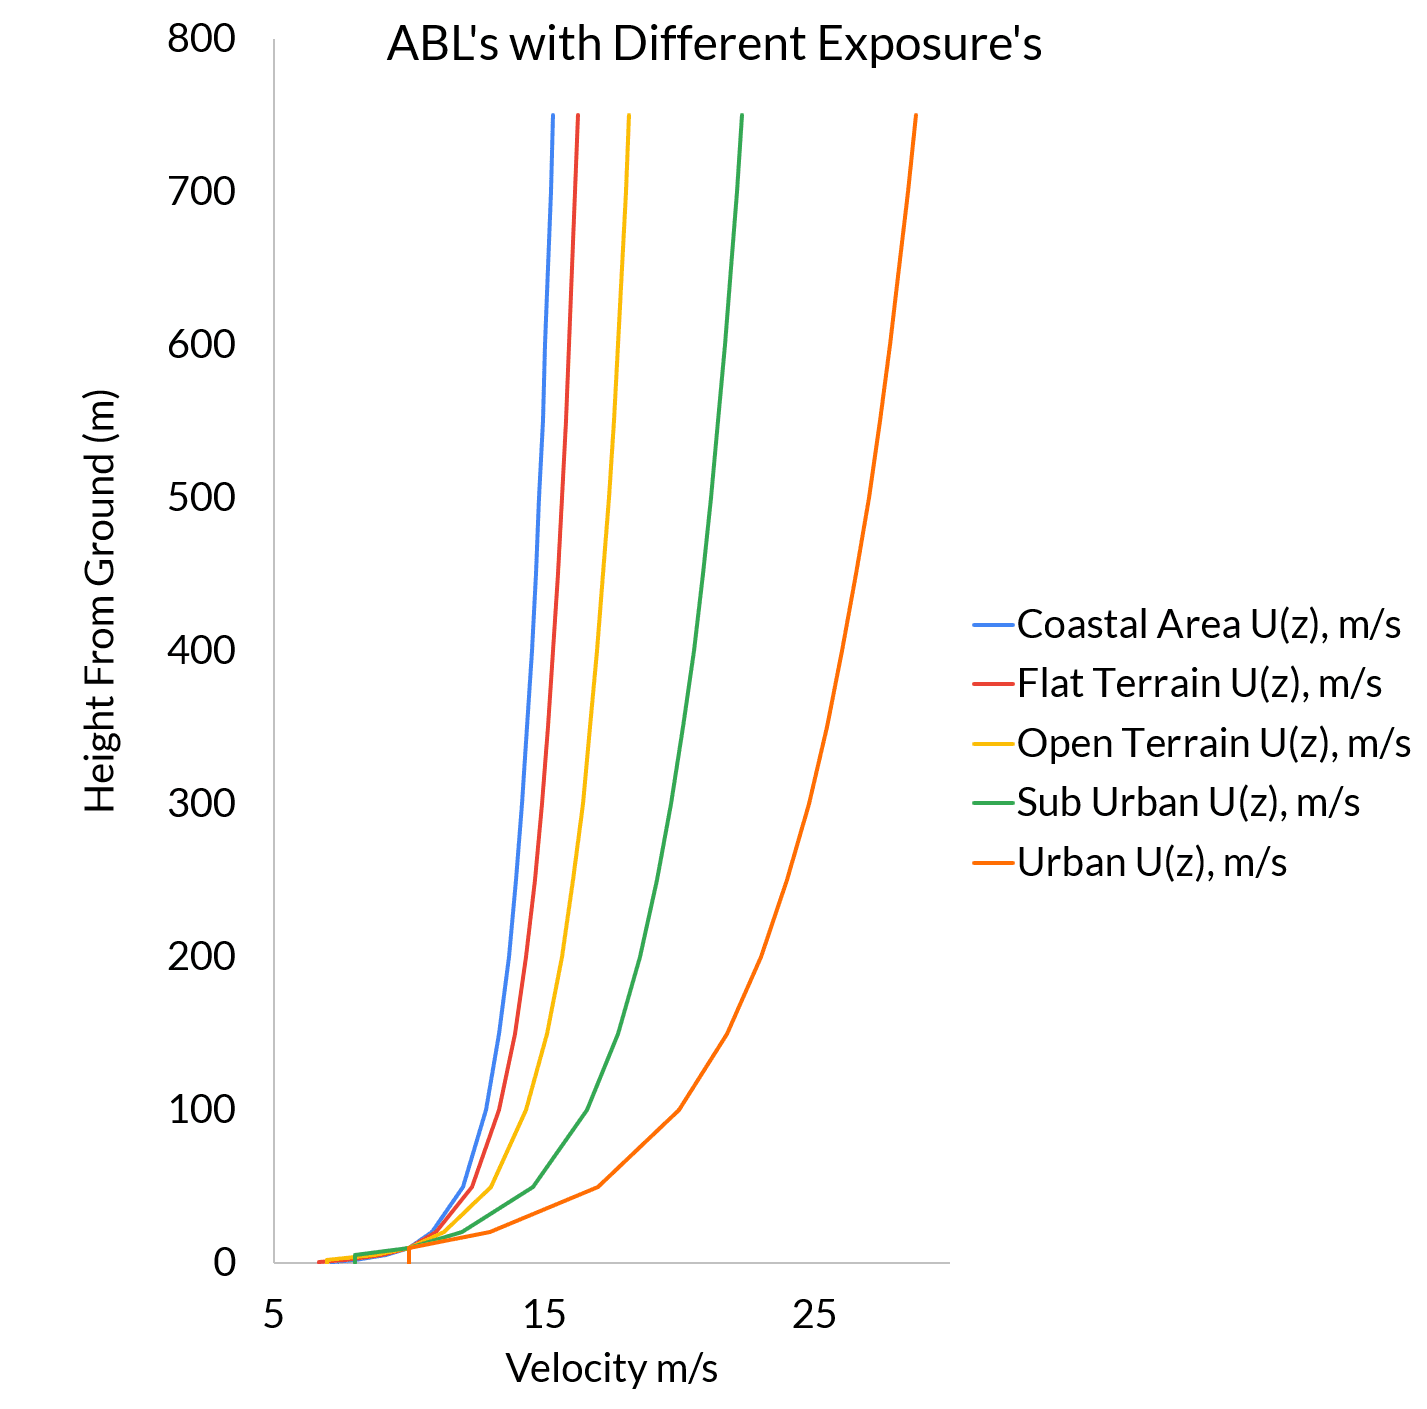
The figure above shows the ABL profile that needs to be applied during the CFD/wind comfort analysis. As the coastal wind has a lower roughness, the profile is steeper and thus at 10 meters height is already much closer to its maximum speed.
For the wind comfort calculation, we actually take into account that the wind would slow down when it comes from the coastal area and reaches urban levels, for example. This is called the “exposure correction factor”. This factor scales down the velocity profile.
The exposure correction factor for the coastal wind is 1.1432 and for the urban wind is 0.6803, so if we go from coastal to urban the speed at 10 meters height would decrease by a factor of 0.6803/1.1432 = 0.595.
Wind exposure for mixed terrain
Whenever unsure of the dominant terrain, select one category lower to include a higher wind speed atmospheric boundary layer profile. This means a conservative approach is being recommended for mapping the wind comfort criteria.
Atmospheric Boundary Layer
In the context of CFD modeling, an Atmospheric Boundary Layer (ABL) is an important aspect for modeling the flow around buildings, or for near-field dispersion problems. This can be relevant for applications such as in Architecture, PWC, and Urban Planning. The following document explains how the ABL profile is generated with respect to the Wind Engineering Standards supported in the Pedestrian Wind Comfort simulation type in SimScale.
References
Last updated: January 3rd, 2025
Did this article solve your issue?
How can we do better?
We appreciate and value your feedback.
What's Next
Pedestrian Comfort Mappart of: Pedestrian Wind Comfort Analysis


