Advanced Tutorial: Pedestrian Wind Comfort Simulation
This article will provide you with a step-by-step tutorial on how to create a Pedestrian Wind Comfort (PWC) simulation and post-process the results within SimScale.
Overview:
This tutorial will teach you how to:
- Set up and run a pedestrian wind comfort simulation
- Define trees as porous objects in your model
- Export results
We are following the common workflow in SimScale:
- Prepare the CAD model for the simulation
- Set up the simulation
- Run the simulation and analyze the results
1. CAD Mode and Analysis Selection
You can import the tutorial project into your SimScale Workbench by clicking the button below.
By importing the tutorial project, the Workbench will open with the prepared tutorial geometry already loaded into the viewer. The Pedestrian Wind Comfort simulation is already created.
Community vs Professional license
This tutorial uses the Lattice Boltzmann method (LBM) by Pacefish®\(^1\) to solve the simulation, which is only accessible through professional licenses. Therefore, users with community license can only follow the steps in this tutorial but cannot run any PWC simulation. Learn more.
If you want to perform external aerodynamics with a community license, please check out the fluid dynamics section of the
main tutorial page.
This CAD model follows good practices for PWC simulations: to make the simulation setup simpler, we recommend always importing the CAD models for PWC simulations following the guidelines below:
- The sky should be in the positive z-direction
- The geographic North should be in the positive y-direction
Helpful Tips on Importing Your Model
Creating a new simulation
Creating a new simulation is simple – please select the geometry and click on ‘Create Simulation’:
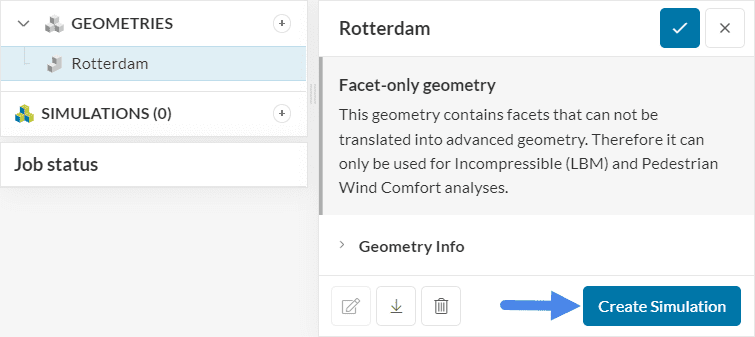
- To create a new simulation, click on the ‘Create Simulation’ button on the geometry panel.
- Now, the SimScale analysis type widget will pop up:
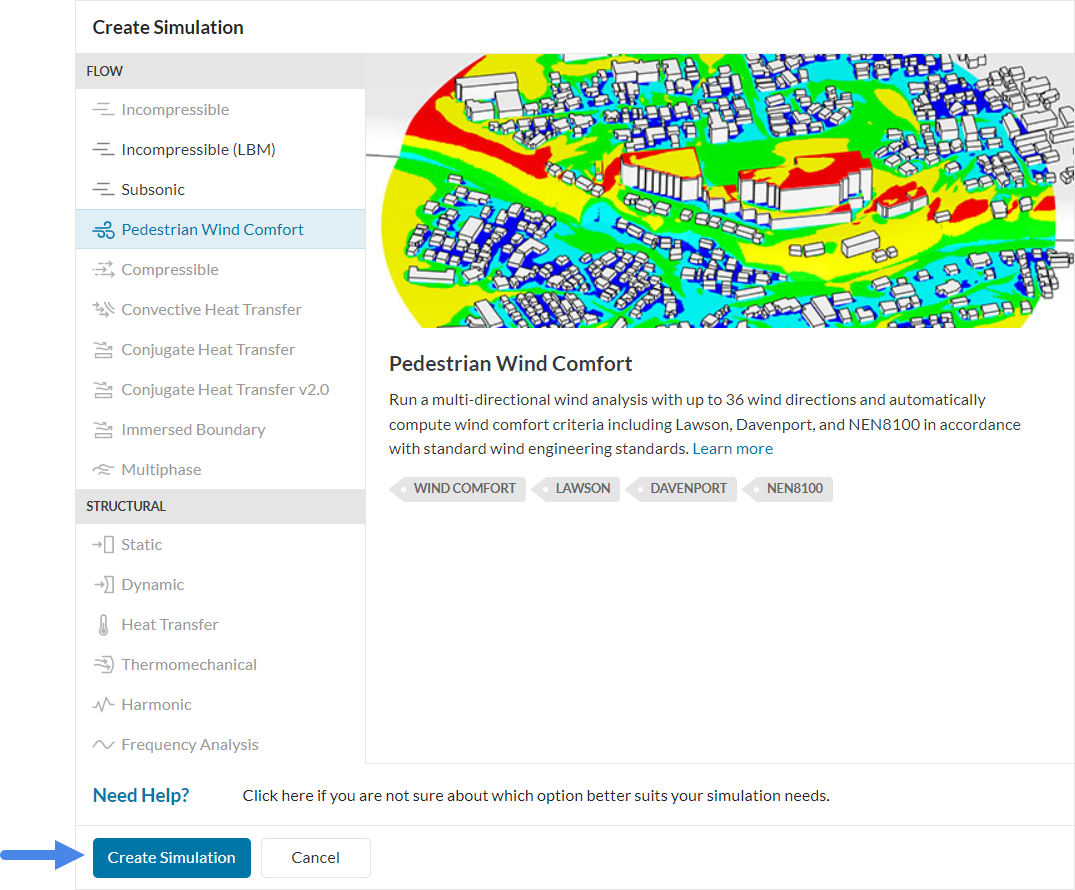
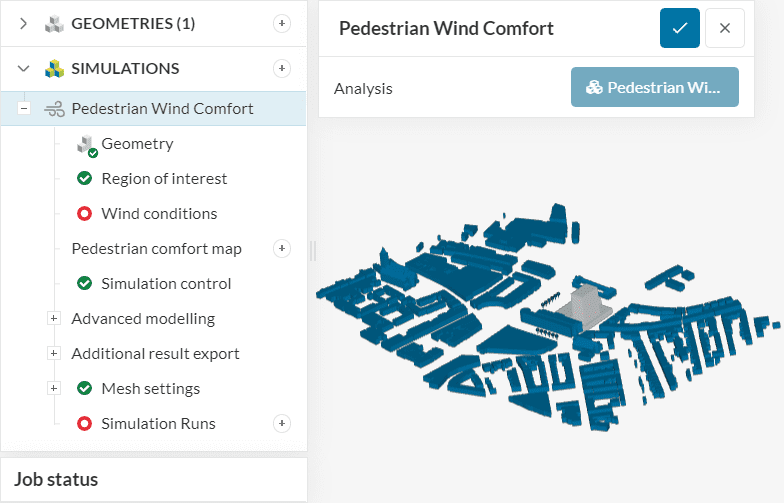
From the list, select ‘Pedestrian Wind Comfort’ and proceed by clicking on ‘Create Simulation’. Now a new simulation tree appears on the left-hand side panel containing the configuration options.
2. Set up the Simulation
2.1 Geometry
The geometry is automatically assigned to this simulation, so no changes are required here.
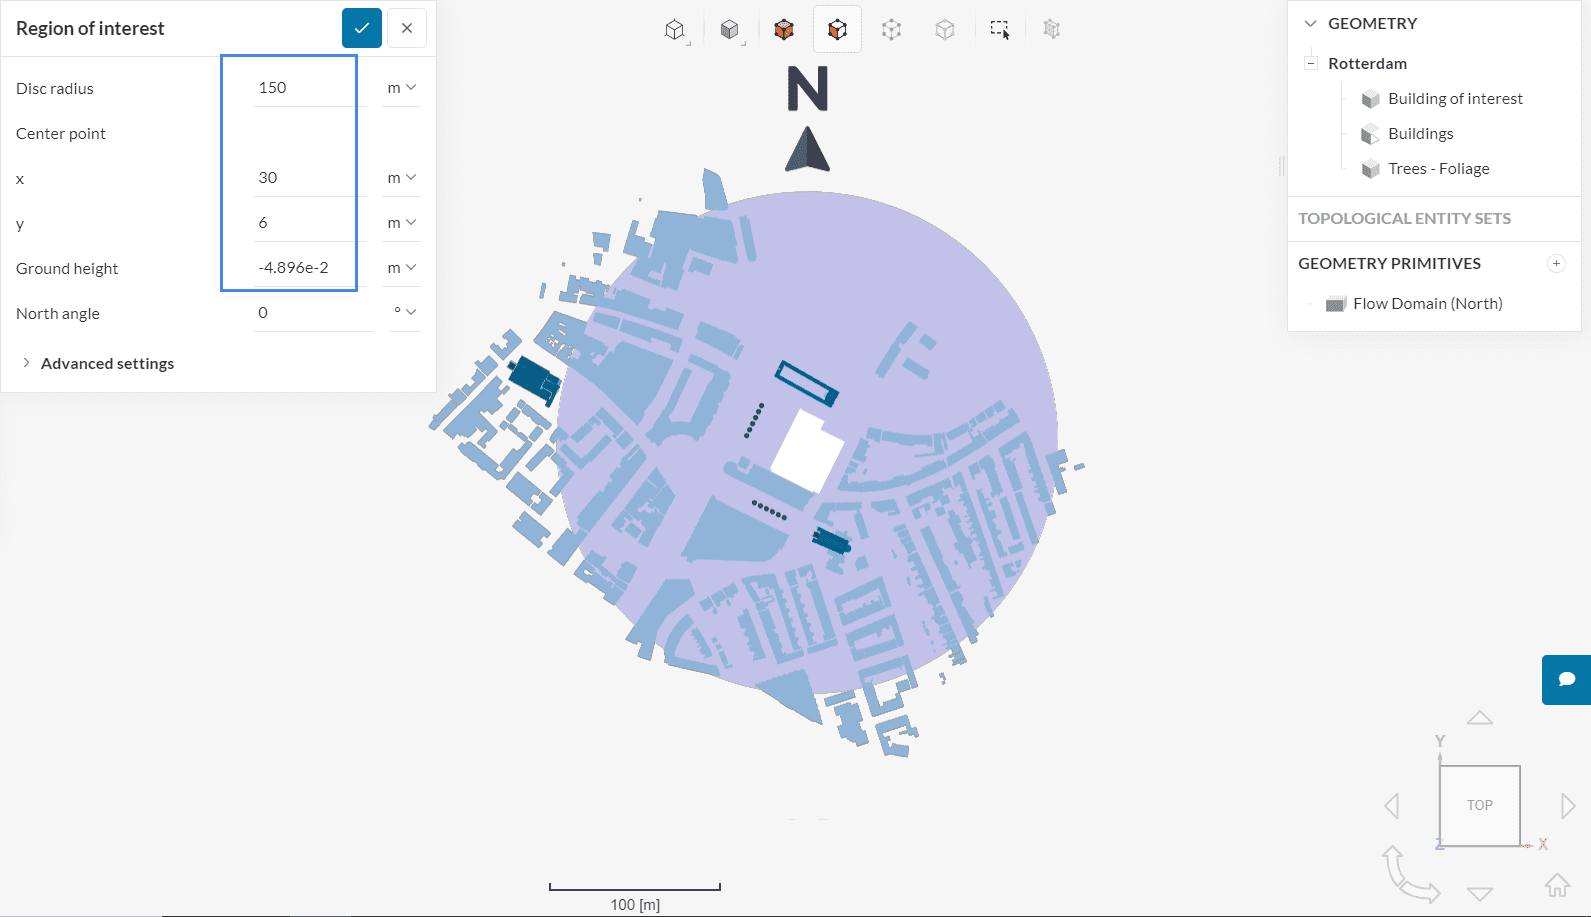
2.2 Region of Interest
Firstly, you will need to define the region of interest for the simulation results, which can be done by clicking the ‘Region of Interest’ menu in the simulation tree. It is worth noting that the pedestrian comfort results are only shown within the region of interest, so you need to be careful with its placement.
Here is a brief explanation of the available settings:
- Disc Radius: The radius of the disc that represents the region of interest
- Center point: The center point of the region of interest
- Ground height: The ground height for the wind tunnel for the simulation. The ground height automatically receives the minimum z-coordinate of the CAD model
- North angle: The north angle that will be used in the simulation. As previously discussed, the default direction for the north angle is the positive y-direction.
For this simulation, you can follow the parameters defined below.
You can find more information regarding the region of interest in the attached page below:
2.3 Wind Conditions
Under Wind conditions, you can define the wind rose at the location of your site. This process can be automatic, by using the Meteoblue®\(^2\) plugin, or manual (for example, uploading .stat files).
In this tutorial, we will use the automatic approach with the steps below:
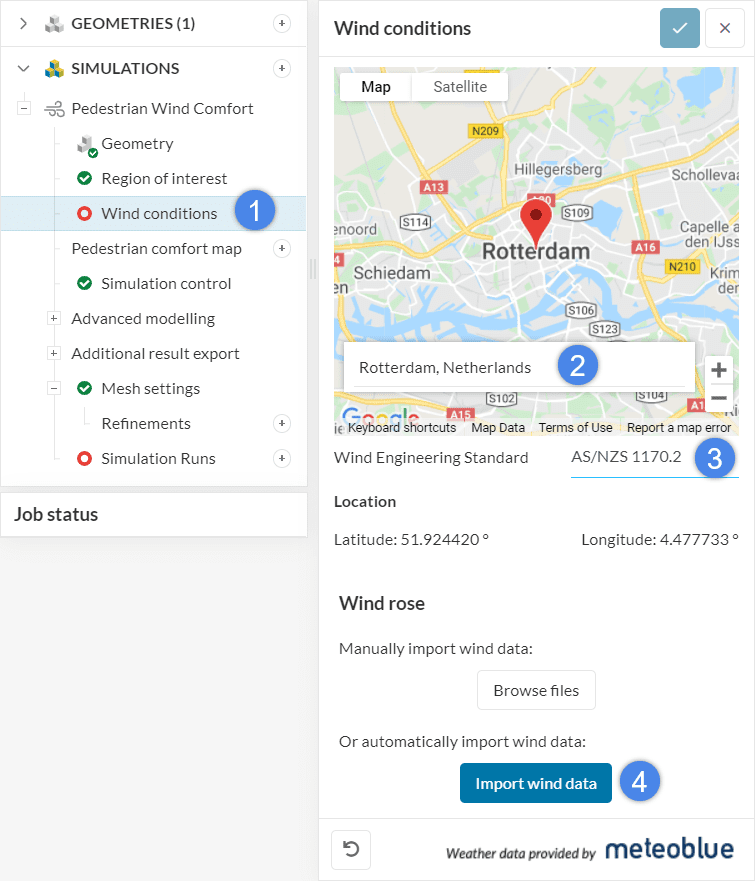
- Select ‘Wind conditions’
- In the location box, type in ‘Rotterdam, Netherlands’ and pick the entry from the list.
- For this tutorial, we are going to use the ‘AS/NZS 1170.2’ Wind Engineering Standard.
- Finally, click on the ‘Import wind data’ button to load the wind rose.
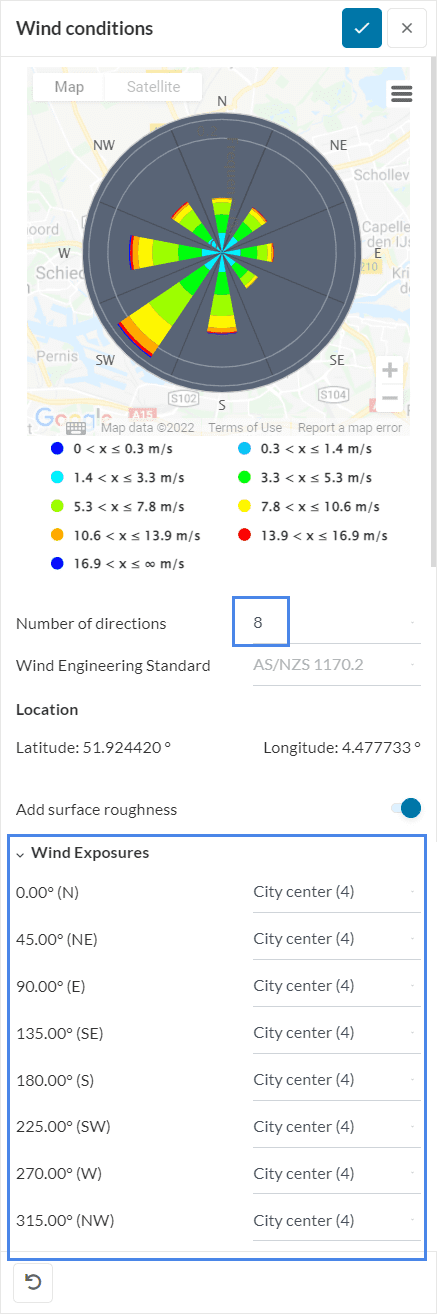
A wind rose with 16 directions will load by default. Please adjust the Number of directions to ‘8’. Furthermore, you can also adjust the Wind Exposures to control the incoming wind profile from each of the directions. Since our CAD model depicts a part of the city of Rotterdam, the wind exposure is ‘City center (4)’ in all directions.
You can find more information regarding wind conditions in the following article:
Number of Wind Directions
If you are not sure about the wind directions required for the analysis, our knowledge base article can answer your question, “How many wind directions should I run for a pedestrian wind comfort analysis?”
2.4 Pedestrian Comfort Map
The next simulation tree entry is the Pedestrian comfort map, where you can define the faces and height of interest for the pedestrian comfort calculation. As a reminder, only the parts inside the region of interest are displayed in the default simulation results.
For this tutorial, click on the ‘+’ button next to Pedestrian comfort map and assign a ‘Ground absolute’ configuration. With this setting, you will receive the pedestrian comfort results 1.5 meters off the bottom face of the wind tunnel, inside the region of interest.
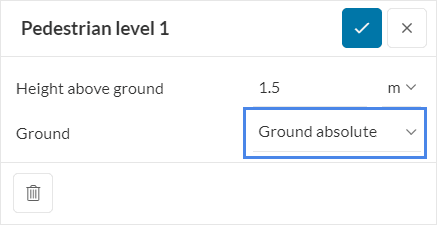
The ground absolute option works well when the CAD model doesn’t contain a face representing the terrain. For a detailed description of all setup options, please check the page below:
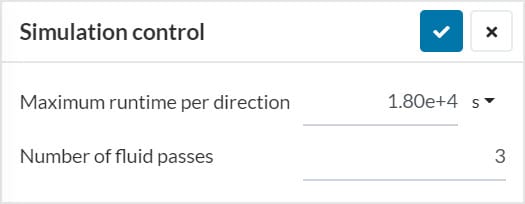
2.5 Simulation Control
In Simulation control, the default values will be enough for the simulation. The default setting ensures that particles travel three times from the inlet to the outlet during the simulation, which is the minimum recommended amount.
2.6 Advanced Modelling – Trees
We can define porous objects and surface roughness of selected volumes in the domain under advanced concepts. We will specifically discuss how to set up trees for this simulation.
A common use of modeling porous objects in a pedestrian wind comfort simulation is when trees are acting as a natural barrier against the wind. SimScale has built a feature to model trees with the following steps:
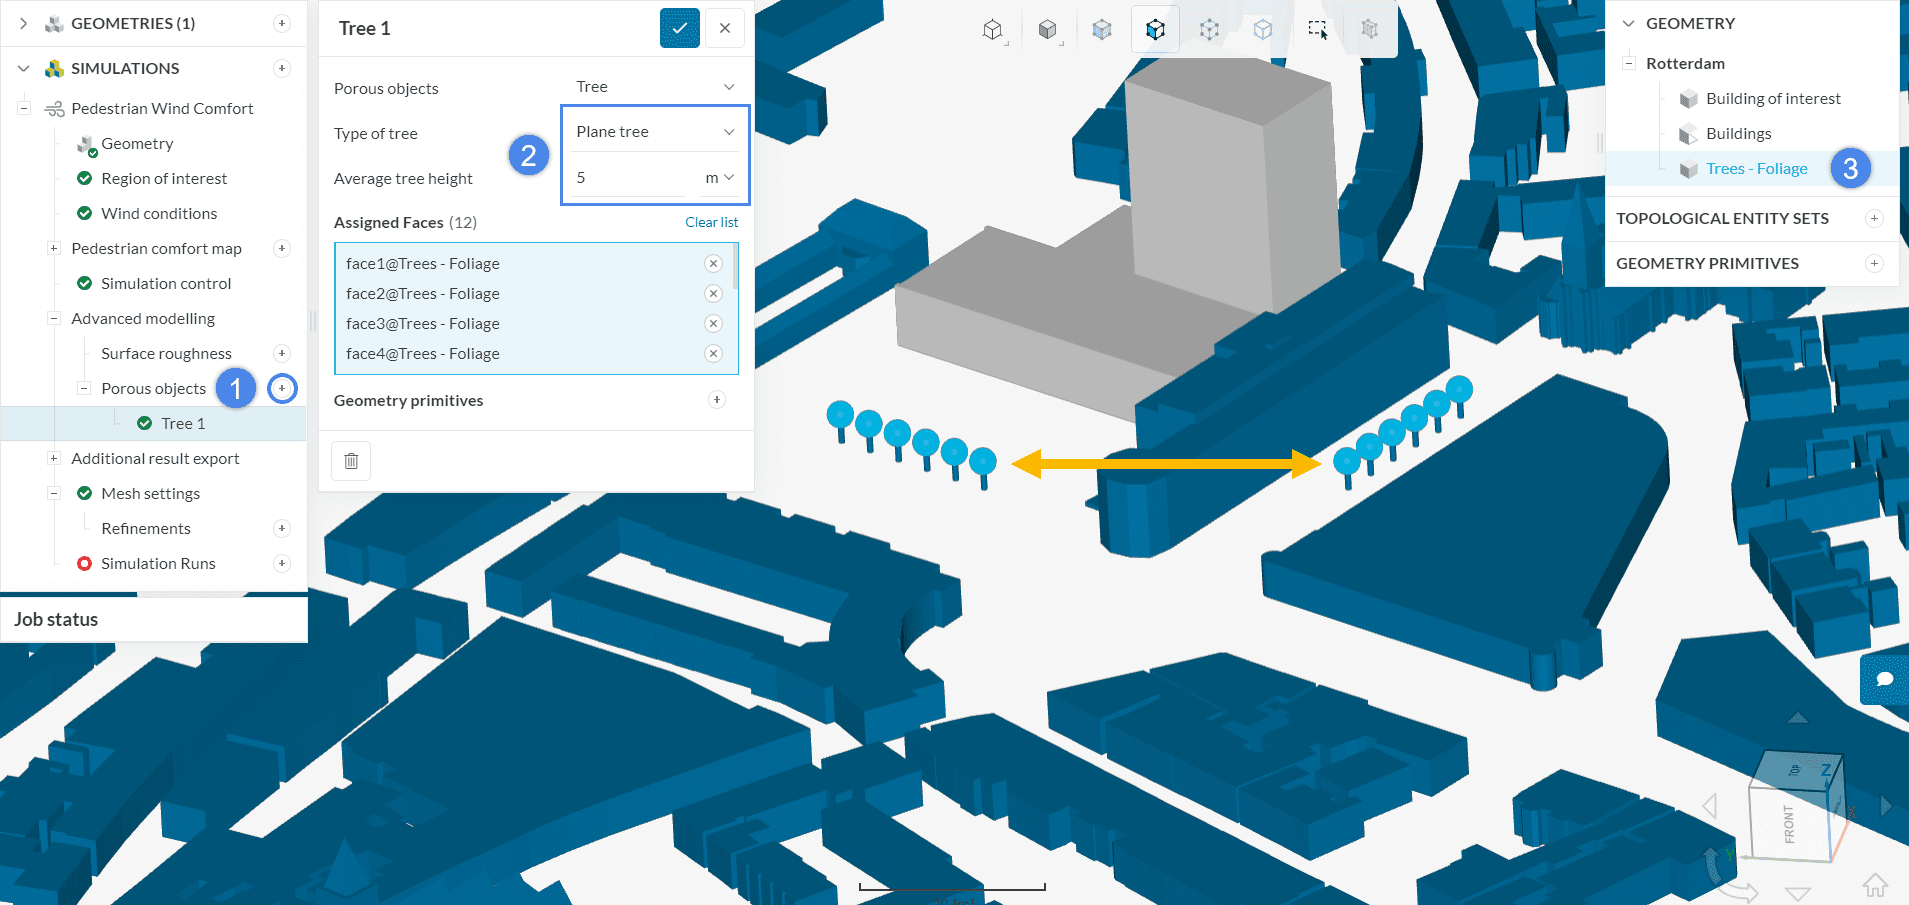
- Firstly, click the ‘+’ button beside Porous objects and select ‘Tree’ as the Porous object type
- In the Type of tree window, select ‘Plane tree’ with ‘5’ meters of Average tree height. SimScale has built a list of general existing trees and the physical characteristics will change accordingly. It is also possible to define a custom tree if required
- Lastly, assign the ‘Tree – Foliage’ volume to the porous object
Note that this .stl CAD model conveniently contains one layer for the trees. Adding layers for certain parts of interest allows you to speed up the setup process. For interested readers, this article contains workflows to import .stl files to SimScale with layers.
Furthermore, you can find more information regarding advanced modelling and porous objects for a PWC simulation below:
2.7 Additional Result Export
We can also define additional results that we want to have by the end of the simulation. The additional results that are available are:
- Forces and Moments: calculates the forces and moments on a selected face, or group of faces
- Probe points: place probe points on the domain to monitor velocity and pressure
- Transient output: transient results of the simulation
- Statistical averaging: time-averaged result for each wind direction simulated and over a selected fraction of the time selected
Note
Keep in mind that the Transient output and Statistical averaging outputs are automatically applied to your region of interest. However, we will add a different region to each output to show how you can assign these to other regions.
a. Forces and Moments
For this tutorial, we will add Forces and Moments into our simulation, specifically for the face of the tallest building that is facing the southwest direction. A Forces and Moments result export can be added by following these steps:
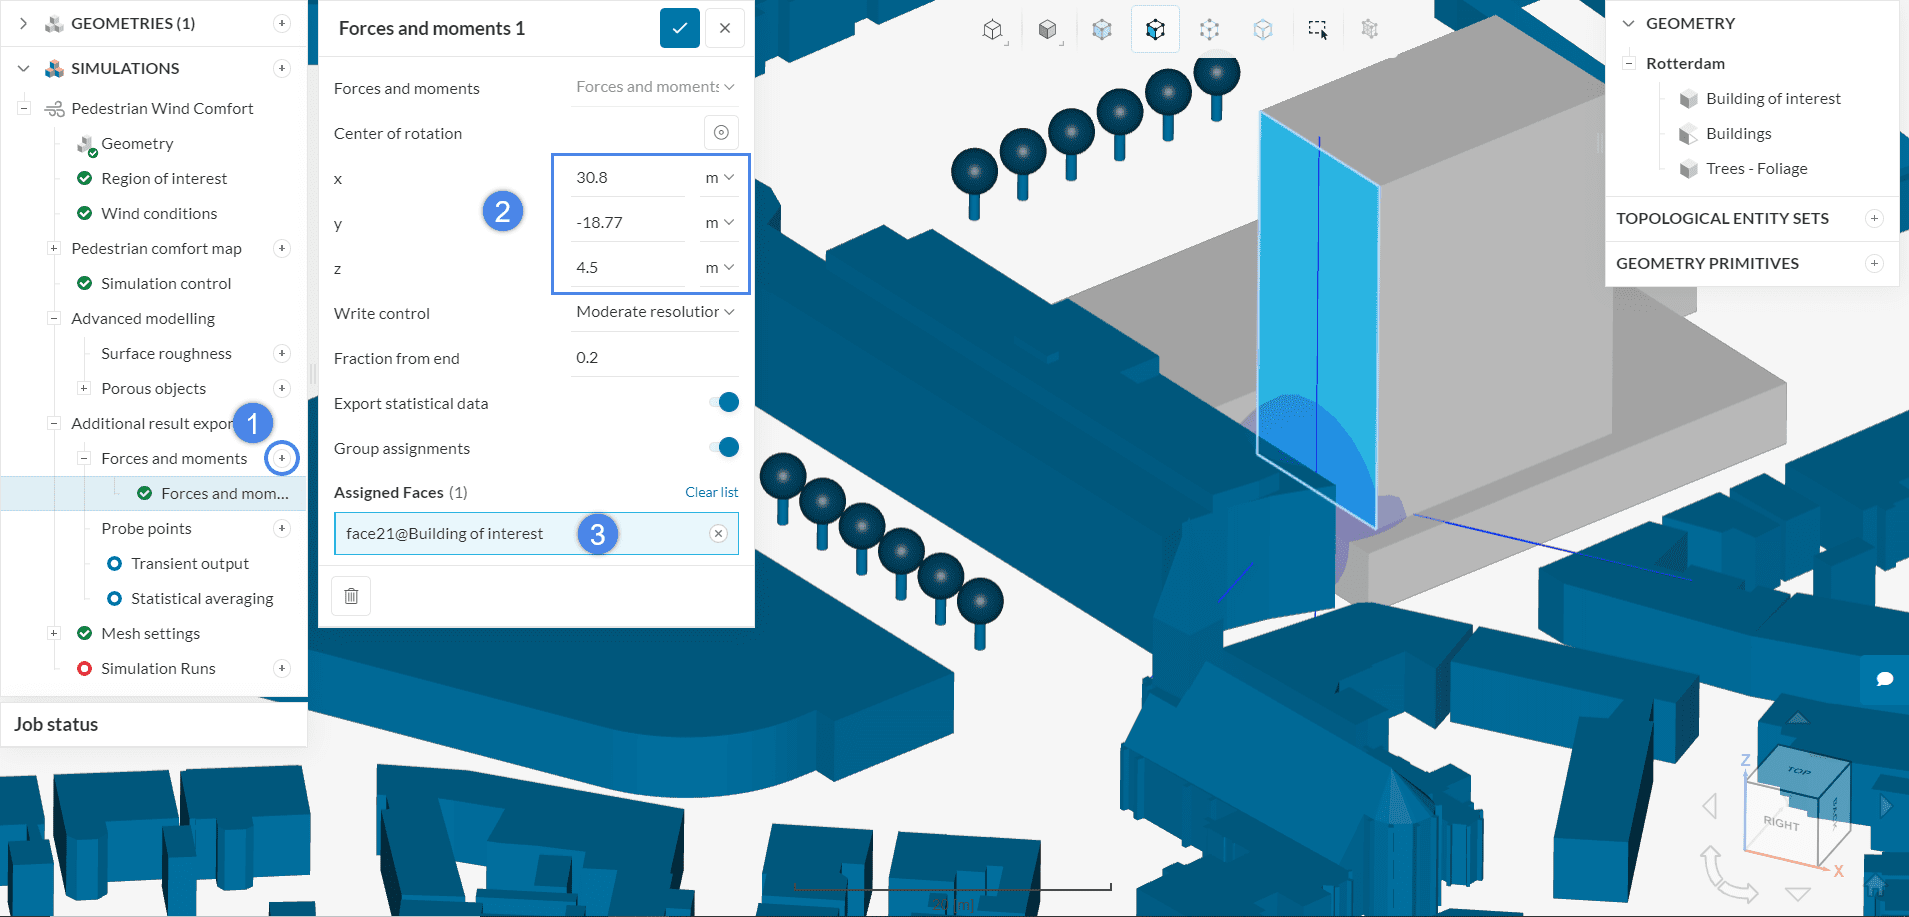
- Firstly, click the ‘+’ button beside Forces and Moments
- Adjust the Center of rotation as required. In this tutorial, we will calculate the moments about the base of the façade. The coordinates are ‘30.8’ meters in x, ‘-18.77’ meters in y, and ‘4.5’ meters in the z-direction.
- Define the face where the forces and moments will be calculated. We will select the face of the highest building that is facing the southwest direction.
b. Transient Output
It is important to remember for Transient output that the larger the region the longer it takes for the simulation to run. Therefore, we will apply a smaller size box. You can follow the steps below to determine the location of your transient output.
- Firstly, click ‘Transient output’
- Click the ‘+’ sign beside Geometry Primitives
- Select ‘Local cartesian box’
- Create your geometry primitives based on the dimensions below:

When you save the local cartesian box settings, they will be automatically assigned to the transient output.
c. Statistical Averaging
For statistical averaging, we will use the same settings as the ones we used for Transient Output. However, all you need to do now is to slide the toggle for the cartesian box created before.
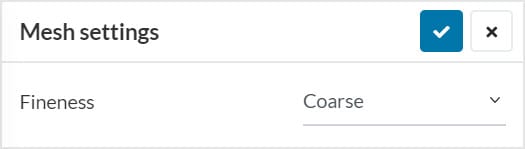
2.8 Mesh
Under mesh settings, the fineness of the mesh can be selected. The selection is ranged from very coarse to very fine, but a coarse mesh will be sufficient for this simulation.
The PWC analysis type also supports local mesh refinement, which is especially useful if there are regions that require additional mesh elements. A more in-depth view of the PWC mesh settings is available in the following article:
3. Start Simulation
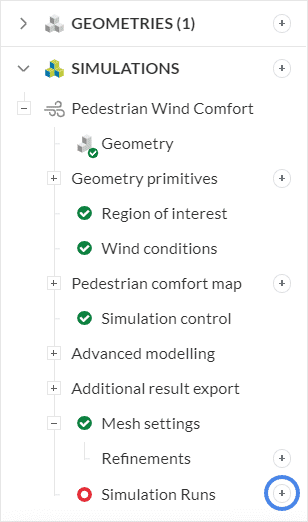
To start the computing process, click on the ‘+’ button next to Simulation Runs. This will create a snapshot of the current simulation tree and will start the computing process.
In SimScale you can leverage cloud computing to run several simulations in parallel, further speeding up the design process.
4. Results
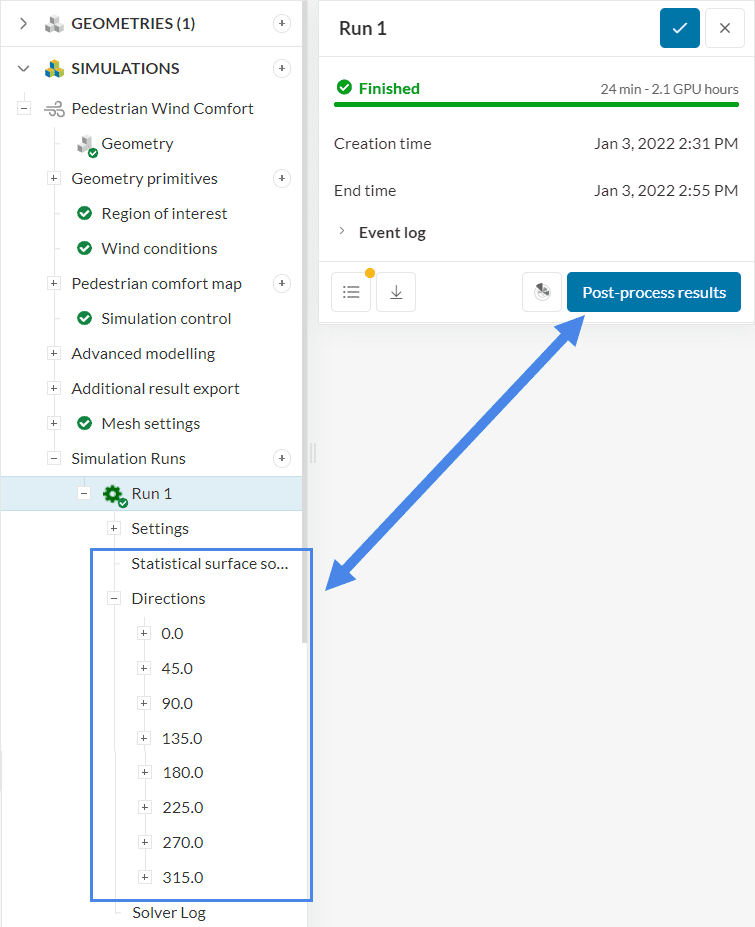
After the simulation finishes running, you will receive a notification via email. For this simulation you will have two main result sets:
- The statistical surface solution contains all the pedestrian comfort and safety plots. These are taken from the frequencies provided by the weather data in the wind rose, as well as the average velocity results in each of the directions.
- Results from individual wind directions: the results from each wind direction will depend on the result export definition. The individual direction results consist of:
- Average result: averaged results from each wind direction, sampled over the final 20% of timesteps
- Transient result: compilation of individual results, sampled over the last 20% of timesteps
You can access the results of the simulation in two ways:
- When the simulation is finished, a dialog box will show that your simulation has finished. You can click on the ‘Post-process results’ button to post-process your results, and it will take you to the averaged statistical results of the simulation.
- Select your simulation run in the simulation tree, and the results will be shown below the run.
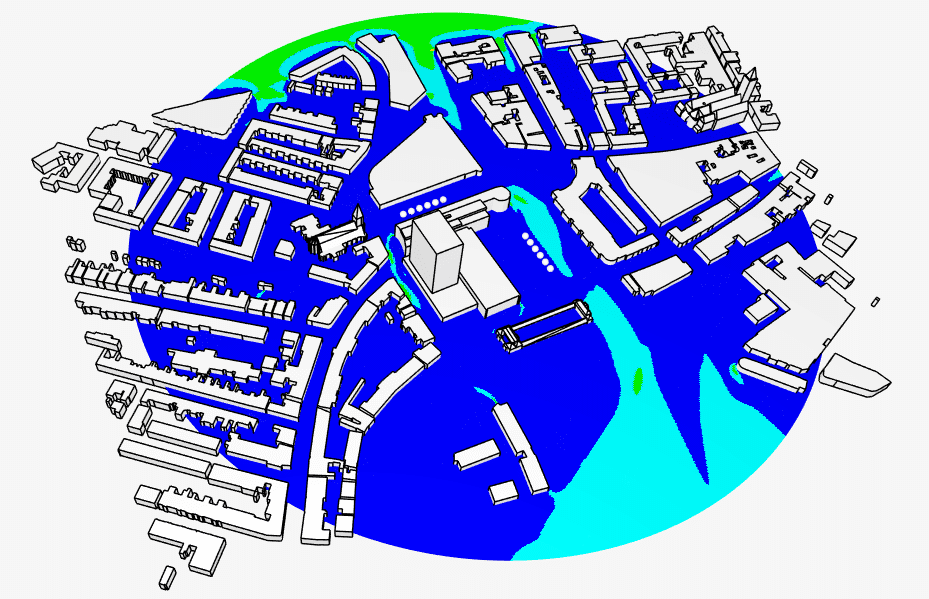
4.1 Statistical Surface Solution
The Statistical surface solution shows the wind comfort results. There are several criteria available to choose from, depending on your needs. For example, the figure below is a visualization of the Lawson wind comfort criteria using mean velocities as a base.
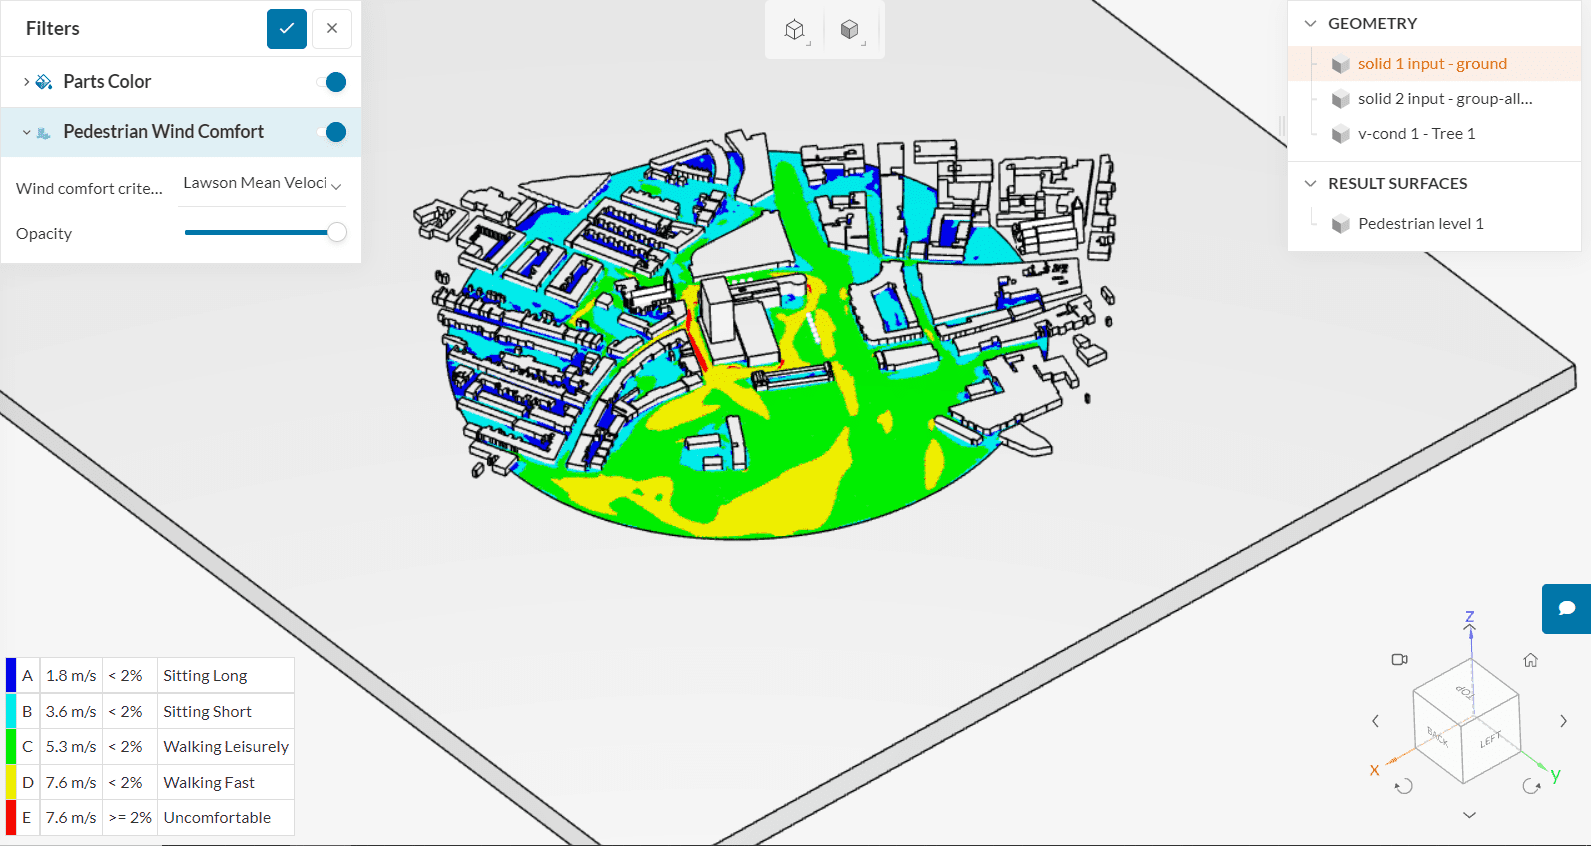
The following comfort criteria are available!
- Davenport
- London LDDC
- Lawson
- Lawson 2001
- Lawson LDDC Comfort
- NEN8100 Comfort
- NEN8100 Danger
Furthermore, it’s possible to select Mean velocities, Gust equivalent mean velocities (GEM), or Max velocities for the pedestrian comfort calculation. For further information, please visit this page.
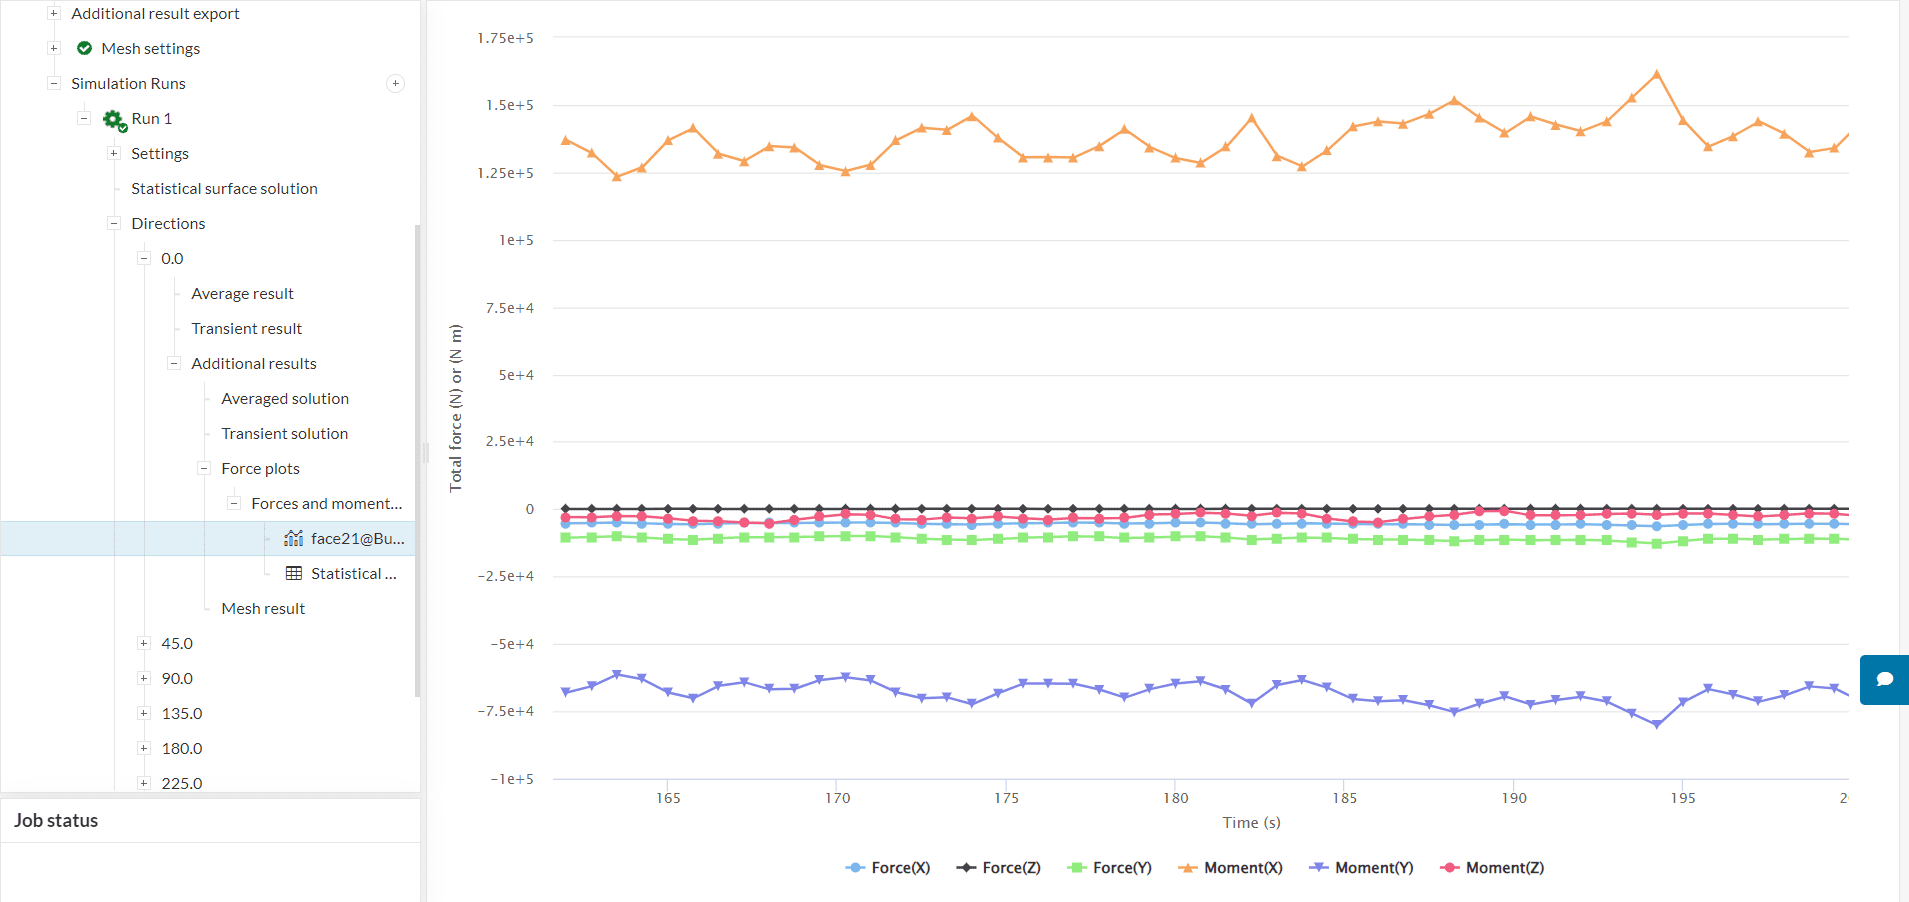
4.2 Forces and Moments
By clicking on each wind direction, you will be given a temporal graph of the calculated Forces and Moments for the assignments. You can choose which data you want to display by clicking the legends, and this will then toggle the visibility of the data.
Below is an image of the forces and moments for the 0-degree wind direction results:
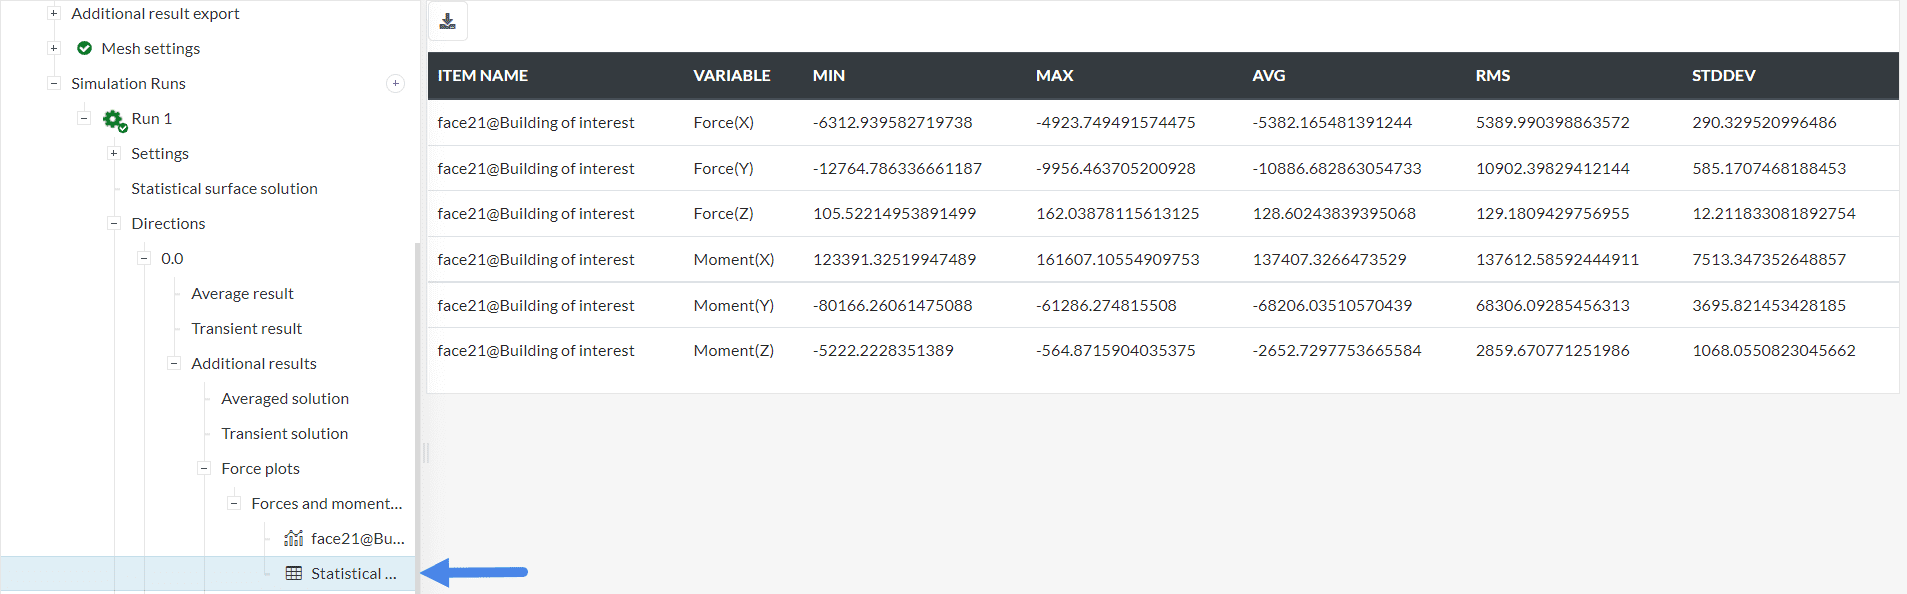
It’s also possible to view the forces and moments results in Statistical mode. With this option, the user can check minimum, maximum, average, root mean square (RMS), and the standard deviation of forces and moments:
4.3 Average Result
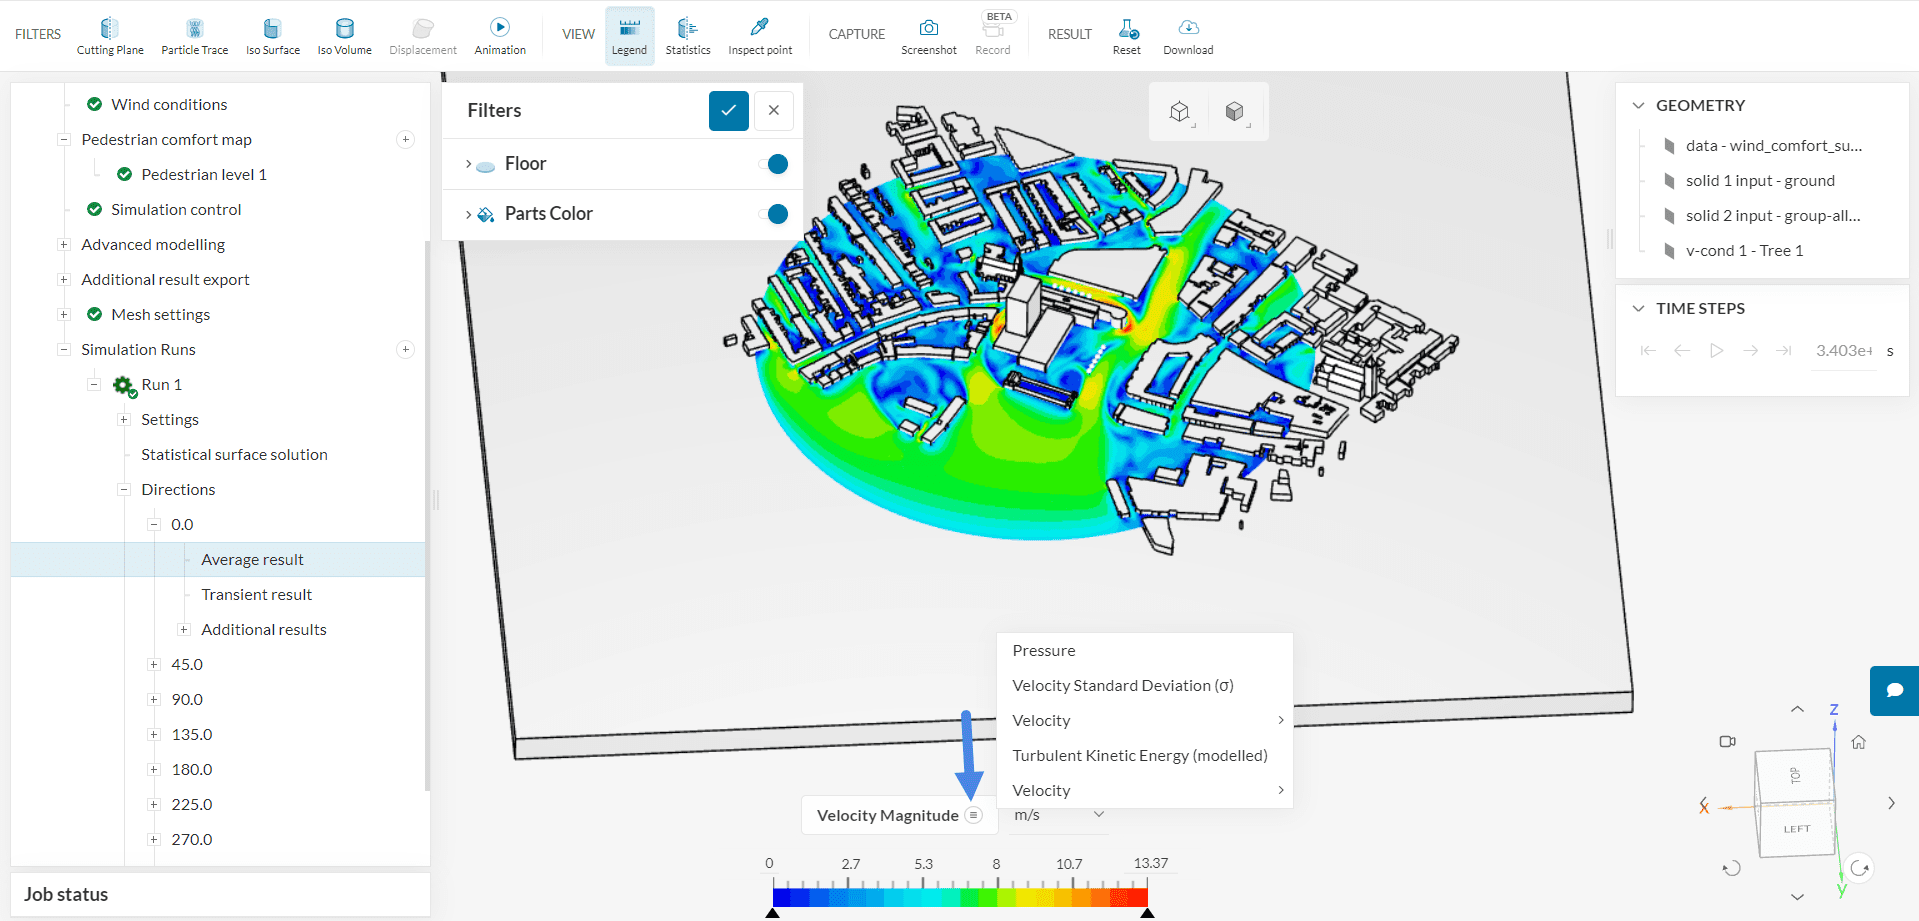
As explained previously, you can also access averaged results on the pedestrian level from each wind direction. After selecting ‘Average result’, you will be directed to the post-processor.
In the post-processor, you can select what parameter you want to plot. The image below shows the velocity magnitude at the pedestrian level, however, you can also see other parameters by changing the input:
4.4 Transient Results
You can access the transient results on the pedestrian level by clicking on ‘Transient results’. After creating an animation using the top filter ribbon, this is what the velocity results look like at the pedestrian level:
4.5 Cutting Planes
In section 2.7 from this tutorial, we defined Additional result exports within a cartesian box. Therefore, we can access the averaged and transient data under Additional results. For instance, we can open the ‘Averaged solution’ and create a cutting plane filter:
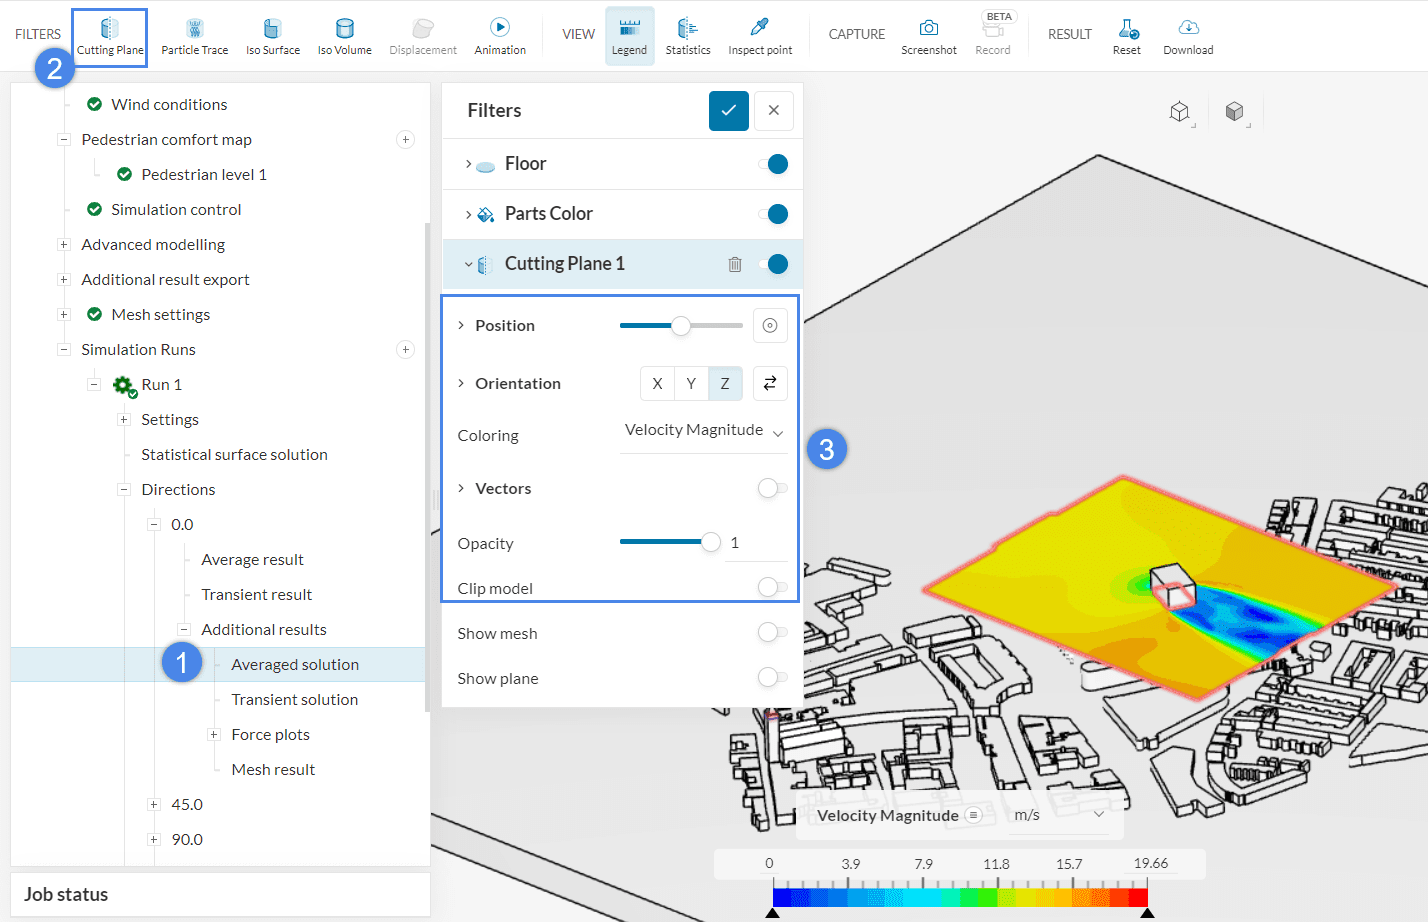
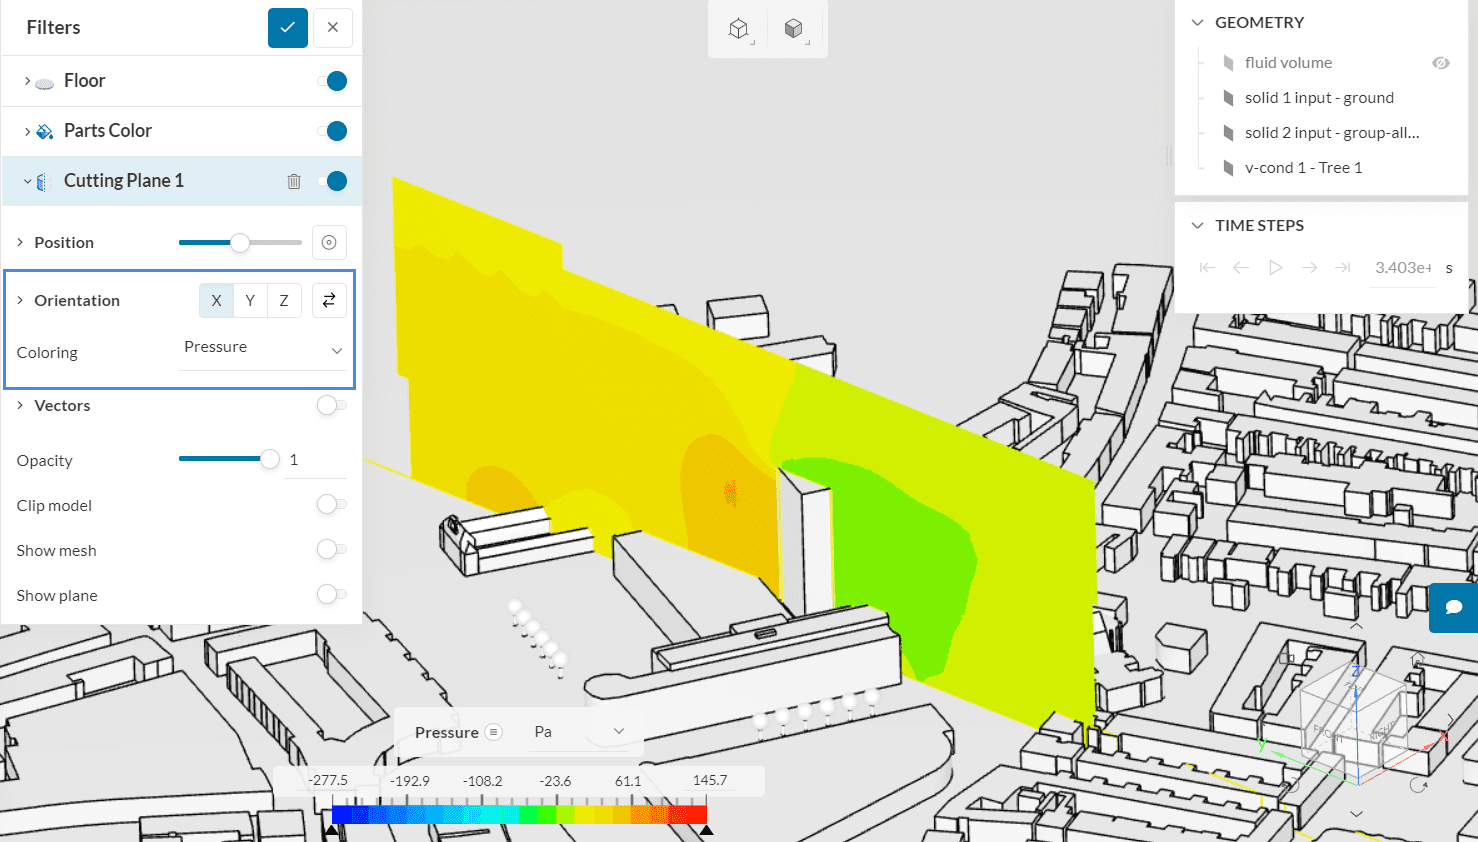
In this configuration, the cutting plane is normal to the z-direction and it shows the velocity magnitude. It is easy to change the orientation and coloring of interest – for example, the image below shows pressure levels on a cutting plane normal to the x-direction:
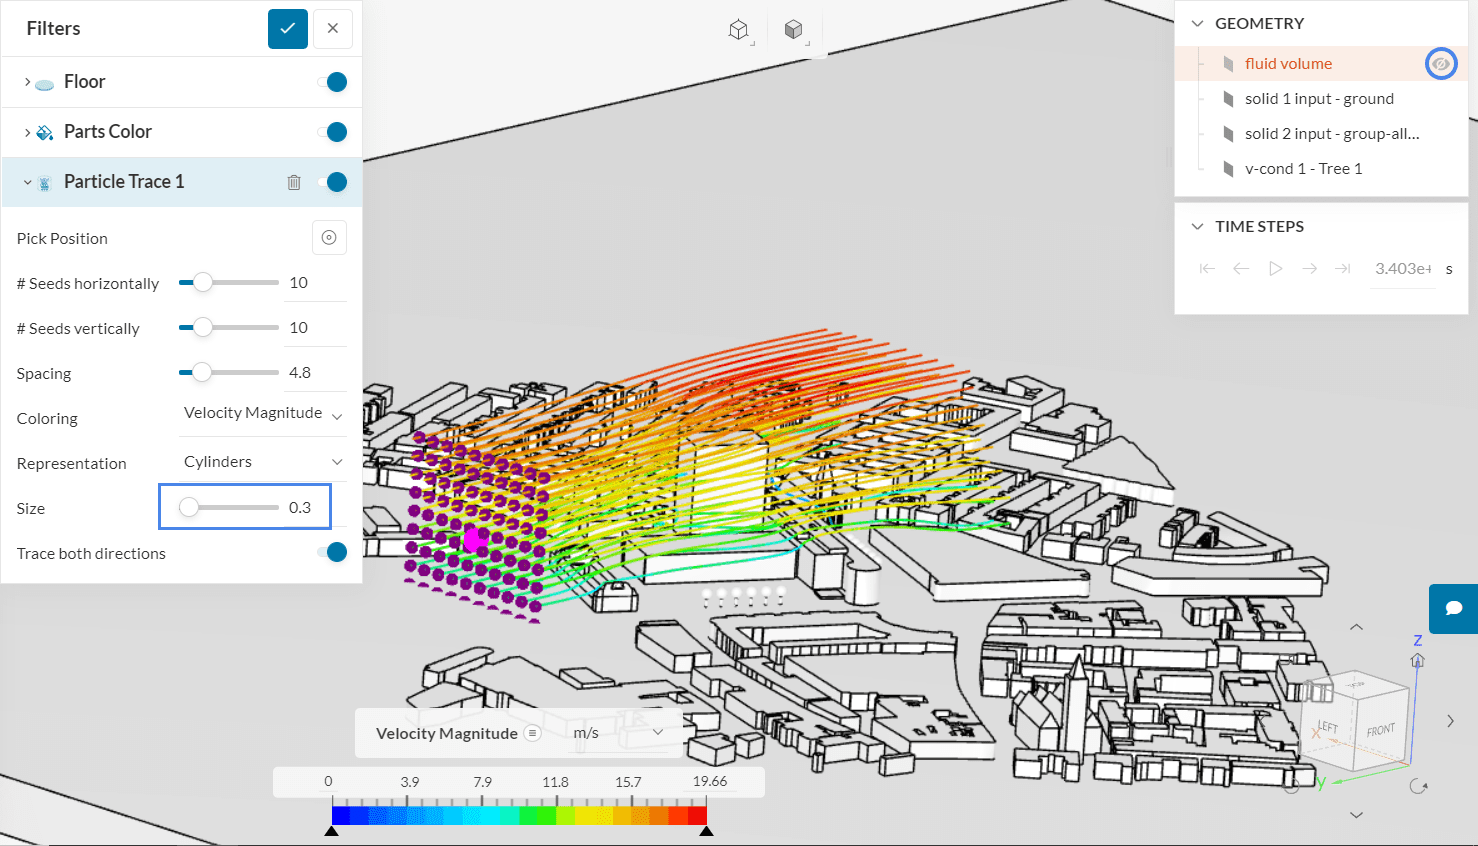
4.6 Particle Traces
Still looking at the averaged results, let’s now create a Particle Trace filter. This filter allows you to track the path of fluid particles as they travel across the domain. Please follow the steps below:
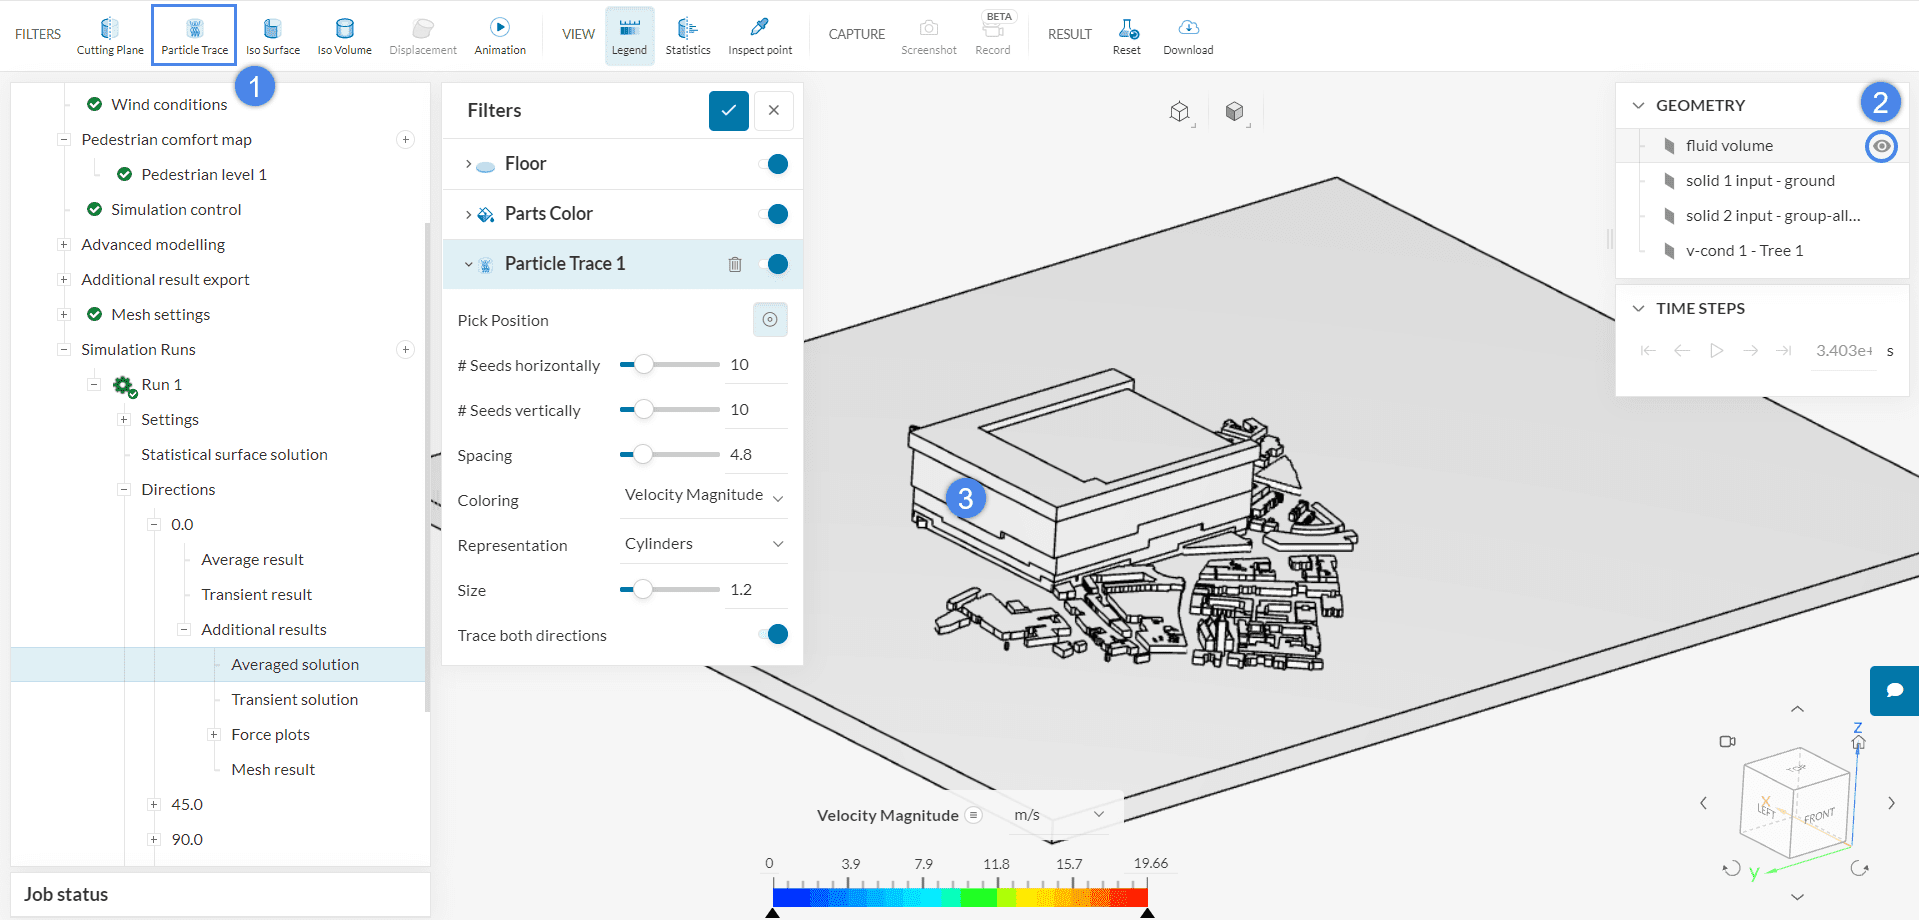
- Select a ‘Particle Trace’ filter from the top ribbon.
- Make sure that the fluid volume is visible by clicking on the ‘eye icon’.
- Select a face of the fluid volume to generate the traces from.
Filters in SimScale are loaded with default settings, however, they are highly customizable. For example, for this simulation, the particle traces are too large. Let’s adjust the Size of the traces and hide the fluid domain to improve the visualization:
A complete description of filters and their settings is available on this documentation page.
Congratulations! You finished the pedestrian wind comfort simulation tutorial!
Note
If you have questions or suggestions, please reach out either via the forum or contact us directly.
References
Last updated: February 3rd, 2023
Did this article solve your issue?
How can we do better?
We appreciate and value your feedback.
What's Next
Pedestrian Wind Comfort Documentation

