Quite often, we get asked if a user was to use only 4 directions, or even just one predominant direction to assess wind comfort, can it be enough to quantitatively evaluate one design to another, and if so, what will the accuracy be like compared to using more directions?
Solution
The reason we want to know this is because the more directions we solve, naturally, the more expensive the simulation is.
- We may have to use 36 directions (City of London Guidelines) according to compliance purposes, but…
- for many use cases, this is simply not necessary.
Note
We cannot explicitly answer the question as it is very case dependent. What we can do is perform a case study which will provide some insight into what is enough.
Case Study
Let’s take a look at a case study:
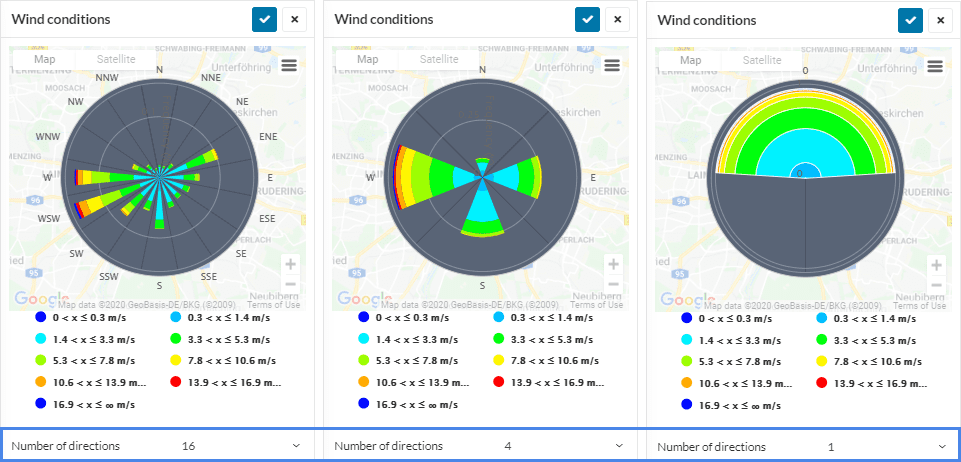
We run the same model but using varying numbers of directions, since the comfort criteria uses all the directions solved in a wind assessment, we naturally expect a larger number of directions to be more accurate, and a lower number to be less accurate.
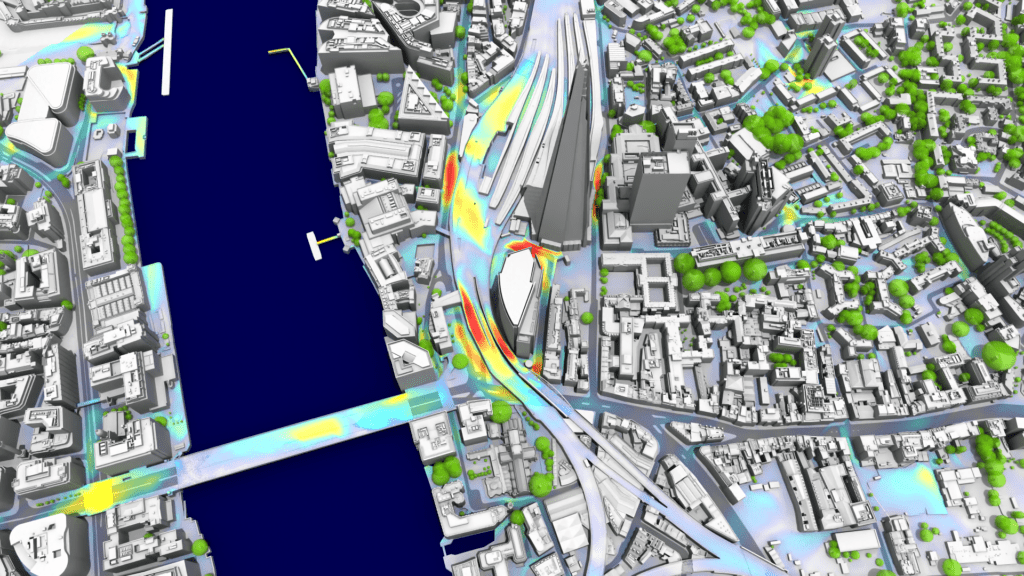
This case study uses a very detailed model supplied by our partner AccuCities, where a large area of London around the shard is represented in detail, including building details, topology details, and even trees. The assessment looks at how results differ across a range of different directions from 1 to 36, where 1 is simply the prevailing wind direction.
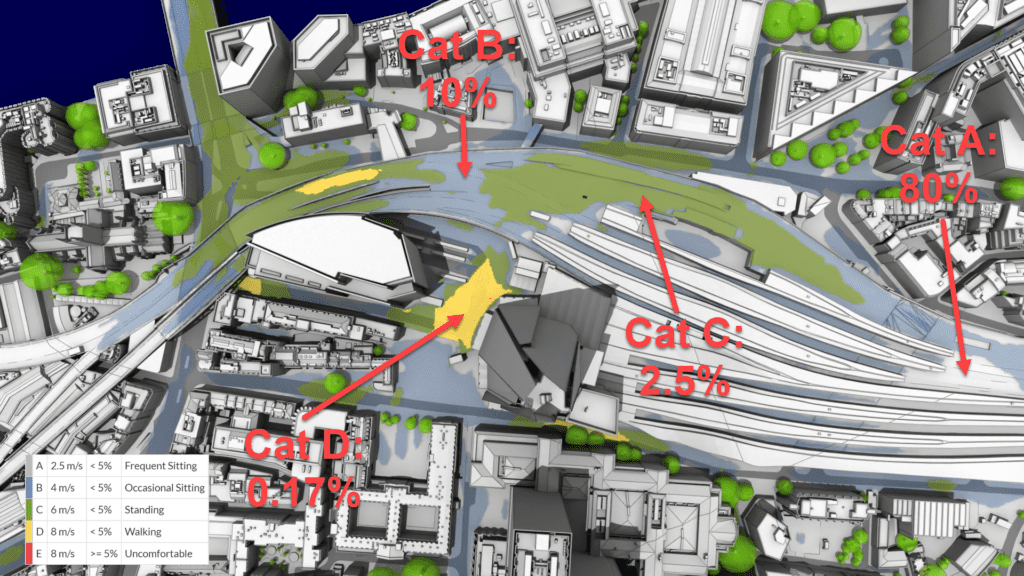
To be clear in how we obtain the numbers in Figure 4, an illustration is presented in Figure 3, showing an example. The example is for an 8 direction case, where approximate % areas are shown for the categories. It is important to note here that the above image only shows a small part of the region of interest.
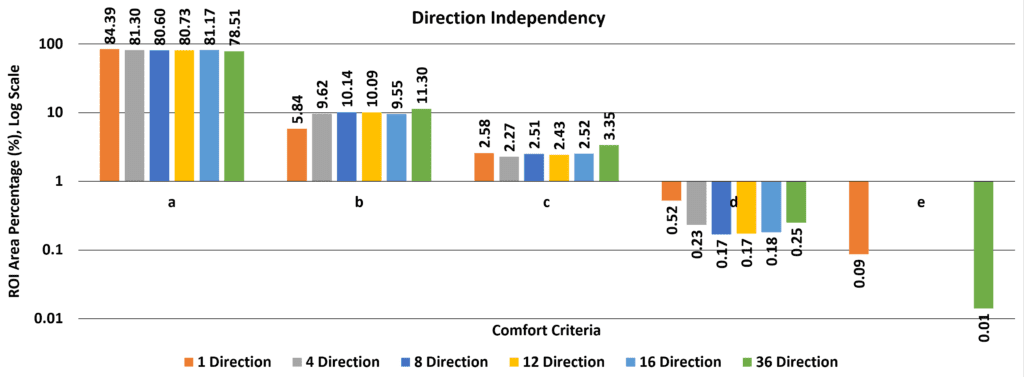
The above graph shows the percentage (%) of the area within the region of interest that the categories A to E in the City of London Guidelines Lawson criteria belong to.
Along the x-axis are categories A-E, where each corresponds to the comfort map shown in the legend of Figure 3. For each category, there exists a bar representing different runs where the only change is the number of directions that were run in the analysis. The Y-axis is the percentage in the log scale. We expect the bars to be fairly similar per category which they are, however, some deviation is visible due to the increase in accuracy through the increase in the number of directions run.
For example, Category A, Frequent Sitting, makes up approximately 80% of the region of interest by area, in contrast, category C, Standing, makes up for approximately 2.5% of the area. To assess the sensitivity of the number of directions we can compare all of the directions for each category.
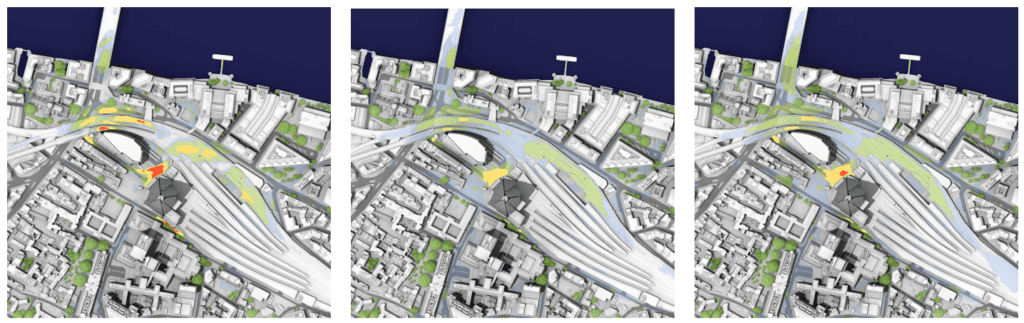
The above plots show comfort levels for 1, 12, and 36 directions show how this variation looks like in the actual comfort map.
The important takeaways are that for 1 direction a much higher discomfort is shown in comparison to 12 and 36 directions. Twelve directions show similar levels of comfort in comparison to 36 directions however, 36 directions show an area of ‘uncomfortable’ that isn’t exposed in the other results. Furthermore, 36 directions show a smoother boundary to each comfort level (less discretization).
Summary
To summarise the results, we can say that actually a single direction is a good indicator of how the final results might look, however, it significantly under predicts category B and over predicts category D and E. this makes the comfort seem more uncomfortable, but, this is at least more desirable than making it seem more comfortable. We could say that a single direction is off by up to 50% for category B and 50% off for category D. For Category E, we should probably discard it as a true indicator of uncomfortable area.
4, 8, 12, and 16 directions all produce fairly similar results, and if we were to pick a good balance between those, 8 or 12 directions would be a safe bet (which we know to be true as we typically choose 12 directions in best practices). Thes results can be relied on to be up to 30% for some categories, however, they do not show in this case and ‘uncomfortable’ category E areas.
However, concluding on 36 directions shows a marginal change in all categories, and instead of predicting no category E, Uncomfortable (like 4, 8, 12 and 16 directions) it predicts a small area of 0.01%, and although this does not seem significant, it is significant enough to show an area that needs to be mitigated.
This means that although for most purposes 4, 8 or 12 directions might be sufficient, however, 36 directions are still required to prove an end design is comfortable to a planning authority. 1 Direction can be used for a quantitative analysis between designs but a better choice would be 4 directions for this use case.
Note
If you have questions or suggestions, please reach out either via the forum or contact us directly.