Cavitation Model
Cavitation is the phenomenon in which the formation of bubbles or cavities takes place in liquids when the local pressure falls below the liquid vapor pressure. This is common in pumps, hydraulic turbines, and marine propellers. The subsequent rise in pressure causes the bubbles to collapse, leading to localized shockwaves that:
- damage the equipment through wearing and erosion.
- cause noise and vibration.
- cause drop in BEP and flow rate.
In SimScale, cavitation can be modeled in Multi-purpose simulations and the implementation is based on the ‘Full Cavitation Model’ by Singhal et al1. The Constant gas mass fraction cavitation model in SimScale:
- models the formation and collapse of vapor bubbles.
- models the effect of non-condensable gas.
- can handle severe aeration and cavitation.
- has an automated convergence logic.
- can handle severe initial conditions.
Cavitation can be toggled on as shown in the image below:
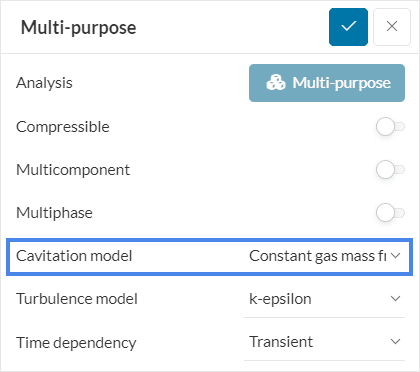
When Cavitation is toggled on, the material settings panel requires additional inputs.
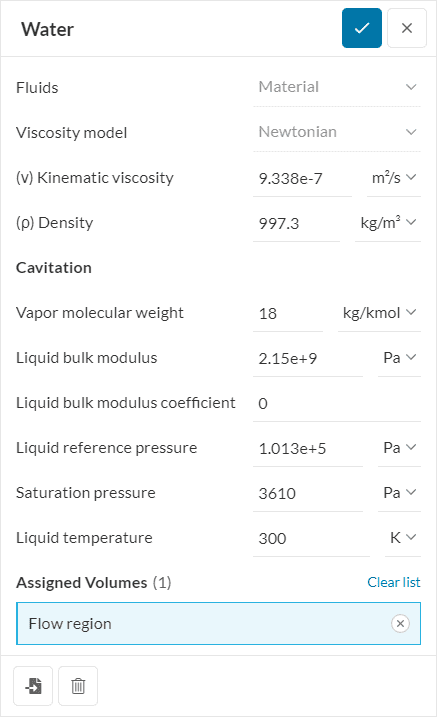
The cavitation related inputs are described below:
- Vapor Molecular Weight: This is the molecular weight of the vapor component of the fluid.
- Liquid Bulk Modulus: This is the bulk modulus of the liquid component of the fluid.
- Liquid Reference Pressure: This is used to calculate density.
- Saturation Pressure: This is the threshold pressure at which the vapor and its liquid are at equilibrium.
- Liquid Temperature: This is the bulk temperature of the liquid component of the fluid.
Cavitation Post-Processing
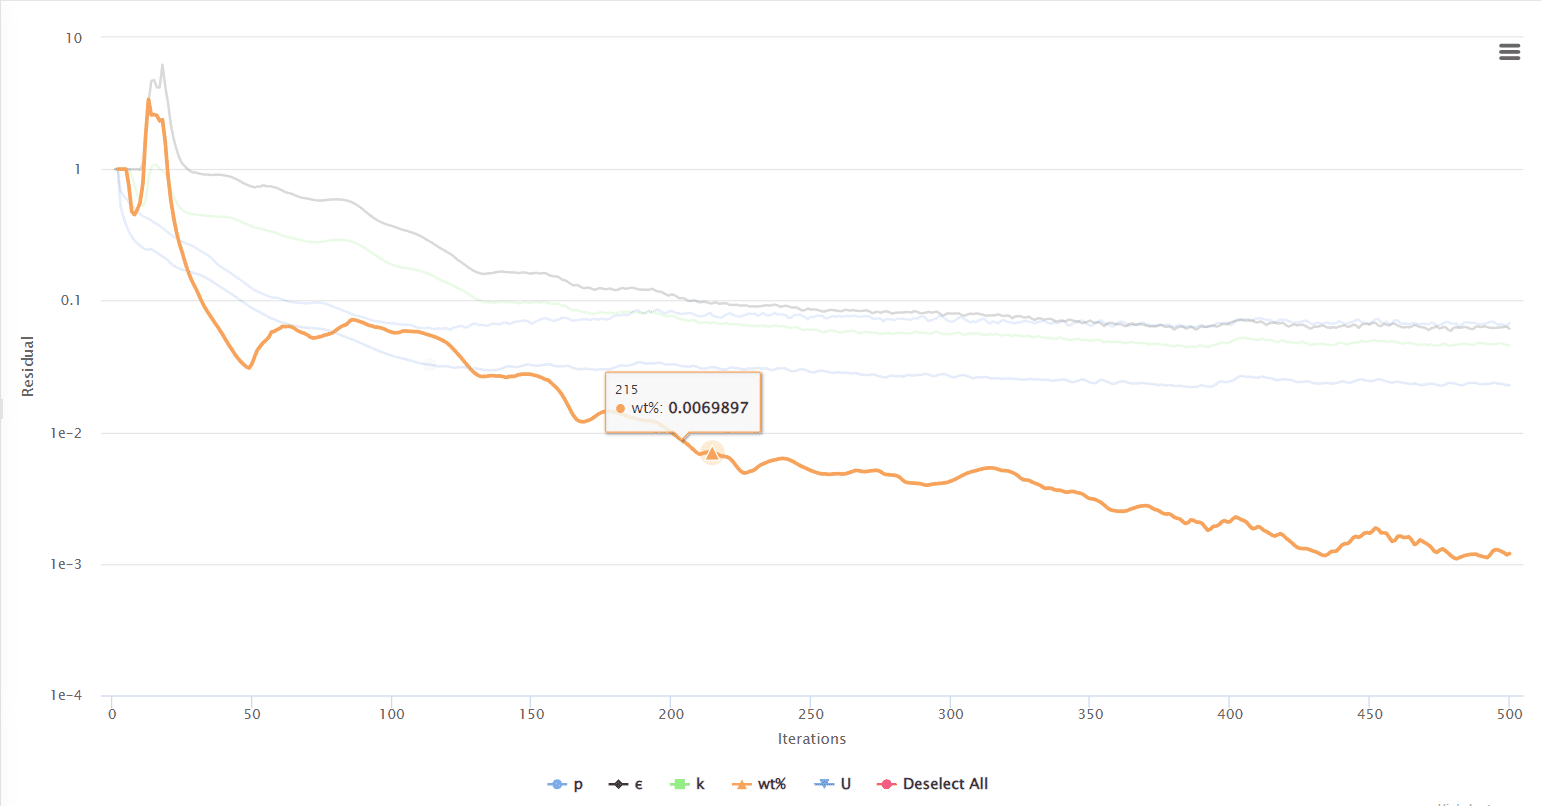
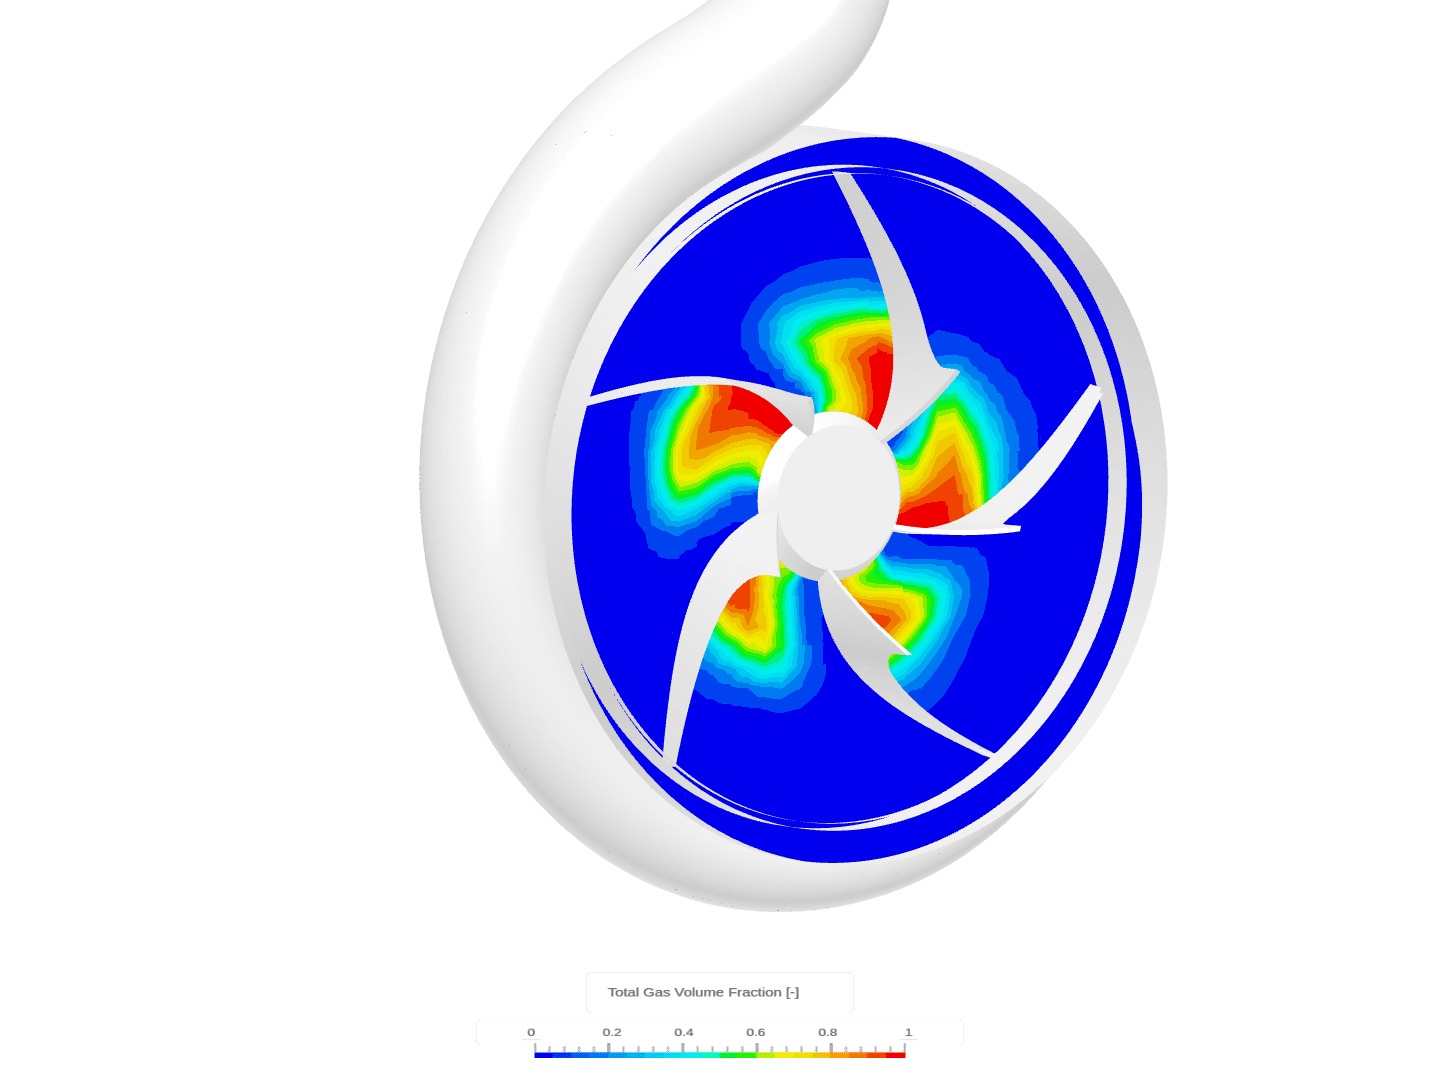
When Cavitation is toggled ON, there are additional fields available in results post-processing, as described below:
- The residuals of the ‘vapor mass fraction’ are displayed in the convergence plots. A drop in vapor mass fraction residual is an indicator of the convergence of the cavitation module.
- Additionally, the ‘Total Gas Volume Fraction’ can be visualized as a 3D field, which is indicative of the regions in the domain where vapor bubbles exist. In other words, visualizing the total gas volume fraction helps to pinpoint the location and strength of cavitation in the system.
Last updated: October 9th, 2024
Did this article solve your issue?
How can we do better?
We appreciate and value your feedback.


