This article explains why particle traces may disappear during post-processing and how to improve the visualization using additional seed locations.
What Are Particle Traces, and Why Do They Disappear?
Particle traces help visualize flow movement, similar to dye injected into a fluid. For detailed steps on how to create particle traces, please refer to this article.
Sometimes, particle traces may disappear during the animation even when the flow remains inside the domain. This behavior does not necessarily indicate a bug. It depends on how the post-processor calculates and displays the traces.
Particle traces are generated from defined seed points and follow the local flow field until a stopping condition is reached. One common reason for traces to stop or disappear is that they intersect a wall boundary. This can happen in multiple cases, such as when the flow passes through tight spaces, accelerates around sharp corners, or approaches a wall at high speed. Although the visual disappearance of the traces may appear different in each case, the underlying reason is the same: the particle trace has reached a wall boundary and is therefore terminated. This does not mean that the flow solution itself disappears; only the visualization of that particular trace has ended.
The video below shows an example where particle traces terminate during the animation while the flow field remains inside the domain.
Keep in mind!
This article focuses on cases where particle traces disappear even though they still appear to be inside the flow domain. It does not refer to the expected case where traces terminate because they leave the domain through an outlet or opening.
How to Prevent Particle Traces from Disappearing Too Early
To improve the visualization, create multiple particle traces at different locations in the domain. Do not rely on a single seed location. Instead, add new particle traces in the regions where the previous traces begin to terminate. This approach helps show the main flow structures more clearly.
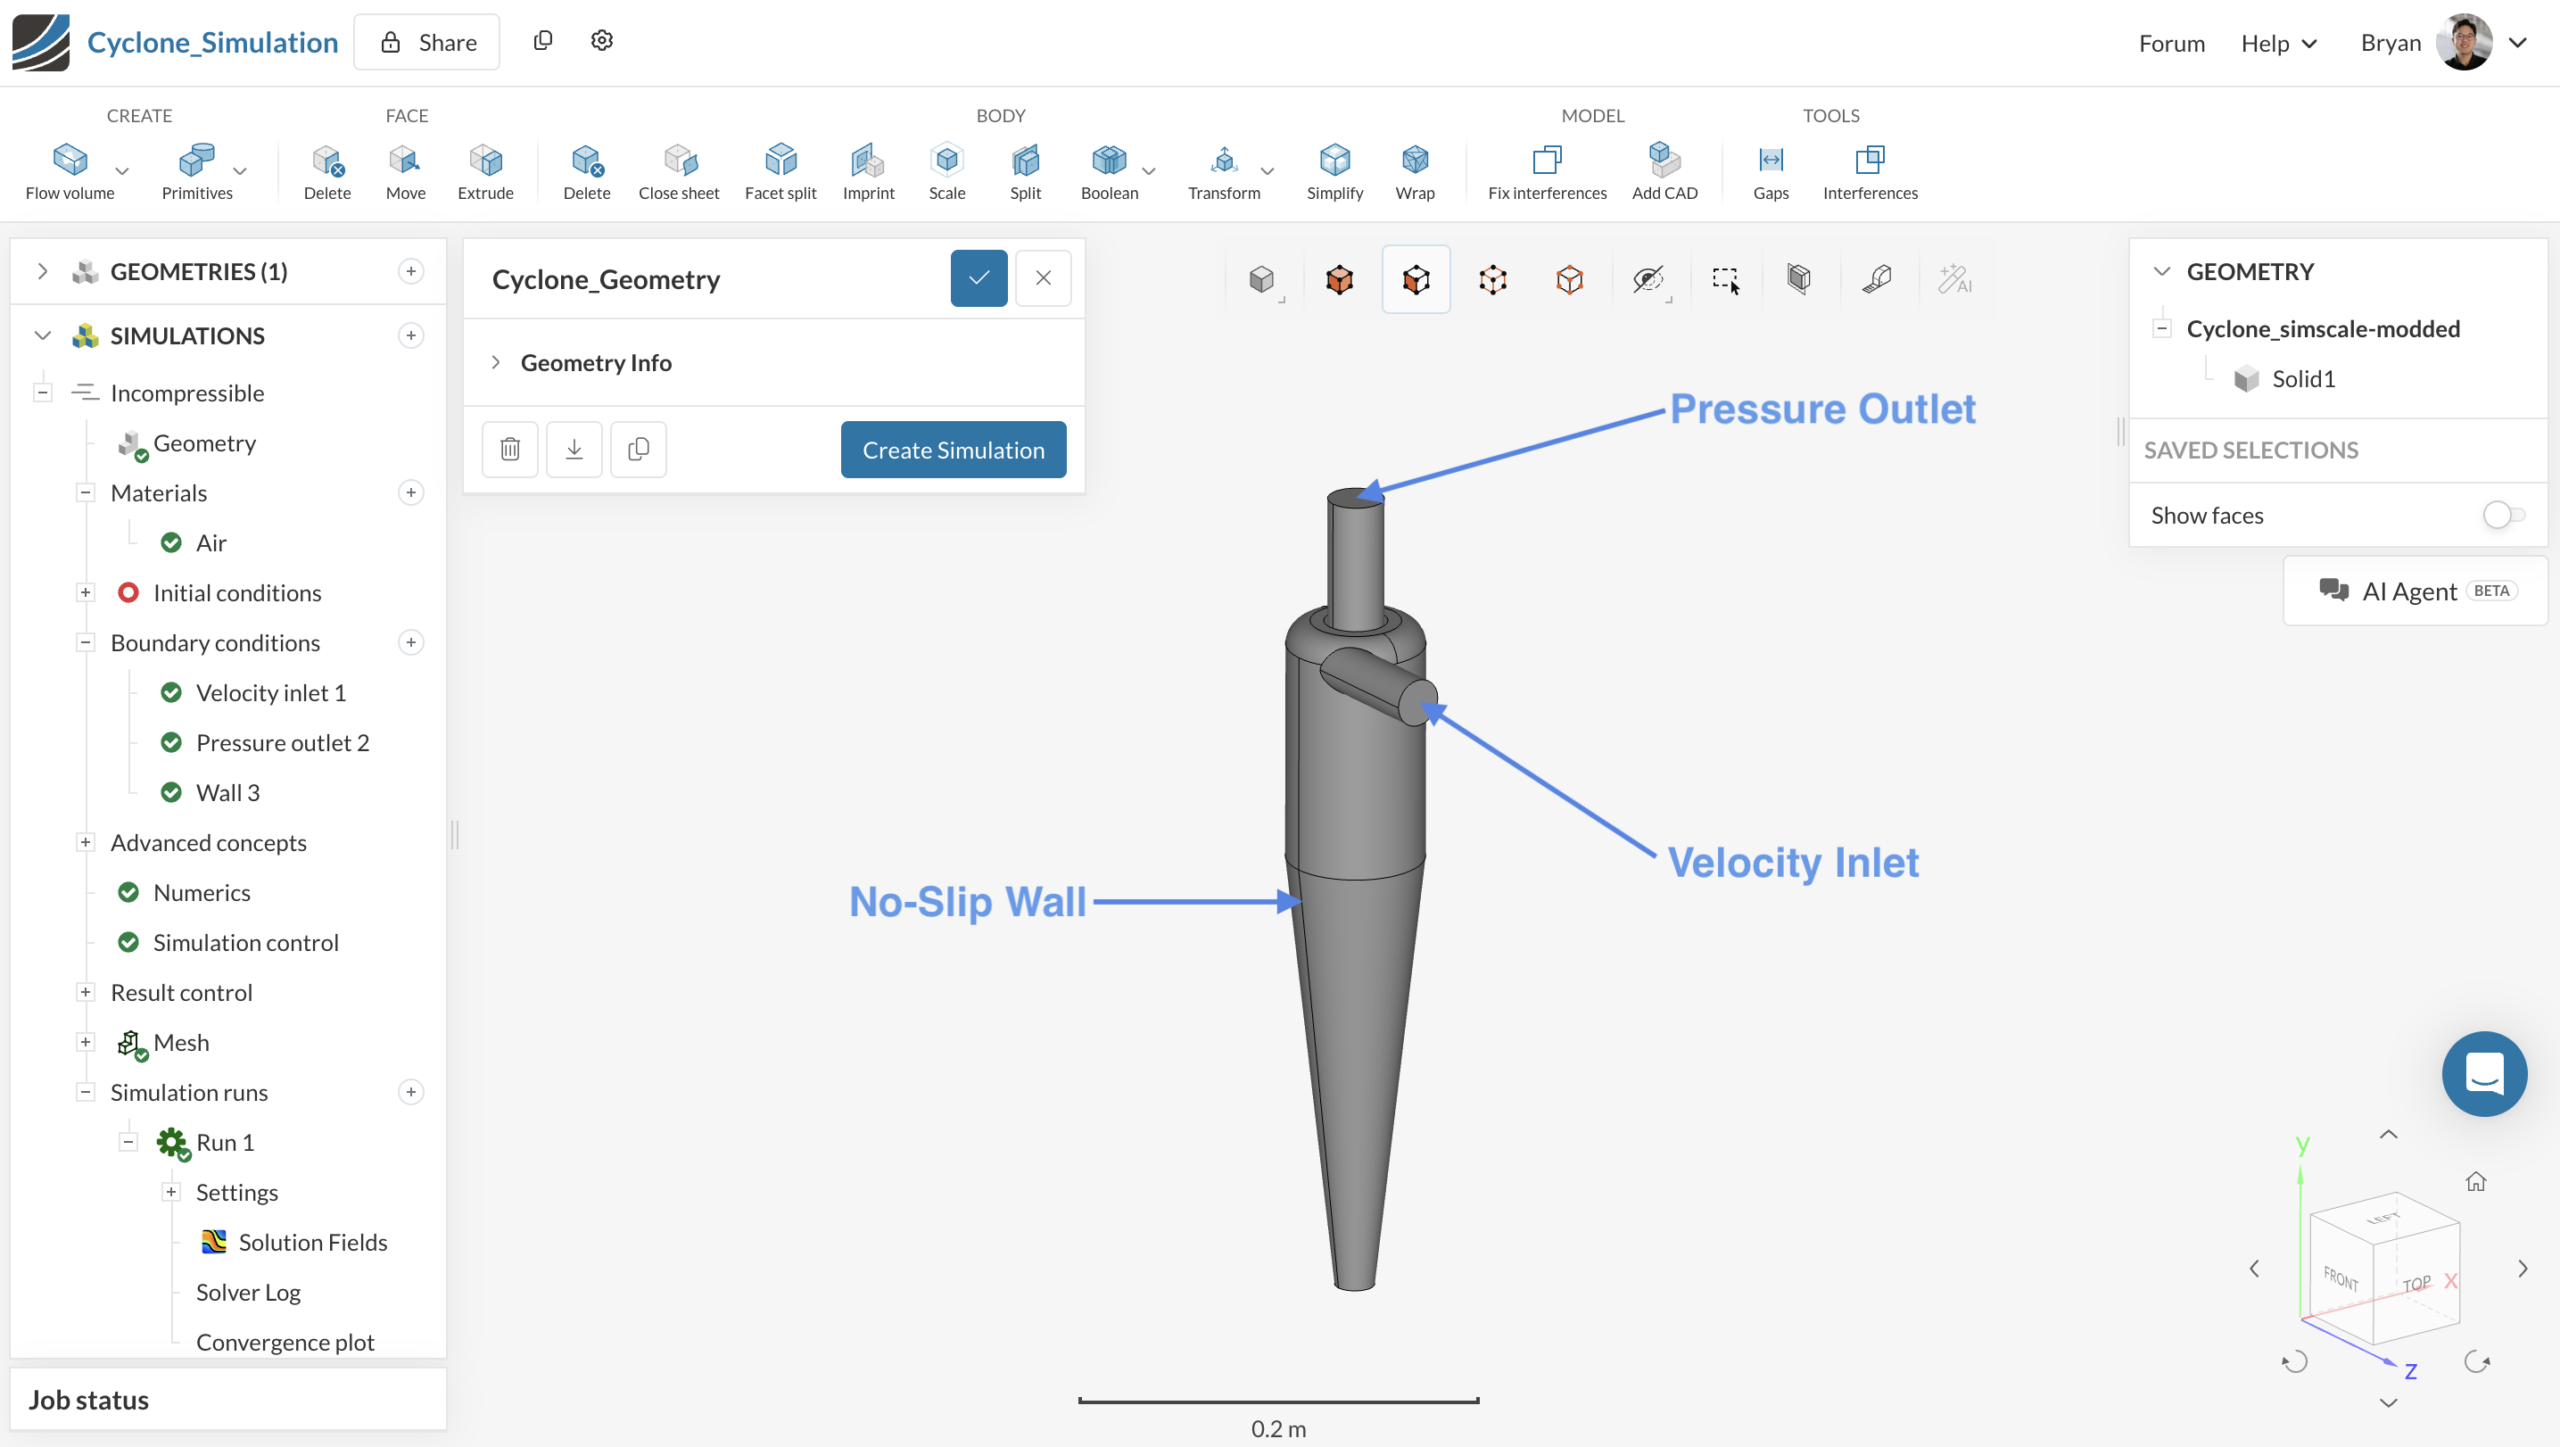
In this example, the cyclone simulation mentioned above demonstrates the workflow. Figure 1 shows the geometry and boundary conditions of the cyclone model.
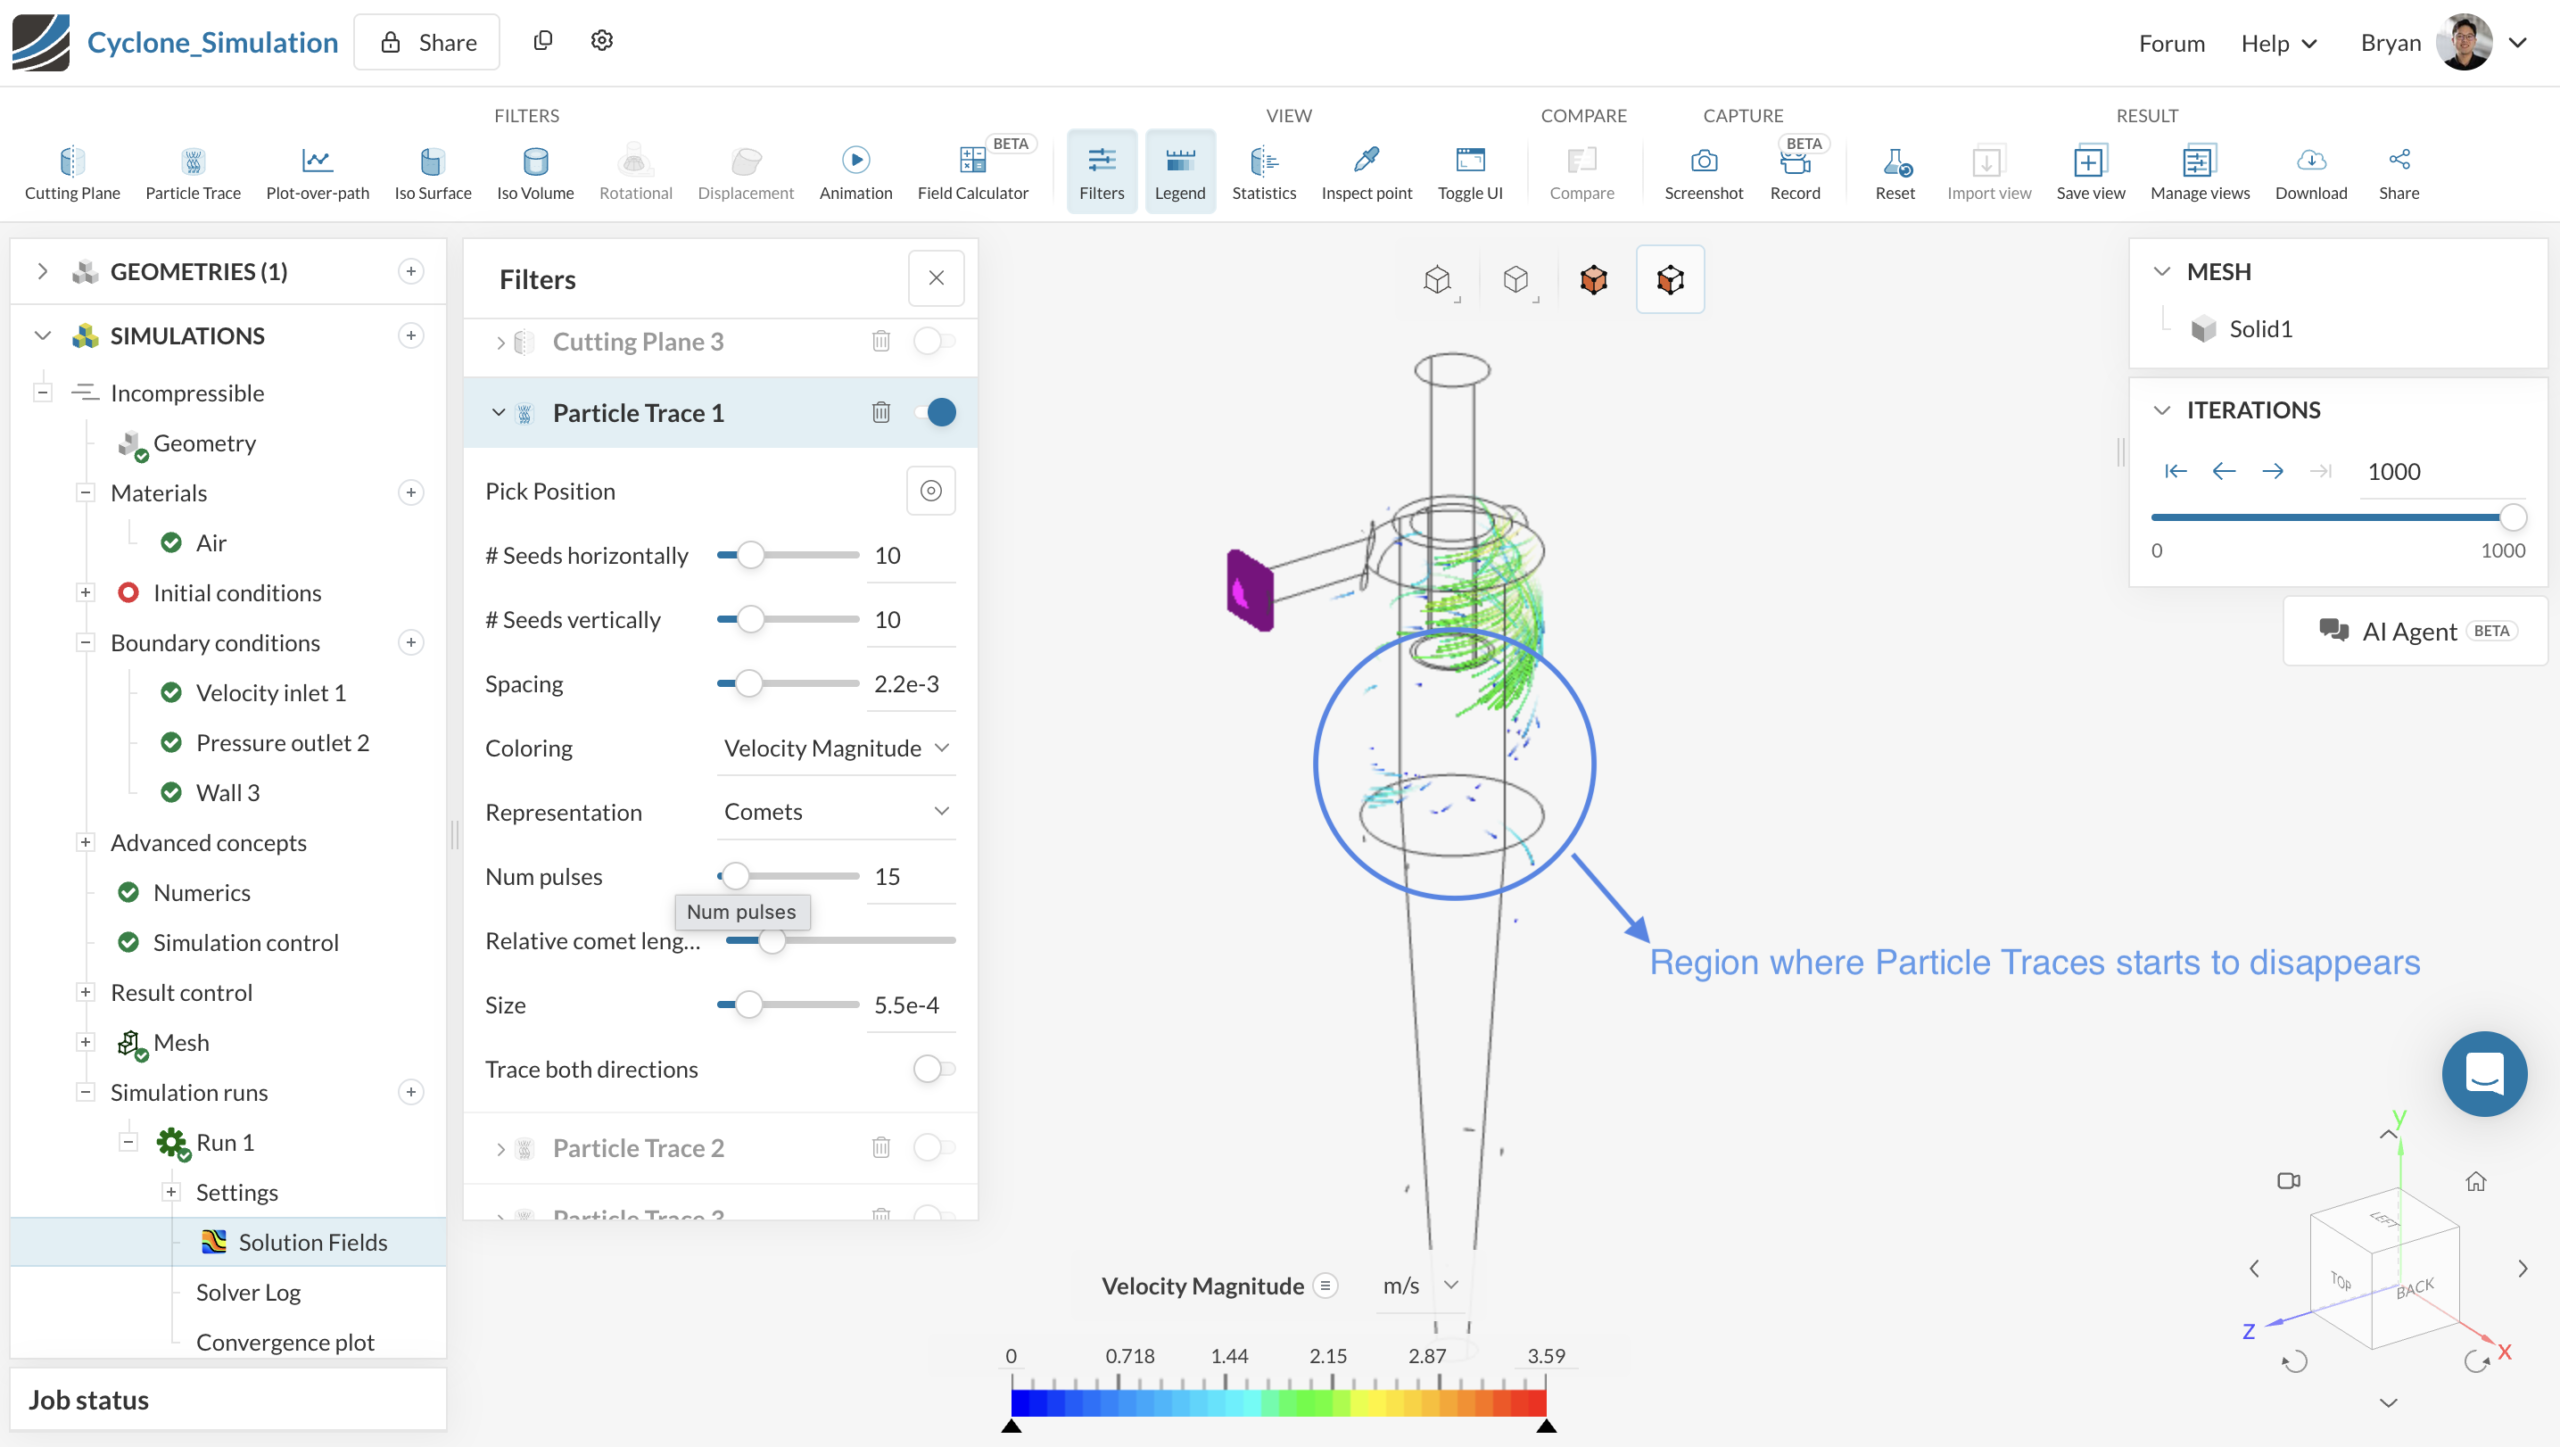
Step 1: Identify where particle traces begin to disappear
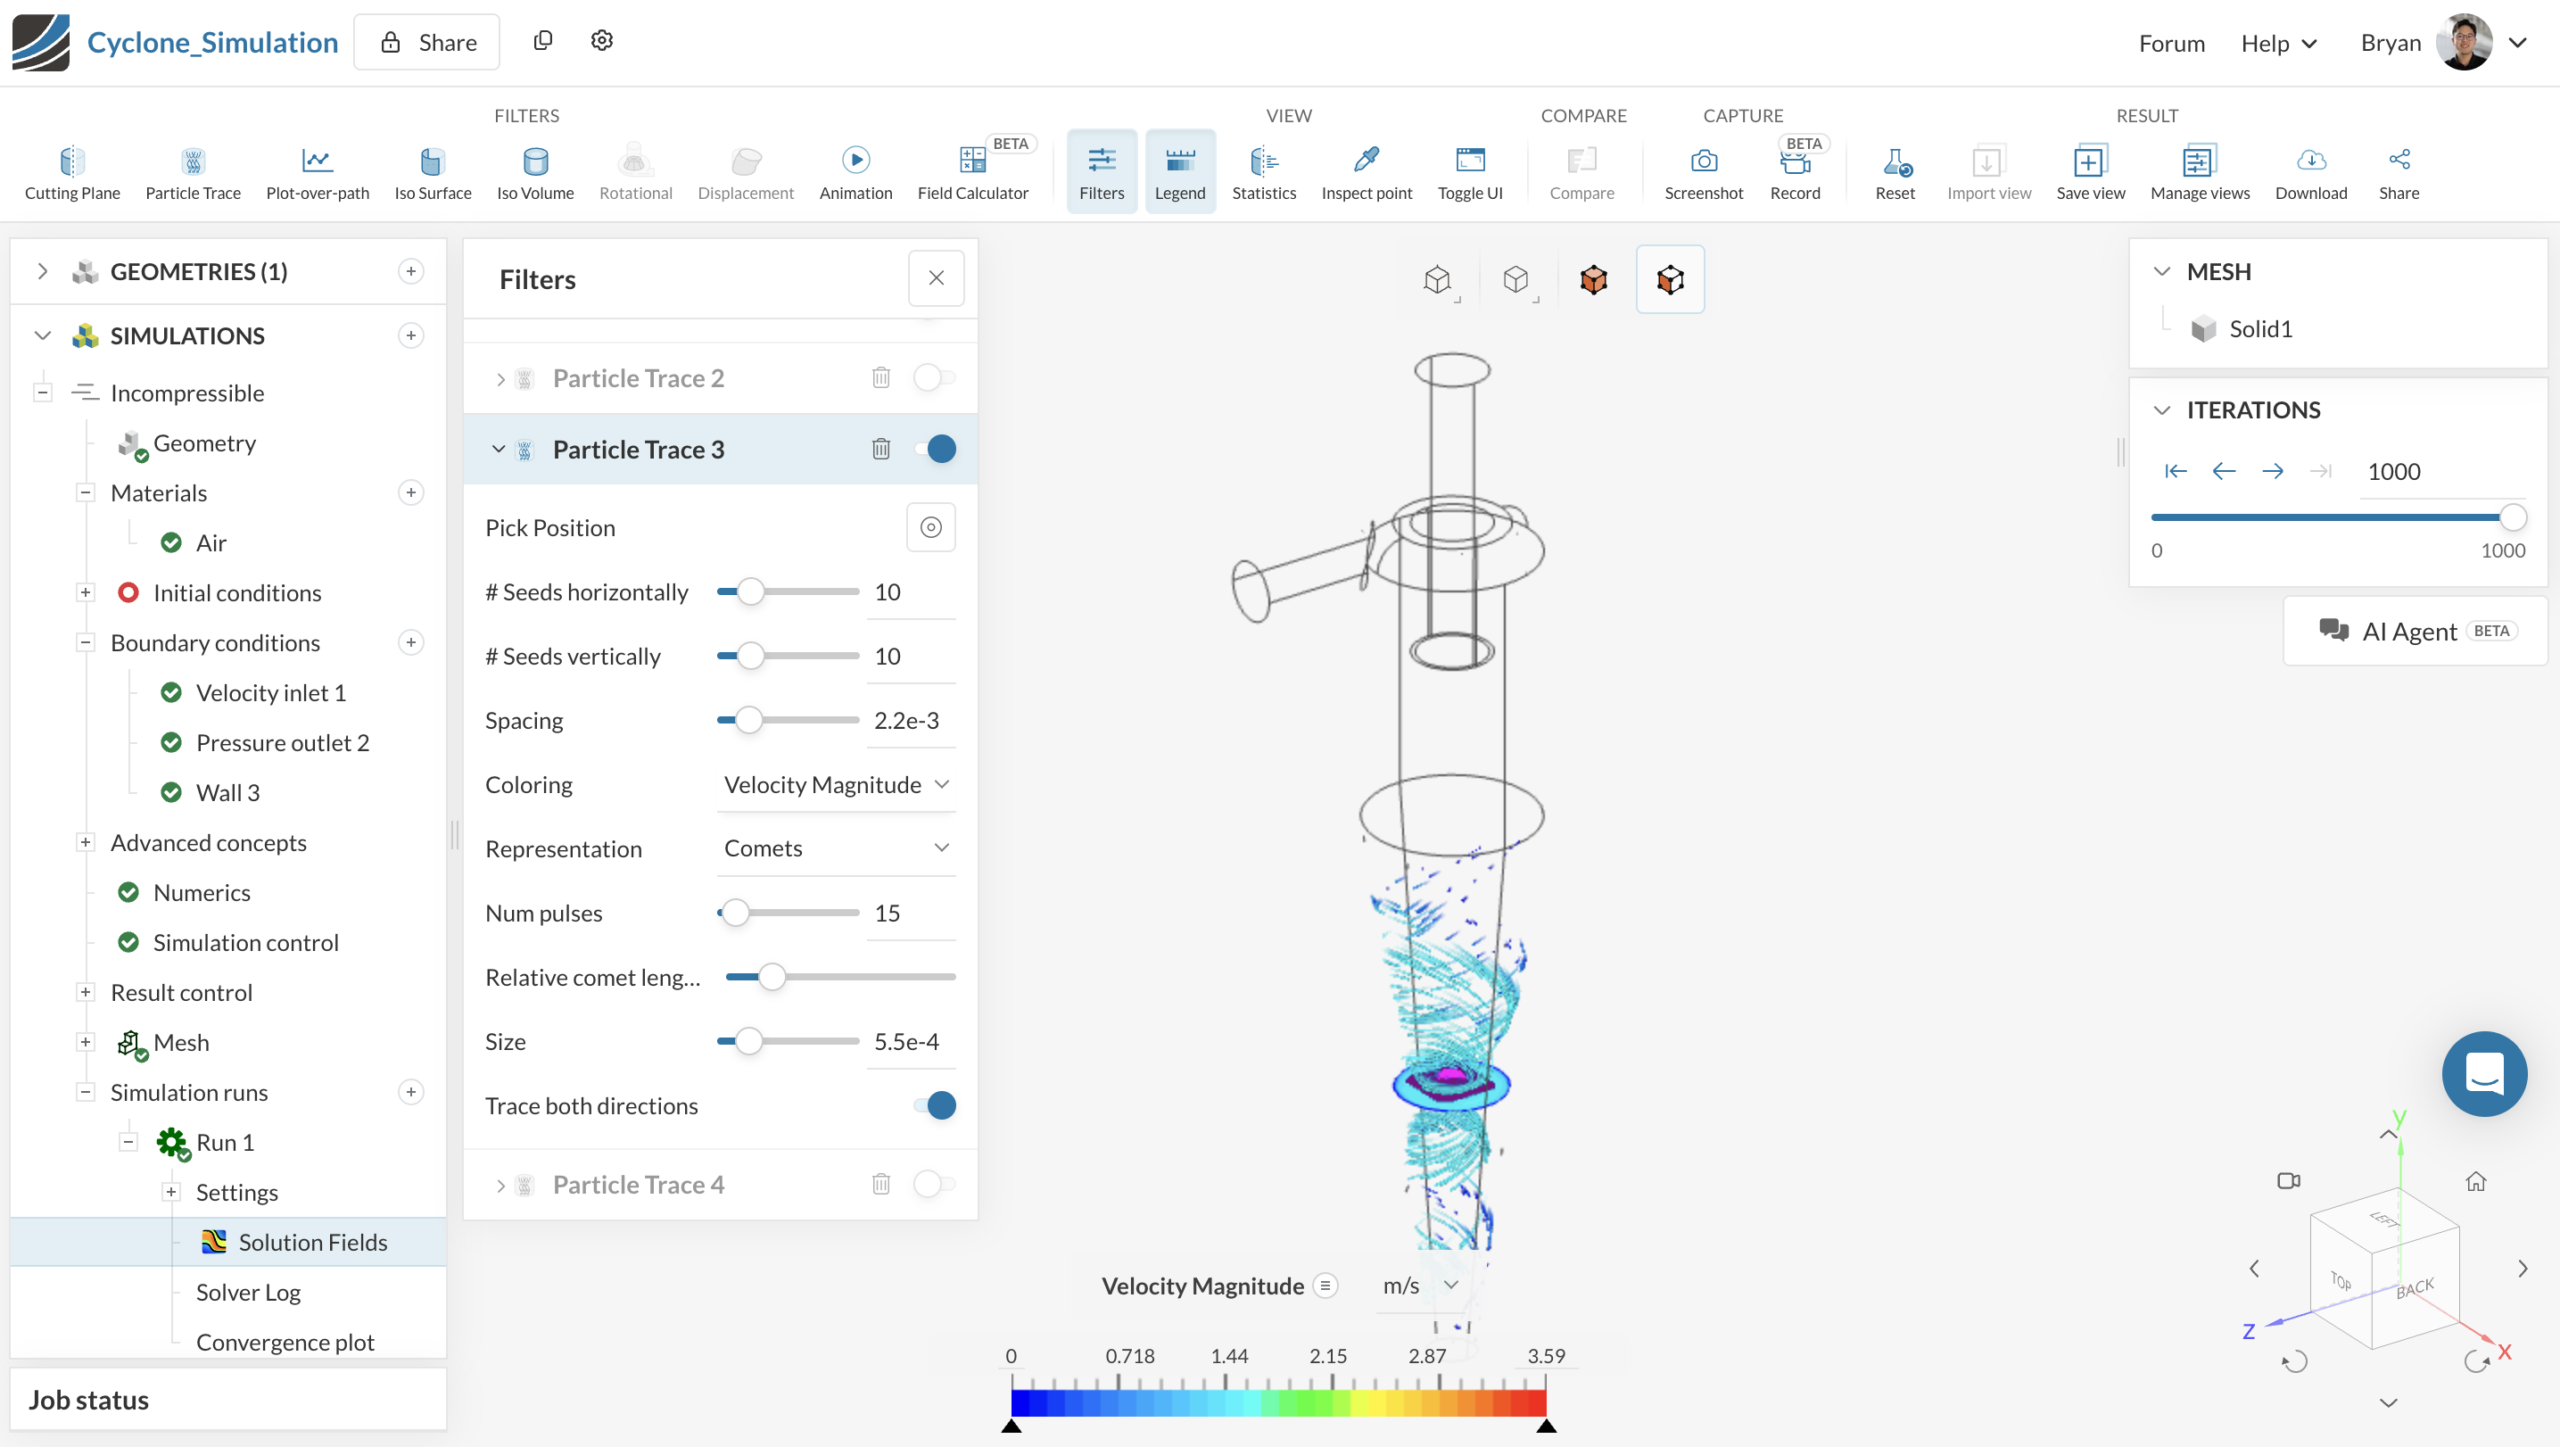
In the cyclone example below, a single particle trace captures only the upper portion of the swirling flow and does not fully represent the flow structure inside the cyclone. As shown in Video 1, the visualization becomes incomplete once the particle trace terminates during the animation.
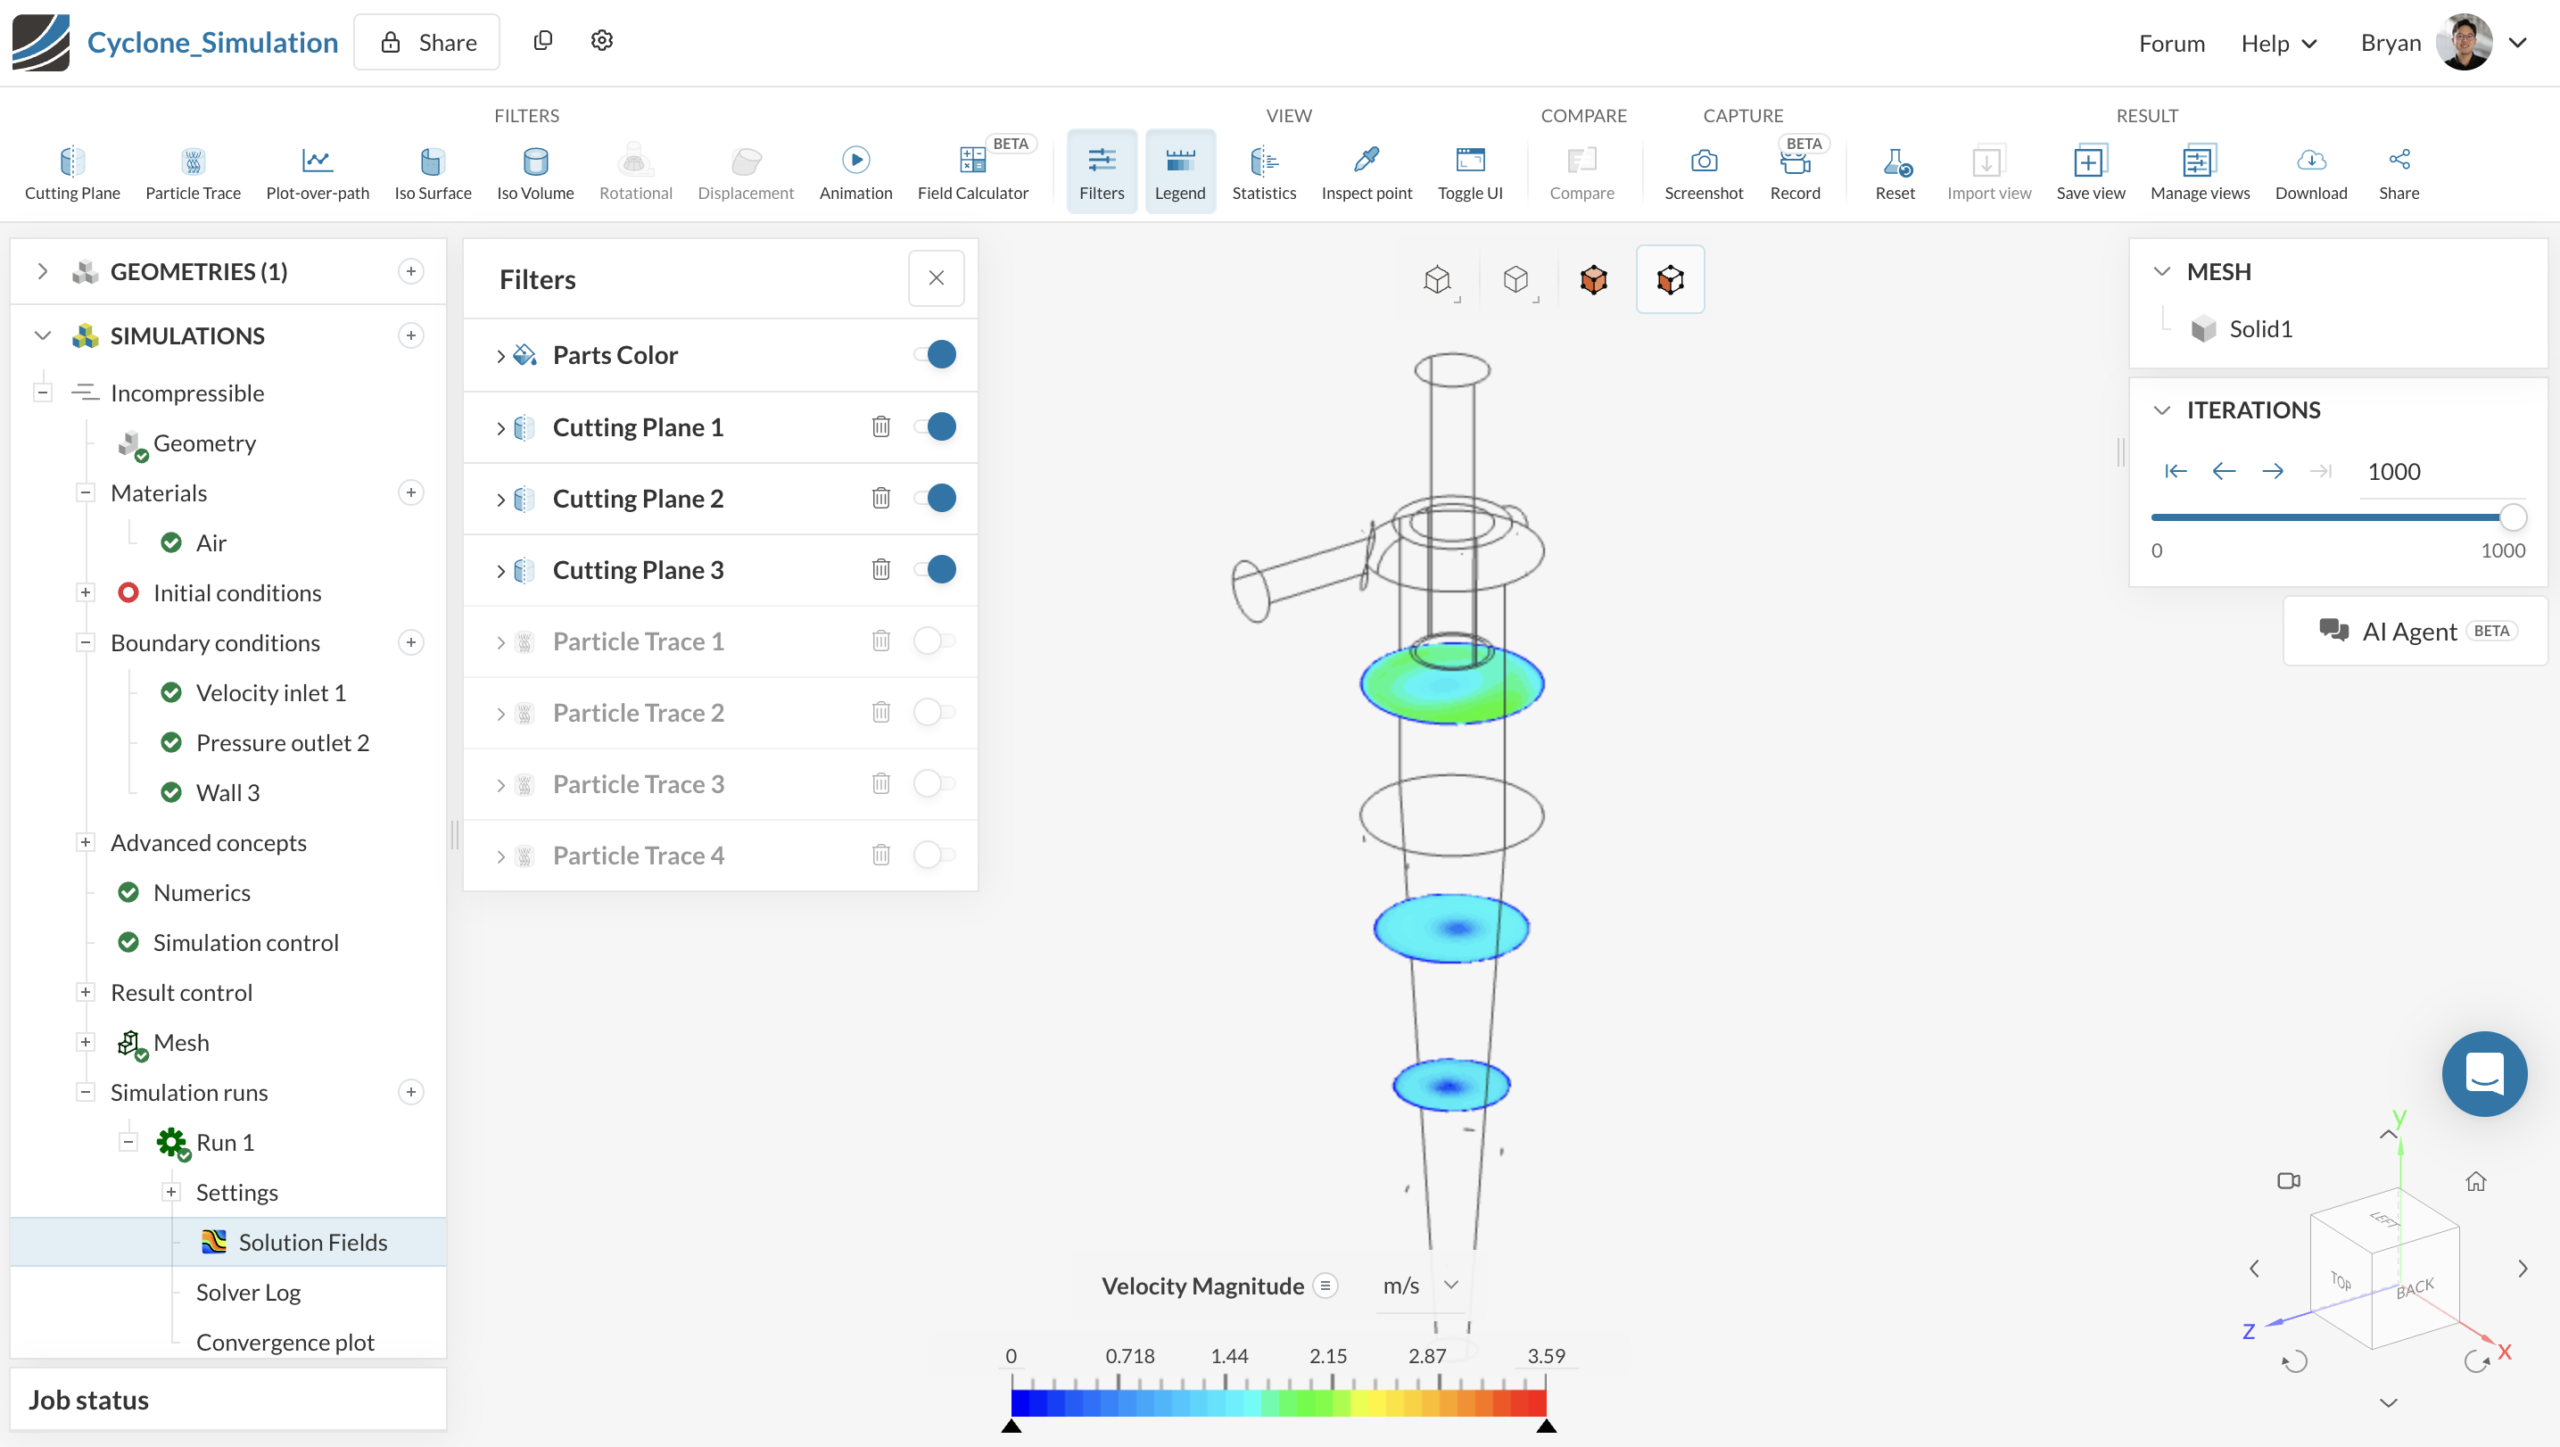
Step 2: Create cutting planes for new seed locations
After identifying where the initial particle trace begins to terminate, create one or more cutting planes in those regions. These planes act as seed locations for the additional particle traces and allow the visualization to continue from different positions inside the domain.
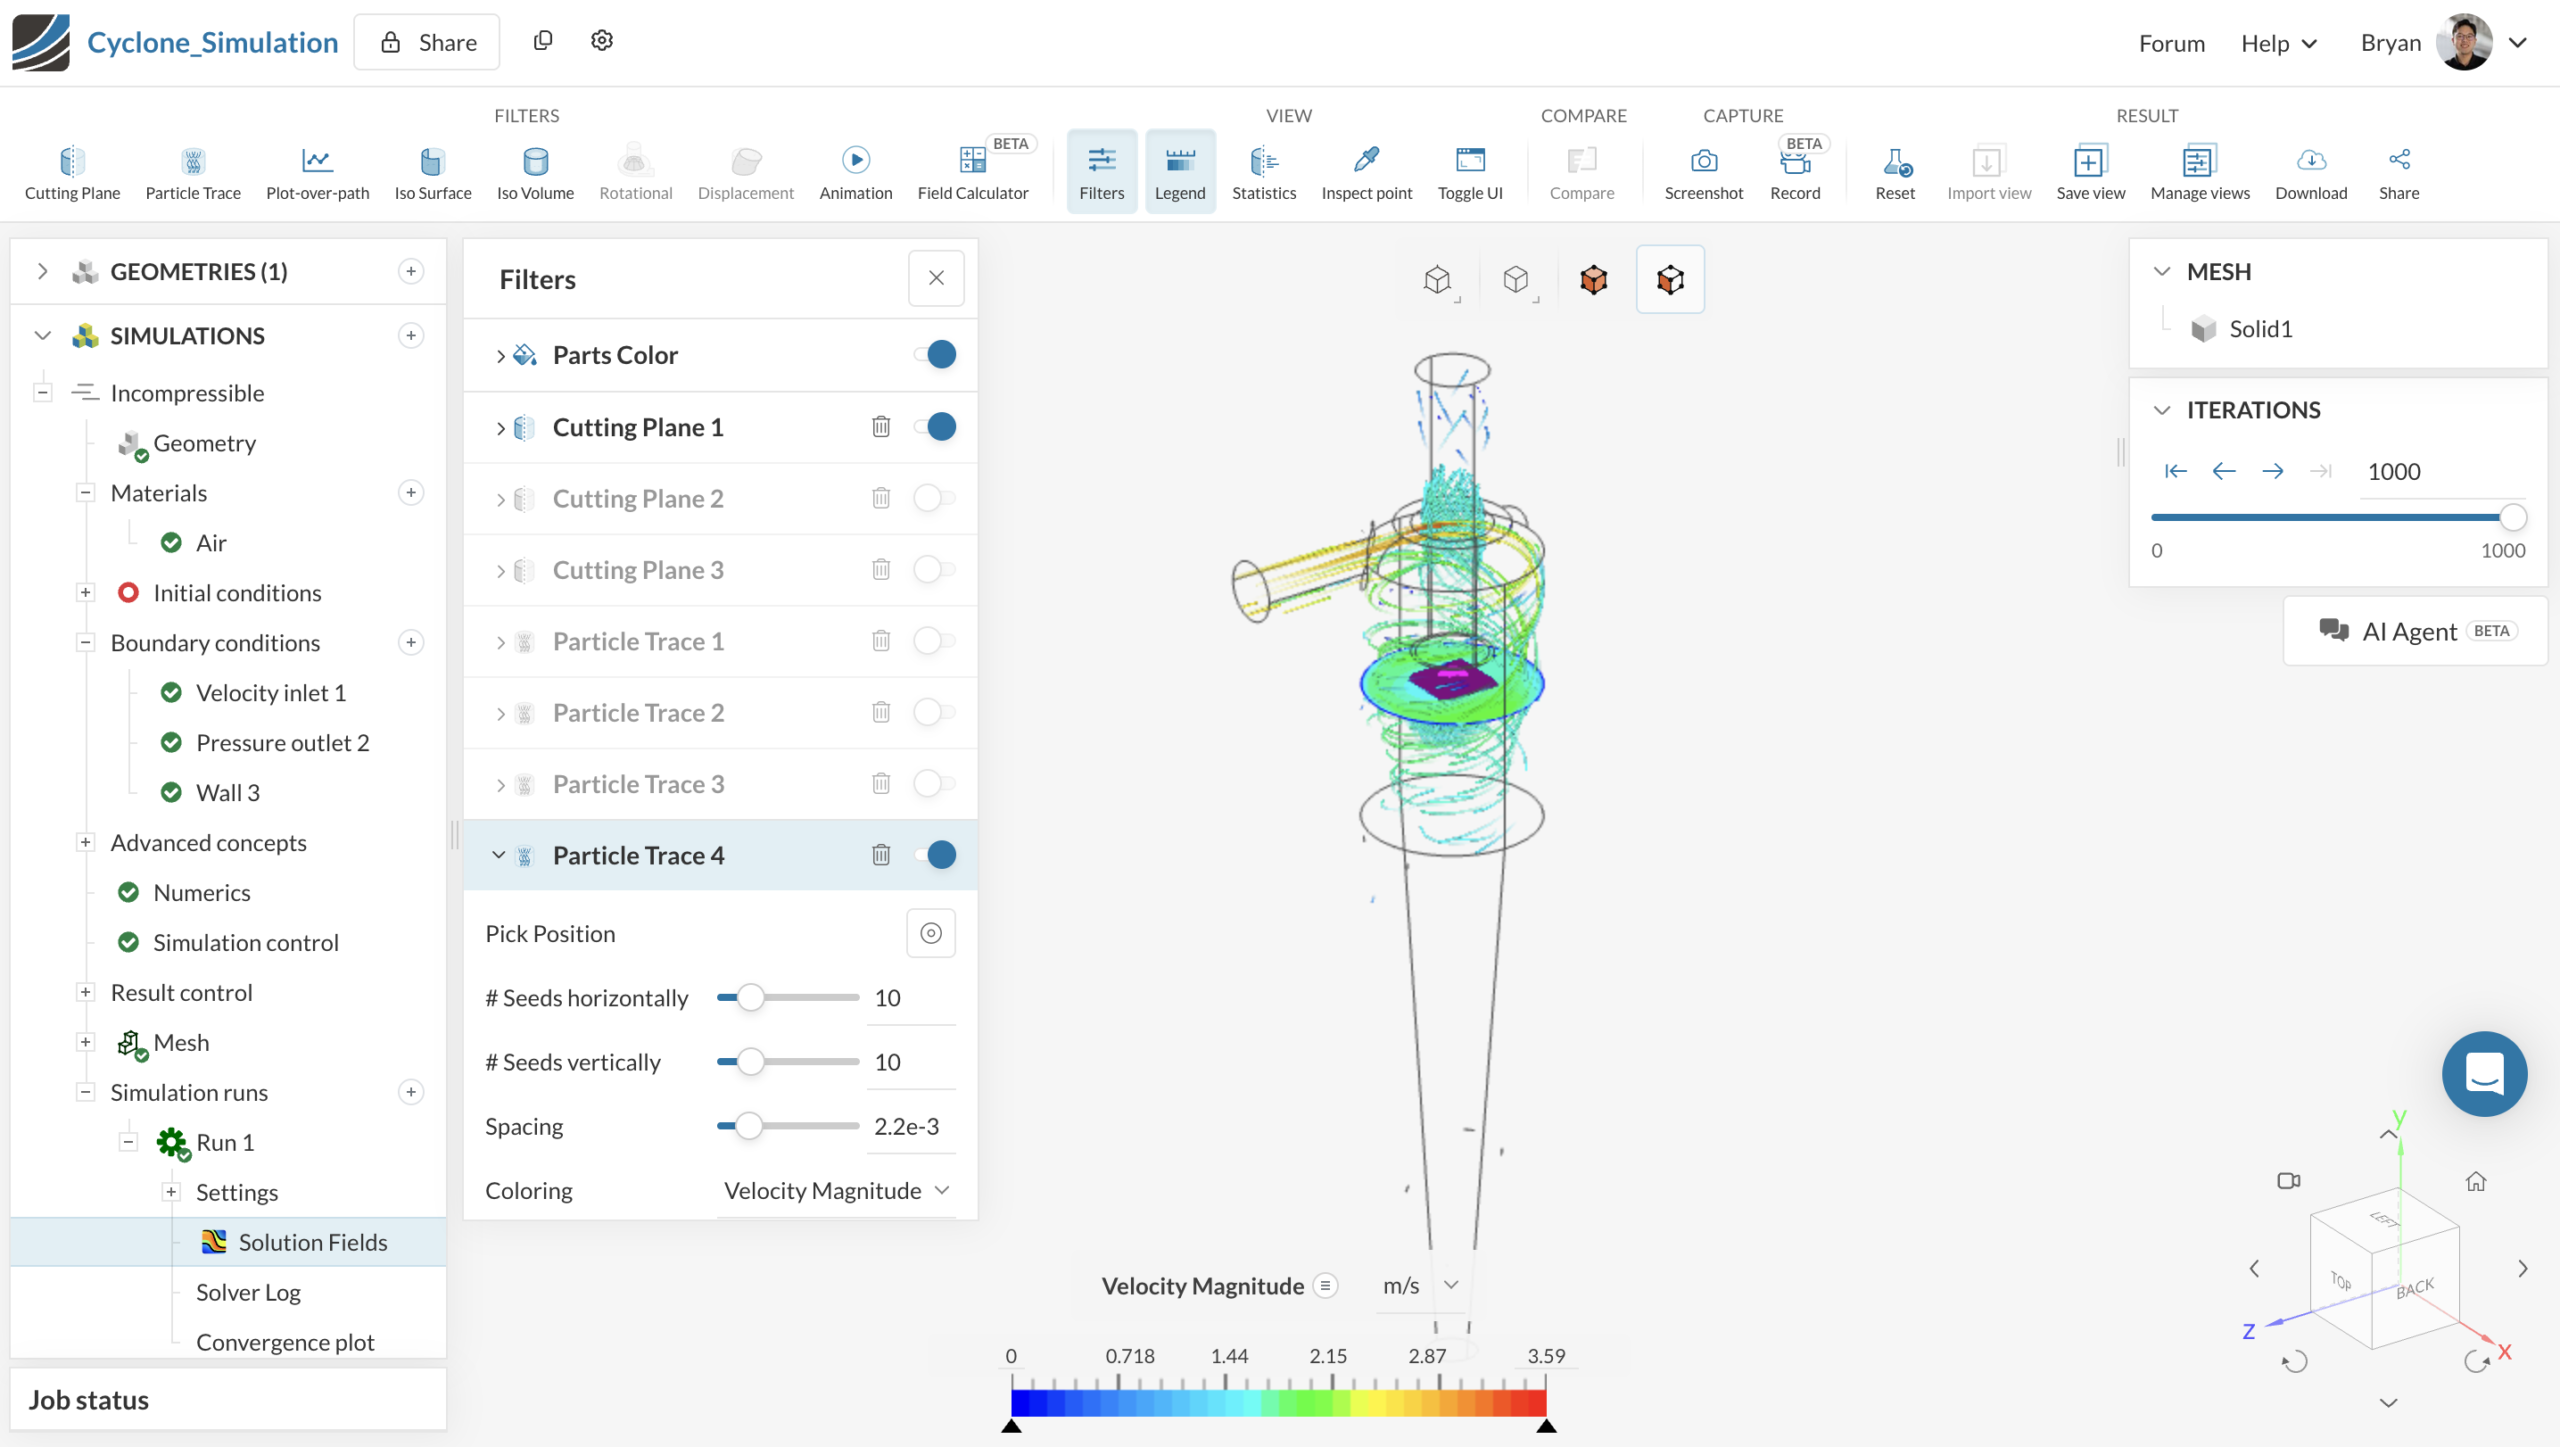
Step 3: Add particle traces from the cutting planes
Use the cutting planes as seed locations for new particle traces. Add the new traces in regions where the previous traces start to terminate. This helps continue the visualization through the remaining parts of the flow domain.
Each simulation may require a different number of particle traces. For complex swirling flows, add enough traces to capture the main flow structures clearly.
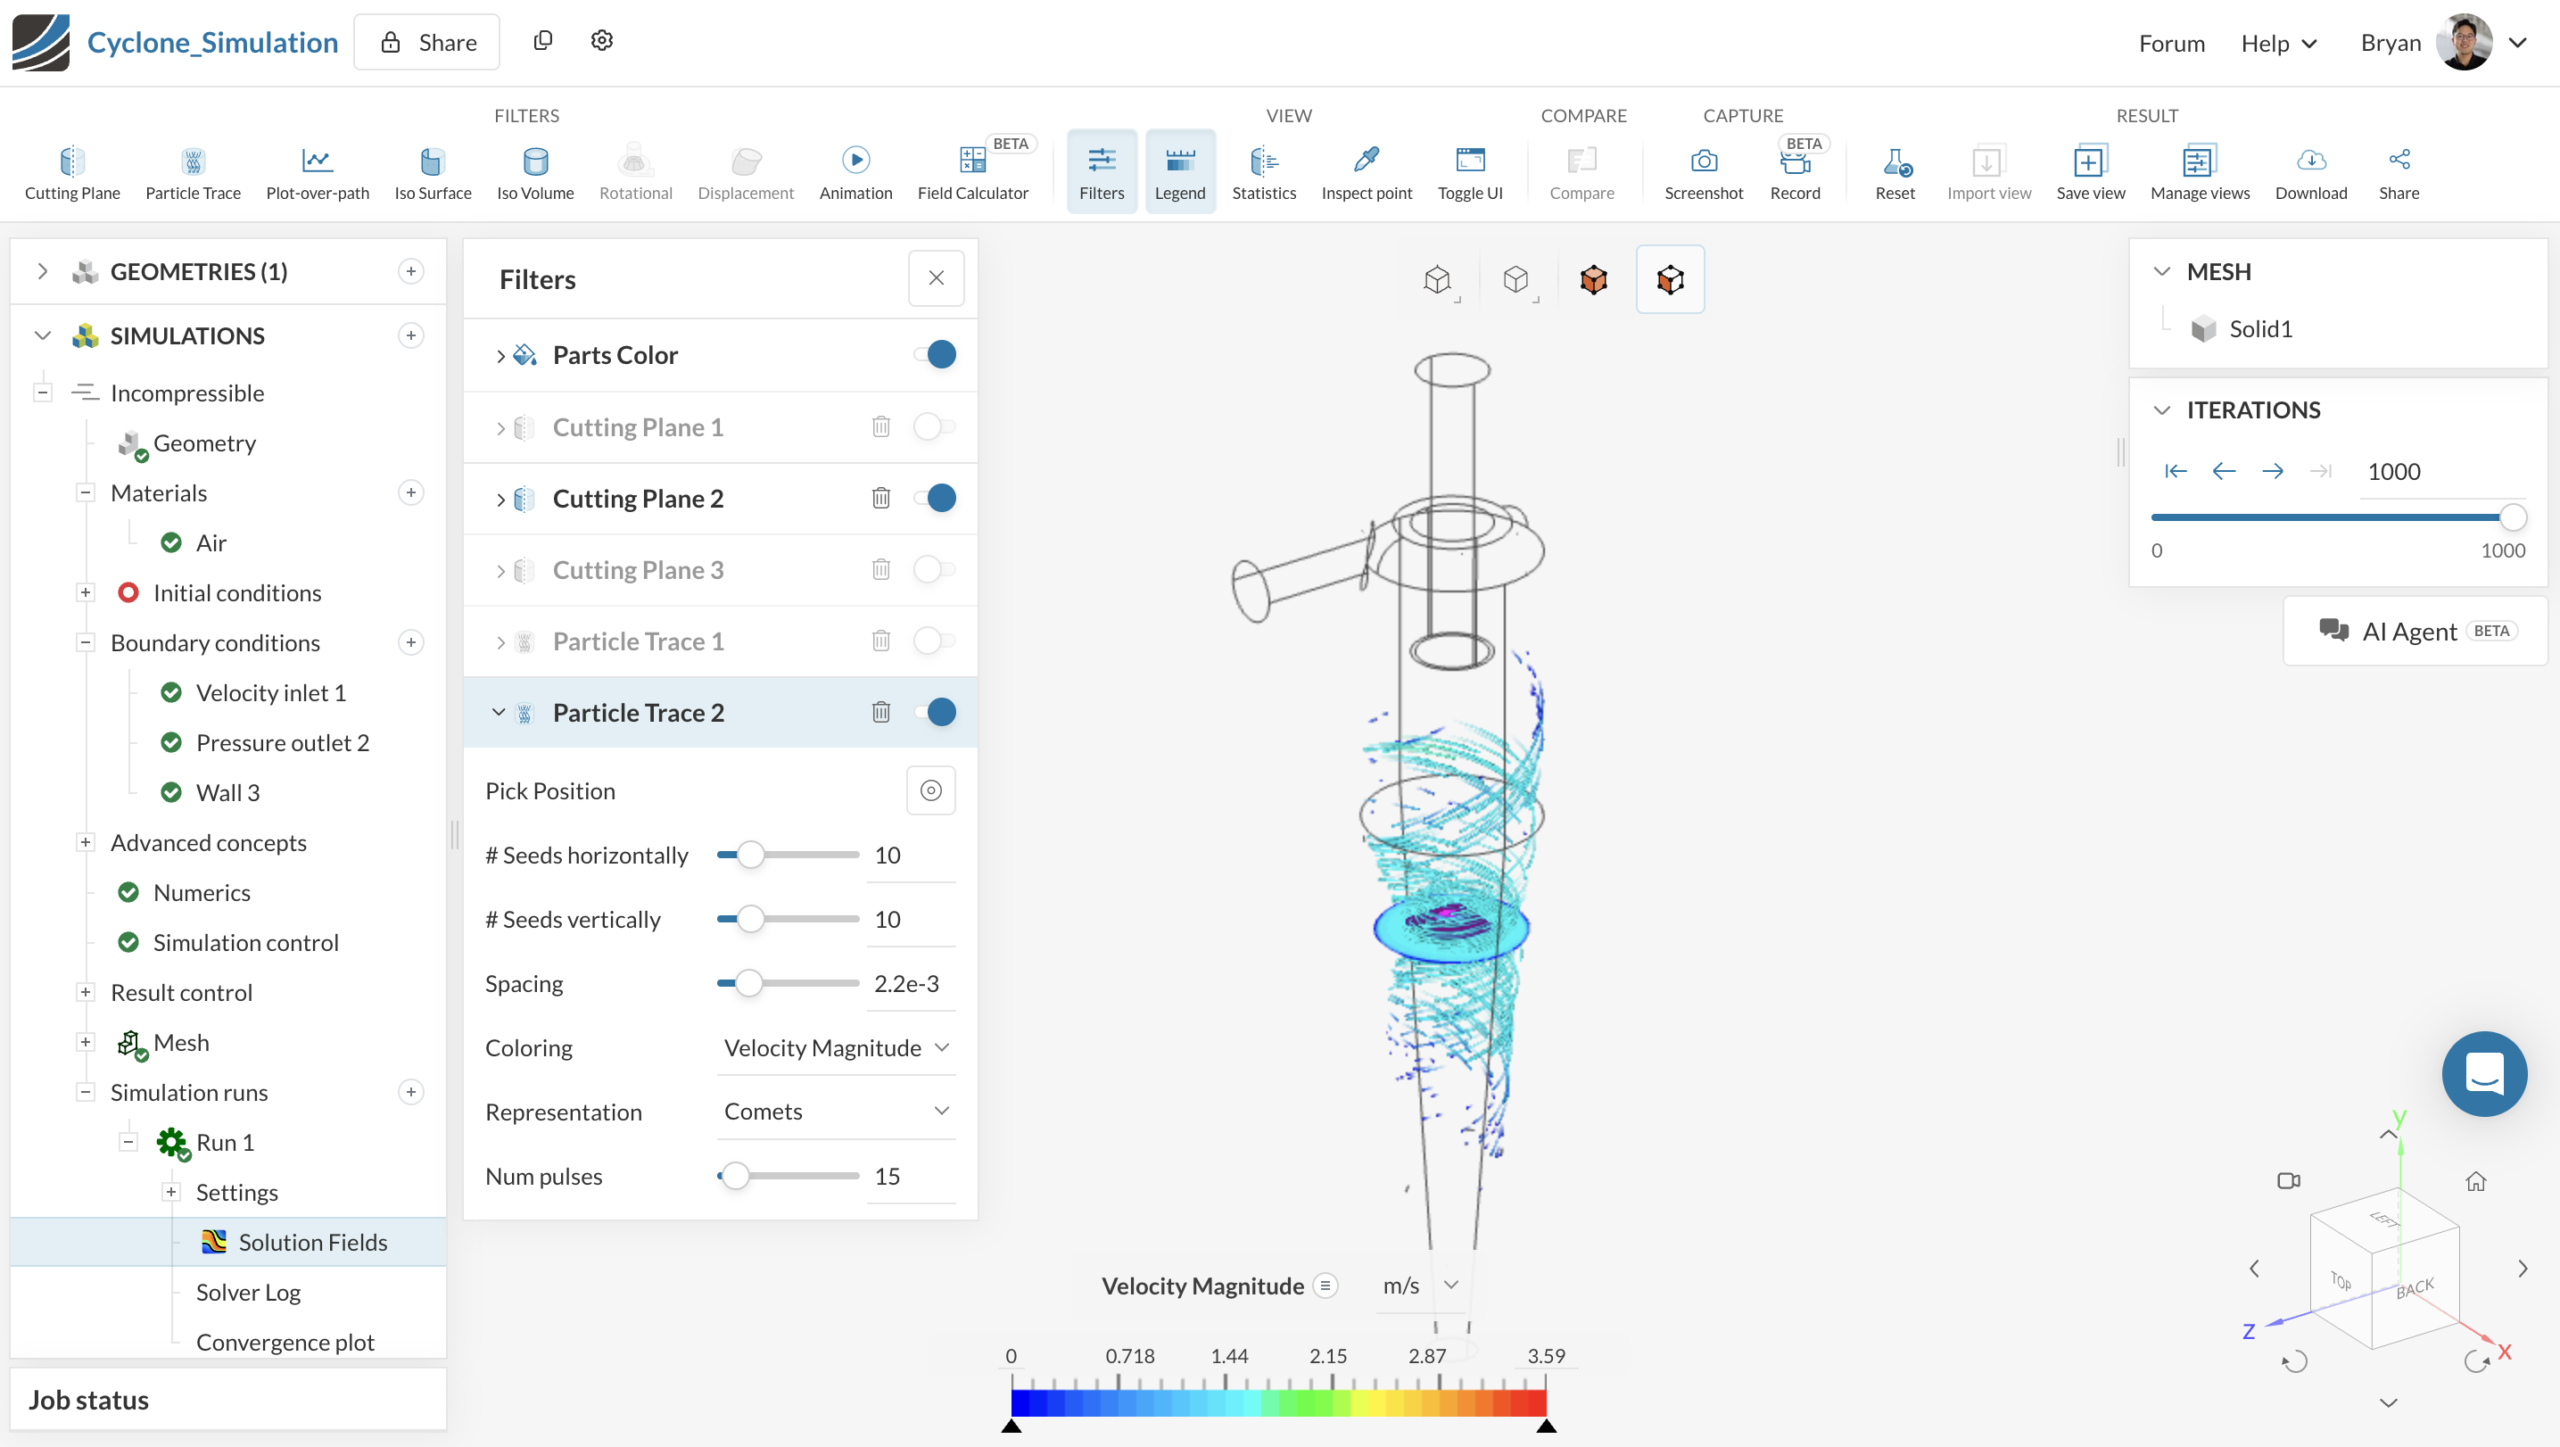
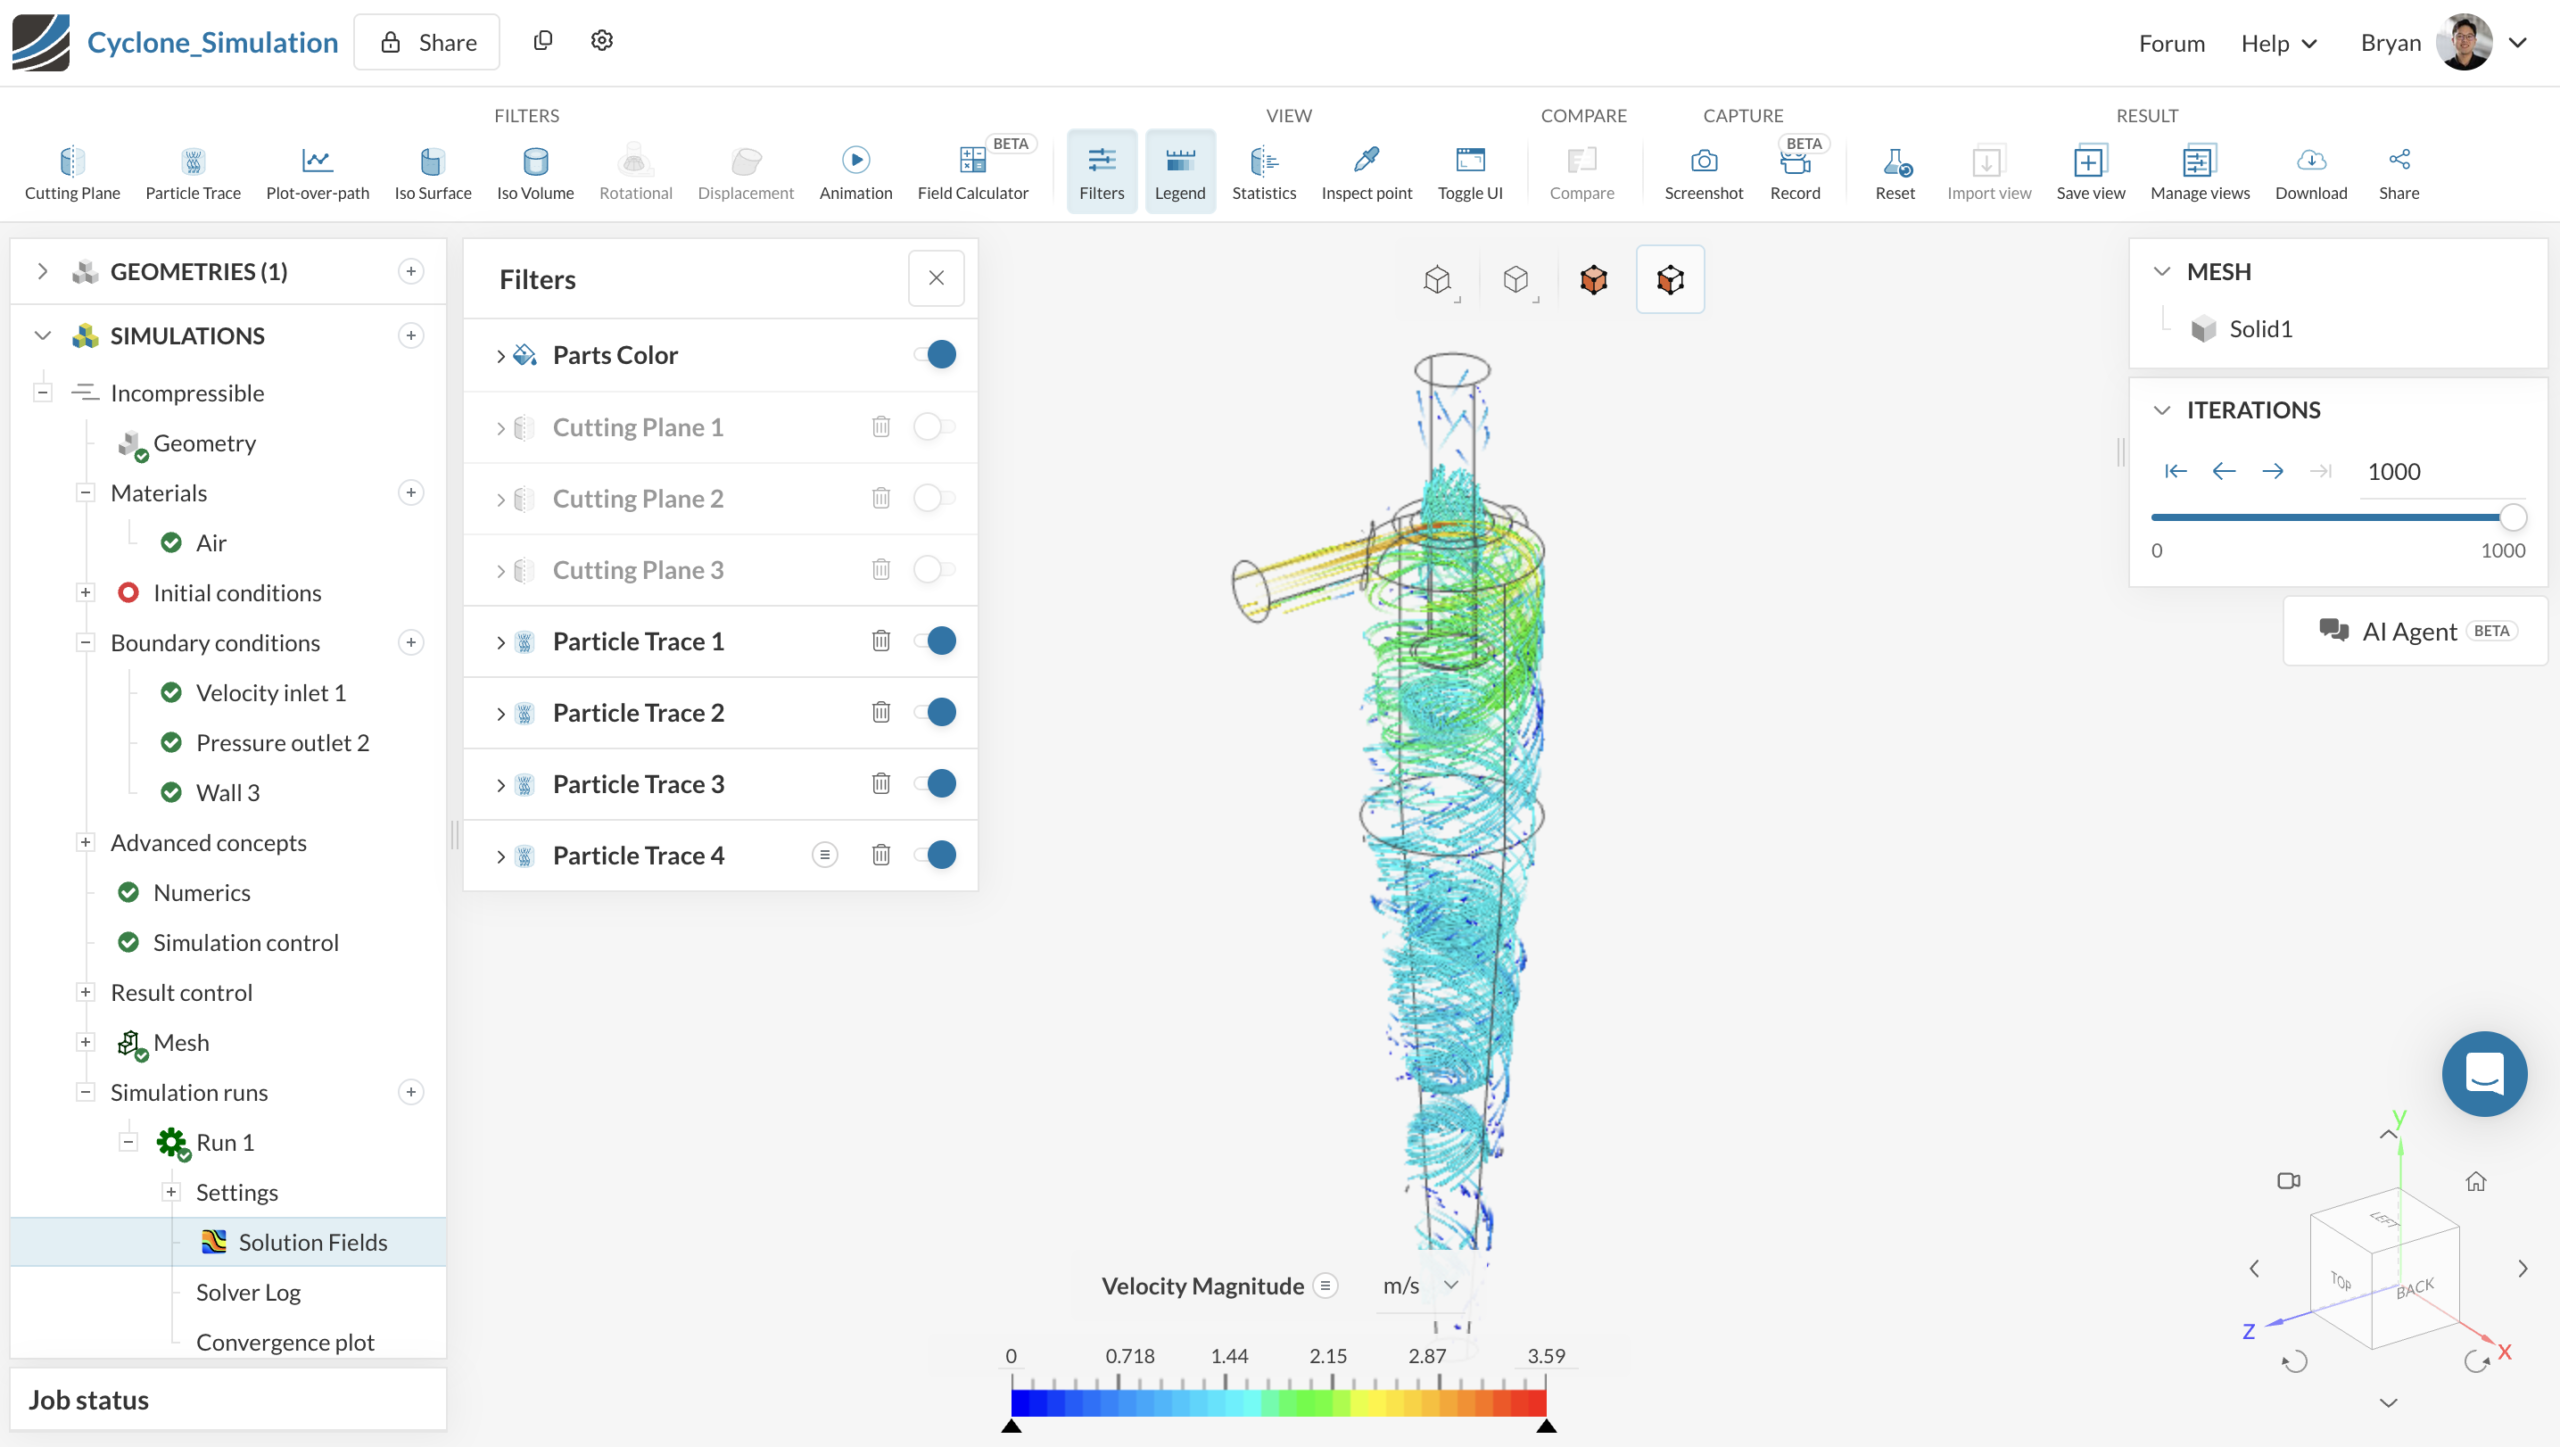
Step 4: Combine the particle traces and review the result
After adding the new particle traces, enable them together and check whether the main flow structures appear clearly. Focus on representing the important flow regions rather than using a fixed number of particle traces.
In this example, the combined particle traces show the swirling flow inside the cyclone more completely.
Summary
Particle trace placement depends on the simulation setup and flow behavior. Add extra particle traces only where needed, until the main flow structures appear clearly.
If particle traces still do not show the flow clearly after adjusting the seed locations, use other visualization methods such as cutting planes, streamlines, or iso volumes.
Note
If none of the above suggestions solve the problem, post the issue on the forum or contact the support team.


