PCB Parasitic RLC Extraction
This validation case demonstrates the accuracy of SimScale’s AC Magnetic and Electrostatics analyses for extracting parasitic RLC parameters from a printed circuit board (PCB) structure. Simulation results are compared against analytical data from a published reference and an independent electromagnetic simulation.
Simulation Overview
| Parameter | Value |
|---|---|
| Application | PCB parasitic RLC extraction |
| Analysis types | Magnetostatics (DC); Time-Harmonic Magnetics (AC); Electrostatics |
| Reference | Qian, J. (2003). RF Models for Active IPEMs. MS Thesis, Virginia Polytechnic Institute and State University [1] |
Geometry
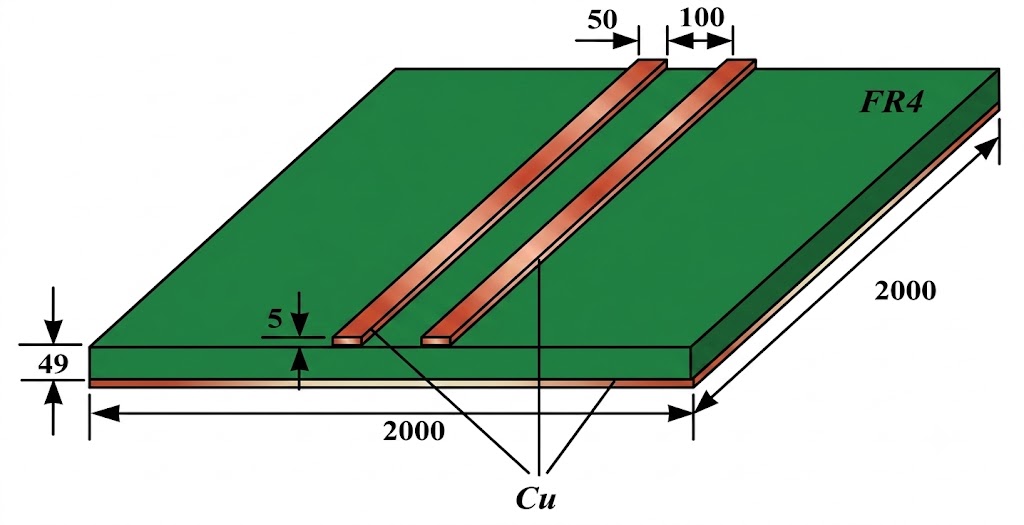
The PCB structure consists of two parallel copper traces routed on a square FR4 substrate, with a continuous copper ground plane on the opposite face. The geometry reproduces the test board described in Qian (2003), used in the original study to characterize parasitic resistance, inductance, and capacitance at frequencies from DC to \(1 \, \text{MHz}\).
Material Properties
| Material | Property | Value |
|---|---|---|
| Copper | Electrical conductivity \(\sigma\) | \(5.8 \times 10^7 \, \text{S/m}\) |
| FR4 substrate | Relative electric permittivity \(\varepsilon_r\) | \(4.4\) |
| Air | Relative electric permittivity \(\varepsilon_r\) | \(1.006\) |
| Ground plane | Thickness | \(5 \, \text{mils}\) |
Simulation Setup
Three analyses target the same PCB geometry, each extracting a different subset of parasitic parameters:
- Magnetostatics (DC): extracts DC resistance \(R_{DC}\) and loop inductance \(L_{DC}\) by driving each copper trace with a \(10 \, \text{A}\) solid coil excitation and computing the resulting magnetic field and resistive losses.
- Time-Harmonic Magnetics (AC): sweeps frequency from \(1 \, \text{kHz}\) to \(1 \, \text{MHz}\) and extracts AC resistance \(R_{AC}(f)\) and loop inductance \(L(f)\) at each frequency point using Resistance Sets result controls.
- Electrostatics: extracts the capacitance matrix between the copper conductors by applying unit potentials to each trace and solving for the charge distribution.
Note
At high frequencies, the skin depth in copper becomes very small (on the order of \(10^{-5}\)– \(10^{-4} \, \text{mm}\) at \(1 \, \text{MHz}\)). To keep the mesh tractable, the AC Magnetic simulation uses a reduced \(1/20\) section of the board; all results are scaled by a factor of 20 to recover full-board values.
Results
DC Resistance
The DC resistance follows directly from the trace geometry:
$$R_{DC} = \frac{\rho \, L}{A}$$
where \(\rho\) is the resistivity of copper, \(L\) is the trace length, and \(A\) is the cross-sectional area. The table below compares the SimScale Magnetostatics result against the reference.
| Parameter | Reference [1] | SimScale | Deviation |
|---|---|---|---|
| DC Resistance \(R_{DC}\) | \(5.4304 \, \text{m}\Omega\) | \(5.4304 \, \text{m}\Omega\) | \(< 0.01\%\) |
| DC Loop Inductance \(L_{DC}\) | \(50.742 \, \text{nH}\) | \(51.333 \, \text{nH}\) | \(+1.16\%\) |
Note
SimScale reports the full \(2 \times 2\) inductance matrix. The loop inductance is derived as \(L_{loop} = L_{11} + L_{22} – 2M\), where \(L_{11}\) and \(L_{22}\) are the self-inductances of each trace and \(M\) is the mutual inductance between them.
AC Resistance and Inductance
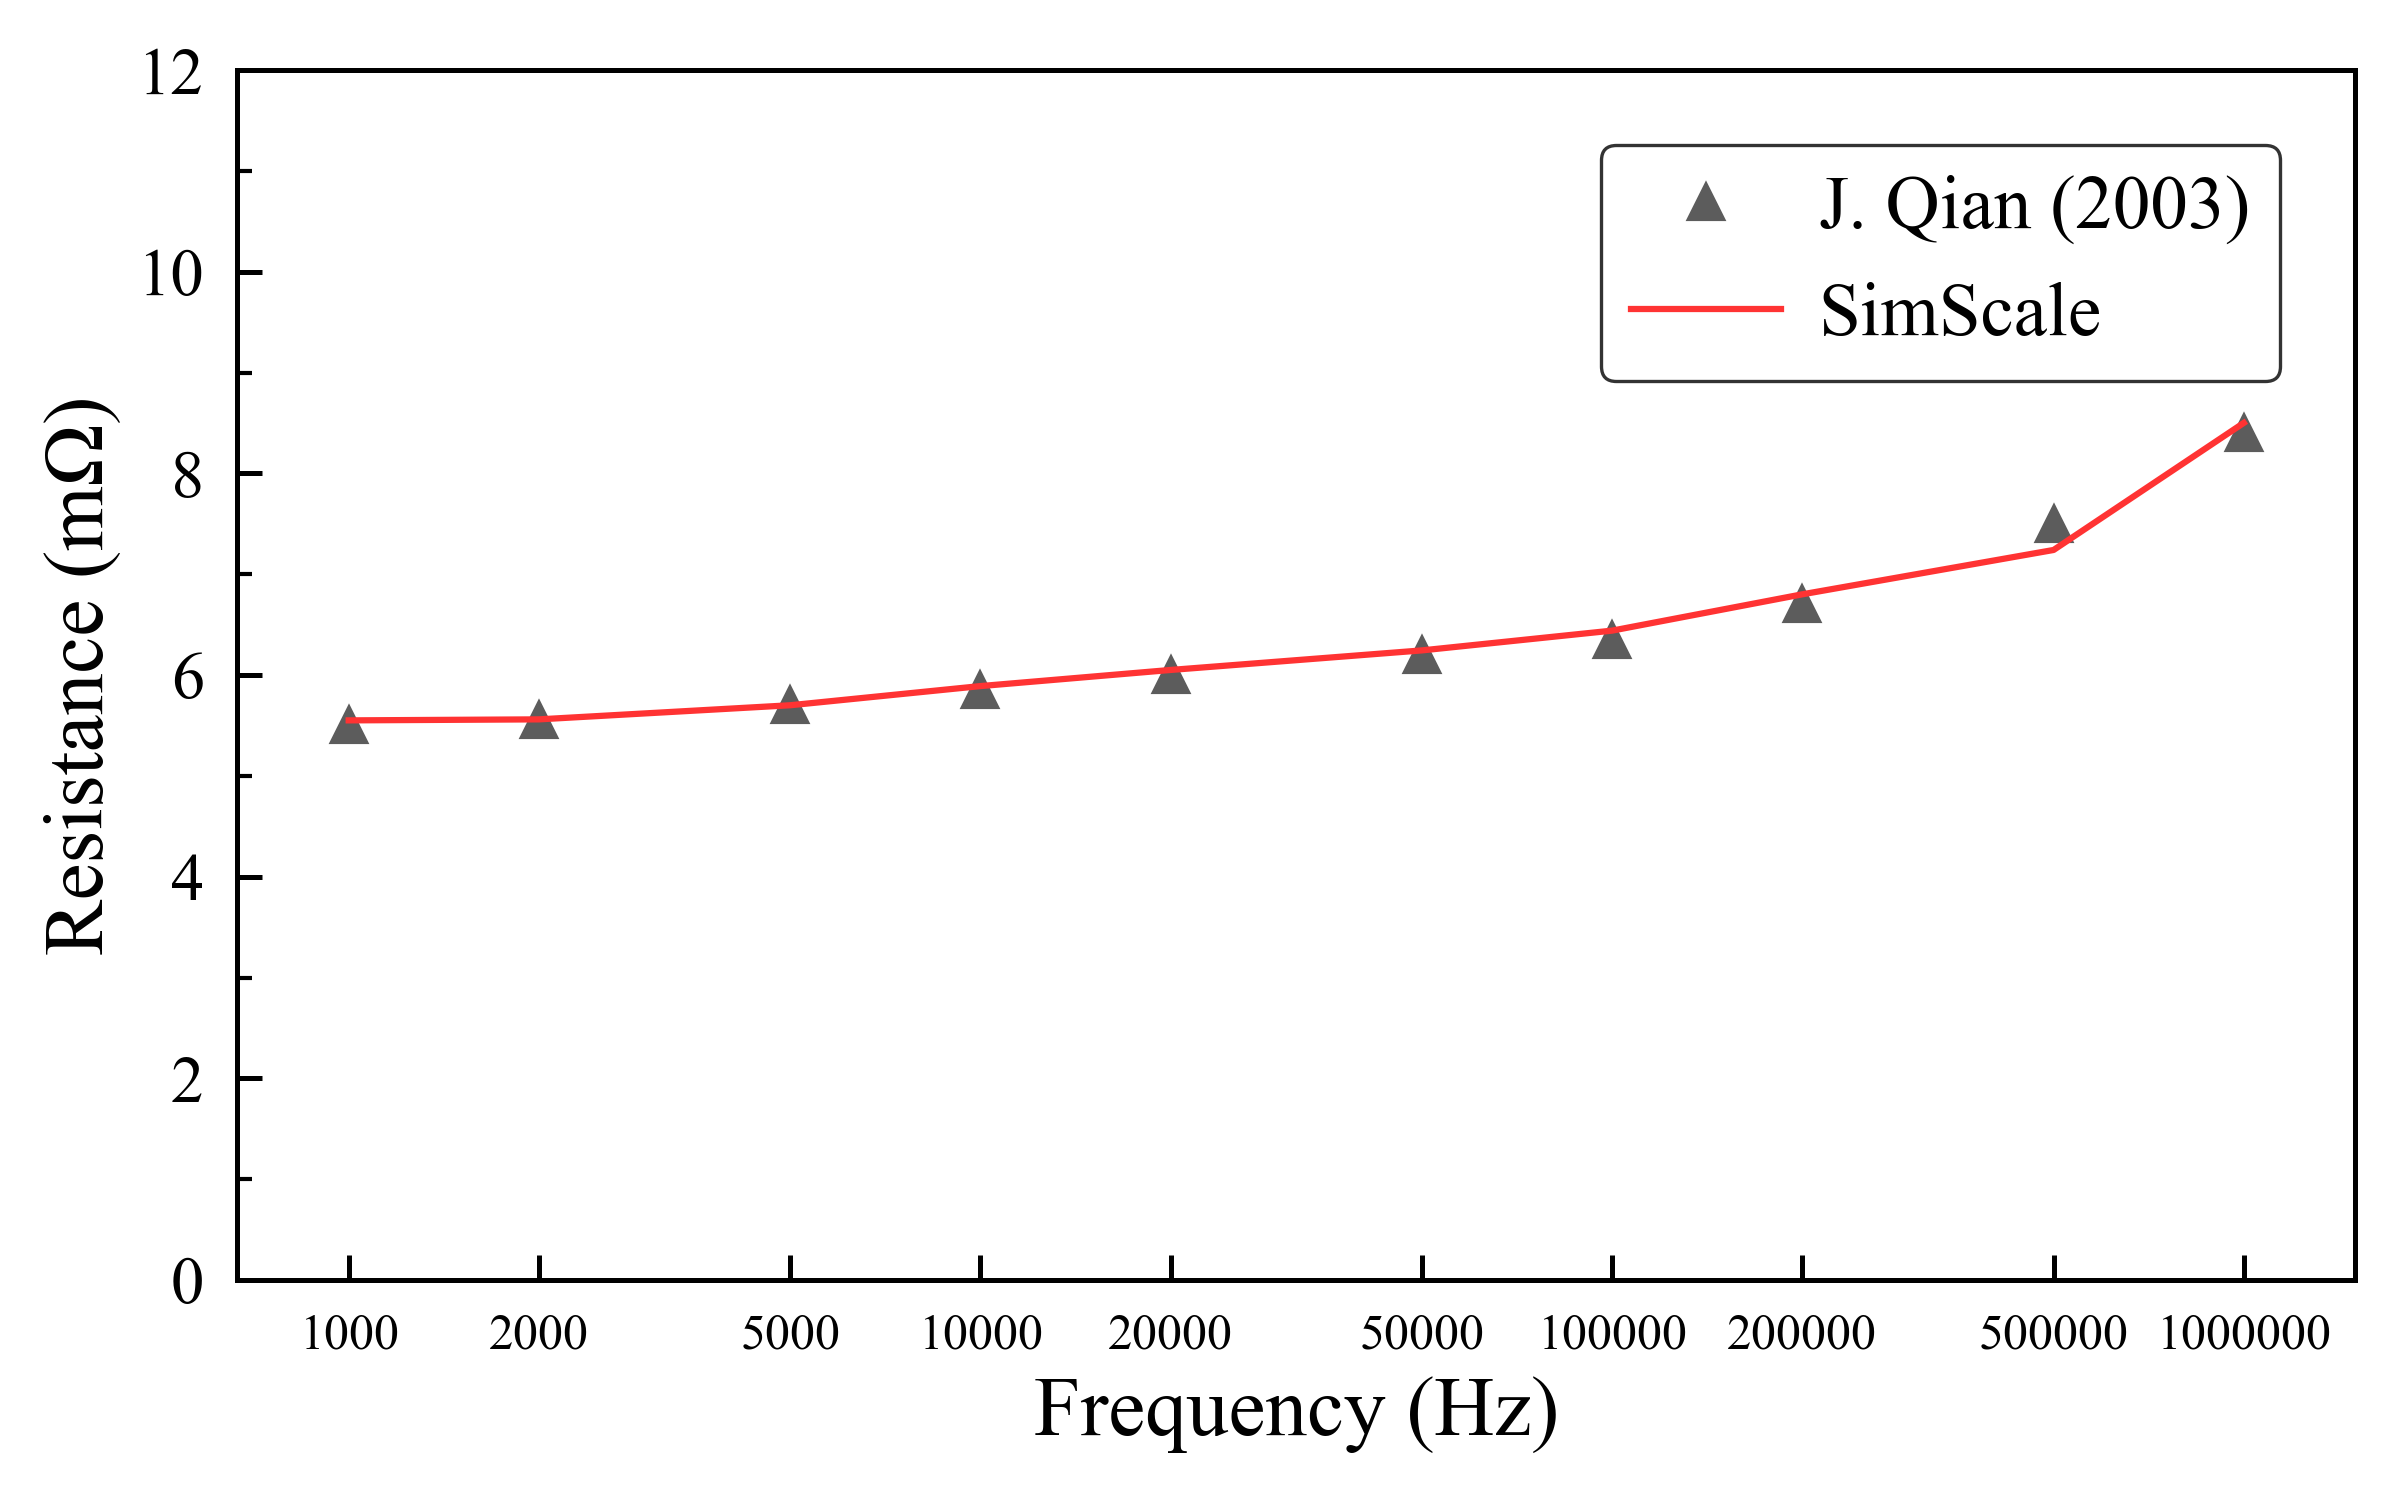
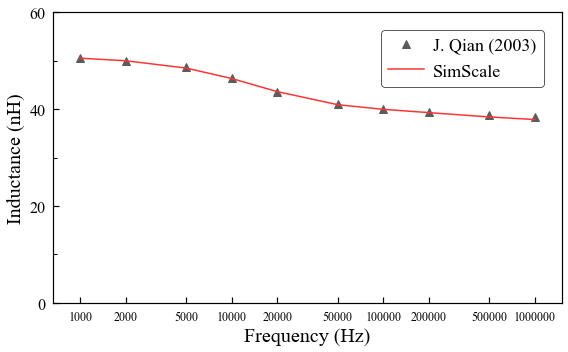
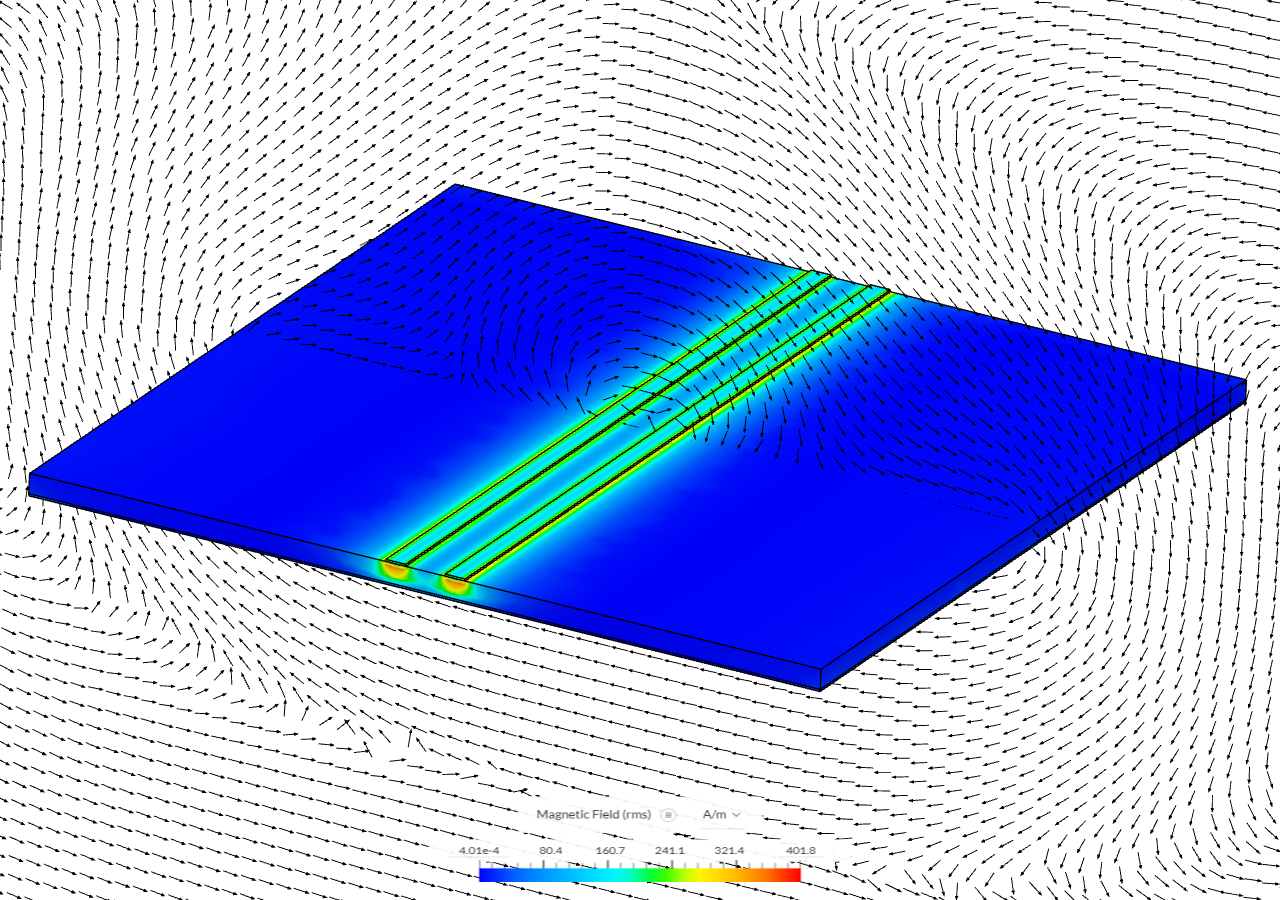
The AC Magnetic analysis sweeps frequency from \(1 \, \text{kHz}\) to \(1 \, \text{MHz}\). As frequency increases, the skin effect concentrates current in a thin layer near the conductor surface, increasing \(R_{AC}\) and reducing the effective loop inductance \(L(f)\). Both quantities are extracted from the Resistance Sets result control.
The skin depth \(\delta\) at angular frequency \(\omega\) is given by:
$$\delta = \sqrt{\frac{2}{\omega \, \mu_0 \, \sigma}}$$
Capacitance
The electrostatic analysis extracts the capacitance matrix between the copper conductors. Three values are reported: each trace to the ground plane, and the mutual capacitance between the two traces. Negative off-diagonal entries in the Maxwell capacitance matrix indicate coupling between conductor pairs.
| Parameter | Reference [1] | SimScale | Deviation |
|---|---|---|---|
| Left trace to ground plane | \(-4.3047 \, \text{pF}\) | \(-4.4143 \, \text{pF}\) | \(+2.55\%\) |
| Right trace to ground plane | \(-4.3046 \, \text{pF}\) | \(-4.4143 \, \text{pF}\) | \(+2.55\%\) |
| Between the two traces (coupling) | \(-0.1673 \, \text{pF}\) | \(-0.1589 \, \text{pF}\) | \(-5.0\%\) |
Note
Capacitance values are reported as negative off-diagonal entries of the Maxwell capacitance matrix, following the sign convention used in Qian (2003). The magnitude represents the coupling strength between the respective conductor pair.
References
Last updated: August 4th, 2026
Did this article solve your issue?
How can we do better?
We appreciate and value your feedback.