Documentation
A stress-strain curve defines how a material behaves under load, which provides insights into the material’s strength, stiffness, ductility, and failure limits. For example, a glass marble dropped to the ground would shatter immediately into pieces, while a rubber ball would return to its original shape after the impact. This difference in material behavior between a glass marble and a rubber ball can be completely explained by stress-strain curves.
The way in which a solid body deforms due to a load is a consequence of its material properties. This usually leads to a common question: Why not define the material properties based on a force-displacement relationship? Why do we instead use a stress-strain relationship?
This stems from the fact that force and displacement are extrinsic properties of the material. The force needed to deform a material to a certain extent is dependent on the amount of material present. Thus, it is impractical to characterize a material based on a force-displacement relationship as that would not provide a constant mechanical property.
On the other hand, stress and strain are the intrinsic material-property counterparts of force and displacement. For example, a 10mm diameter steel bar can carry the same stress in tension as a 10 cm diameter one.
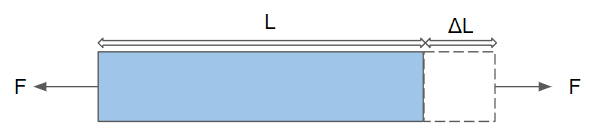
When an external load (F) is applied to a component in equilibrium consisting of a continuous and deformable material, the component is going to deform. The material will then try to resist this deformation by developing some internal forces equal but opposite to the external loads in its effort to maintain equilibrium.
Assuming a uniform distribution of the external force throughout the body, then there is a portion of the external force (F) that runs through any cross-sectional area (A) of the body and an internal force (F’) that opposes this external action. This internal force in any given cross-section is known as “Stress” and can be expressed as:
$$\sigma = \frac{F}{A}$$
Now, under external loading, the internal particles of the material tend to deform. The need for measuring this deformation and normalizing it for any given body shape led scientists to come up with a non-dimensional strain. Which is a quantity describing the relative deformation with respect to the undeformed shape.
The strain of an element with an original length L and a change of length \(\Delta\)L is defined as:
$$\epsilon=\frac{\Delta L}{L}$$
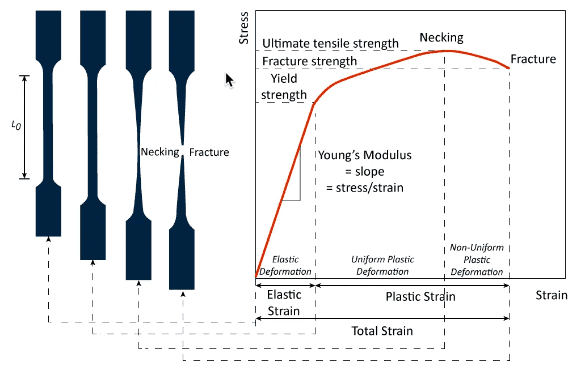
It is typically measured by a destructive tensile test in which the load is applied gradually to a test specimen until failure. During this process, there are multiple properties that are measured directly. These are:
Making use of the above-measured properties, one could also identify the following information about a material:
The video below illustrates a tensile test application on a steel sample in order to quantify the stress-strain relationship. It also shows a comparison between the tested samples and the sample in its original state. The aim here is to provide a qualitative understanding of the final elongation.
Moreover, figure 3 demonstrates an outcome of a test performed on a ductile material. It highlights the stages that the test sample experiences leading to fracture. Further information on the stages of a stress-strain curve is provided in the following sections of this article.
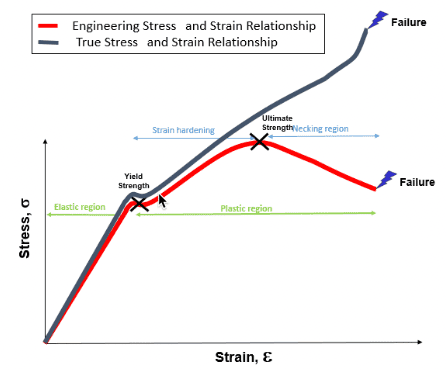
Stress-Strain curves can be classified into two categories depending on the choice of the cross-sectional area measured during a tensile test. For engineering purposes, it is commonly assumed that the cross-sectional area of the material remains constant during deformation. Implying that at any load the engineering stress is the applied load divided by the initial cross-sectional area.
Further on, the engineering stress reaches a maximum at the ultimate tensile strength which occurs at an engineering strain that is equal to uniform elongation. This is well depicted in the figure above. Afterward, the process of necking starts, and the engineering stress decreases as the strain increases, until finally, fracture occurs.
As seen in figure 3 above, the cross-sectional area shrinks as the test sample is elongated during the tensile test. Taking this into account yields an accurate representation of the stress-strain relationship of a material. In which the stress does not drop after exceeding the ultimate tensile stress level. To obtain the true stress of a material, the load being applied should be divided by the instantaneous cross-section area.
Deriving from the explanation above, figure 4 below enforces the difference between a true vs engineering stress-strain curve in a qualitative manner.
The relationship between engineering and true stress-strain properties is summarized in the table below:
| Parameter | Engineering | True |
| Stress | $$\sigma_e=\frac{F}{A_0}$$ | $$\sigma_t=\frac{F}{A_t}$$ |
| Strain | $$\epsilon_e=\frac{L-L_0}{L_0}$$ | $$\epsilon_t=\ln \left(\frac{A_0}{A_i}\right)=\ln \left(\frac{L_0}{L_i}\right)$$ |
| Where: | \(\sigma_e\) = engineering stress \(\sigma_t\) = true stress F = force applied A0 = initial cross-sectional area Ai = instantaneous cross-sectional area \(\epsilon_e\) = engineering strain \(\epsilon_t\) = true strain L0 = initial gauge length Li = instantaneous gauge length L = deformed gauge length |
In general, the true stress-strain relationship provides a more realistic representation of how a material behaves under loading. Hence, it is often preferred in numerical simulations. One can convert an engineering stress-strain curve to a true one using the following formulations:
$$\sigma_t=\sigma_e \left(1+\epsilon_e\right)$$
$$\epsilon_t=\ln \left(1+\epsilon_e\right)$$
The stages as seen in figure 3 above can be addressed as follows:
1. The stress-strain relationship is linear in the elastic regime. In this stage, the material always returns to its original position after the removal of the load. In addition, stress and strain are proportional to each other as the material obeys Hook’s law in the elastic regime. The slope of the linear line defines an important property of a material which is known as Young’s Modulus or Modulus of Elasticity.
$$E=\frac{\sigma}{\epsilon}$$
2. As the load increases the material behavior transitions from an elastic to a plastic regime. The stress at which this transition occurs is called yield stress. At any point past the yield stress, the material deformation becomes permanent. In simple terms, elastic strains are recoverable but plastic strains are not.
a. Identifying the point of yield is not always obvious, therefore a valid and conventional approximation is to offset the linear slope by 0.2% strain. The intersection point with the stress-strain curve defines the yielding point.
b. After yielding the material undergoes strain hardening or work hardening, which results in the material becoming stronger as it deforms. This is essentially the reason why the stress-strain curve increases past the yield stress until it reaches a maximum at the ultimate tensile stress, which is also the onset of necking.
3. During the process of necking the material experiences a non-uniform plastic deformation. Where one part of the sample becomes thinner, leading to very high-stress concentrations in that area which results in a fracture. After the fracture, percent elongation and total reduction in cross-sectional area can be calculated. It is worth noting that during the necking stage, the true stress keeps on growing while the engineering stress decreases since the shrinking area is not considered.
a. The strain at the fracture point quantifies the total elongation of a specimen. Where the degree of elongation indicates how ductile a material is. Materials with high ductility can withstand much higher plastic deformations. Whereas materials with fracture strains that occur near the yield point are considered to be brittle materials.
Stress-strain curves vary significantly among different materials and material families. They are mainly classified into two broad categories which are ductile and brittle materials. Figure 5 below illustrates the difference between the two.
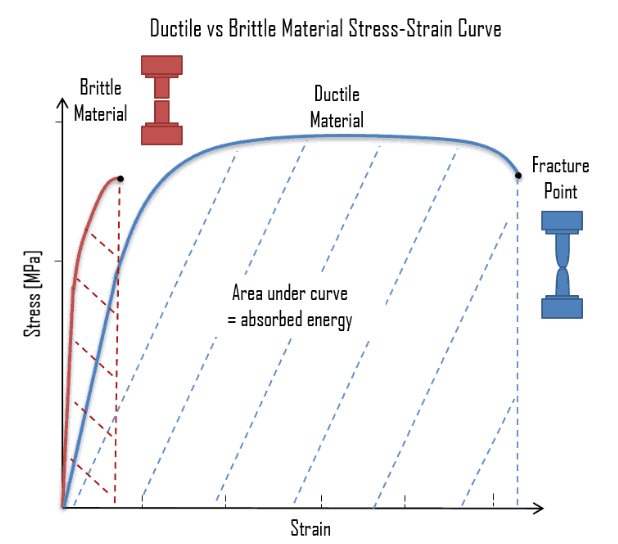
Ductile materials can absorb a significant amount of energy through the ability to yield. This permits the material to endure a significant amount of plastic deformation before fracture. A typical stress-strain curve of a ductile material would include the stress-strain curve stages discussed above. Some examples of ductile materials are mild steel, aluminum, copper, rubber, and most plastics.
On the other hand, a brittle material fractures without any noticeable change in the rate of elongation. Meaning their yield strength, ultimate strength, and fracture strength are all the same. Cast iron, ceramics, glass, concrete, and stone are examples of brittle materials.
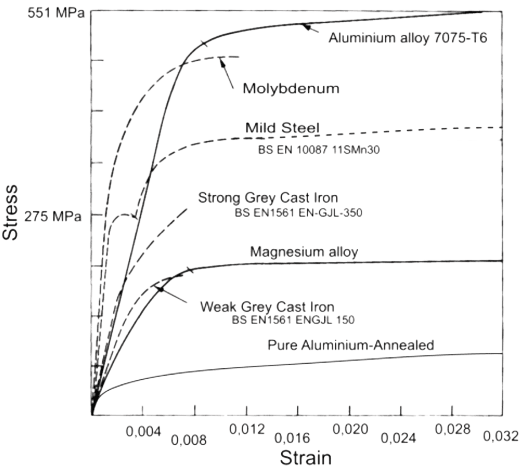
In figure 6 an example of the stress-strain curve of various materials is shown. It should be noted that the materials listed below in the graph are indeed not representative of all materials of that particular type. There are multiple factors that influence the material behavior under a load, such as material composition, heat treatment and conditioning, temperature, strain rate of the tensile test, etc.
The static simulation module in SimScale can be used to run both linear and non-linear simulations. The latter incorporates the ability to define non-linear material behavior beyond the yield point. It enables the SimScale user to virtually test and predict the behavior of structures and hence solve complex structural engineering problems subjected to numerous static loading conditions.
The FEA simulation platform uses scalable numerical methods that can calculate mathematical expressions that would otherwise be very challenging due to complex loading, geometries, or material properties.
In cases where the material is expected to yield, one can upload a stress-strain curve that defines the material’s behavior after yield. Please note that the uploaded stress-strain curve must be “true” and not “engineering”.
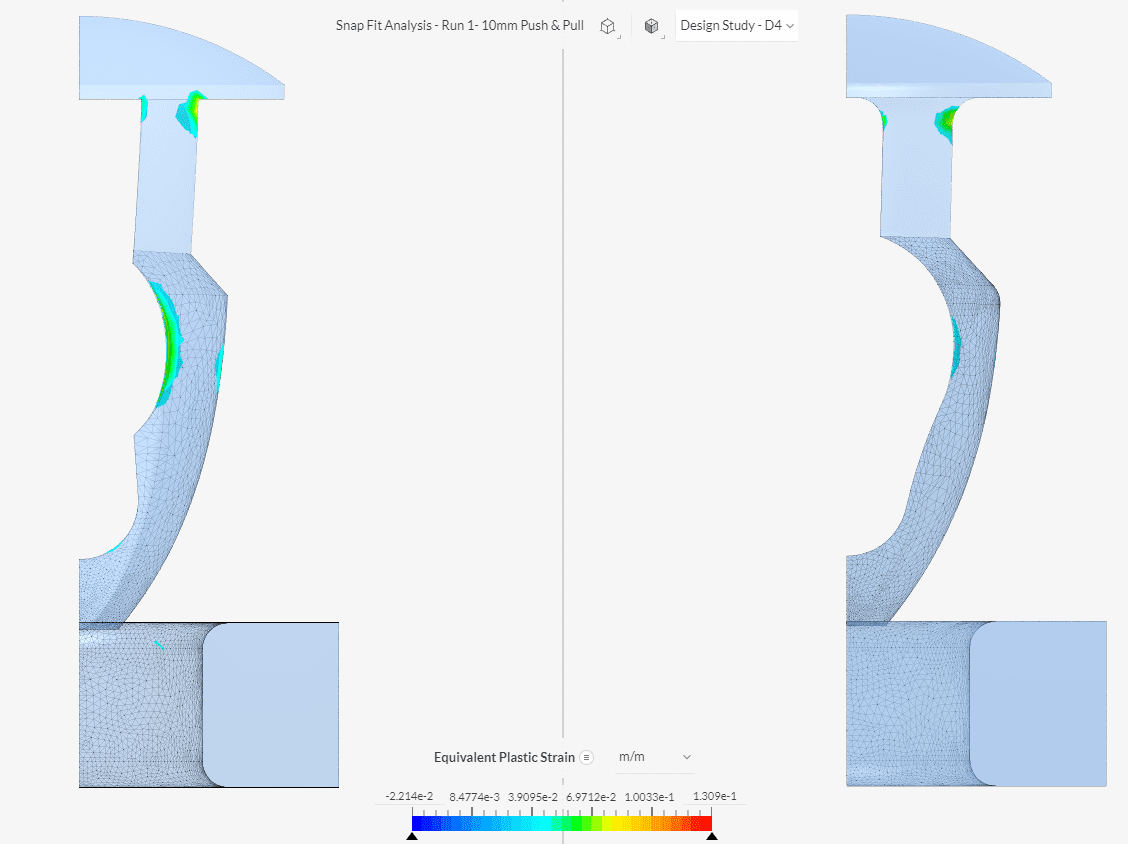
Below the results of two designs of a plastic push pin as part of a design iteration study are shown. A non-linear material was assigned to the plastic push pin, and the regions of permanent plastic deformation after the extraction of the push pin are highlighted.
The following documentation pages address the procedure of defining an elasto-plastic material.
With our cloud-native simulation platform, we empower every engineer to innovate faster by making high-fidelity engineering simulation technically and economically truly accessible at any scale.
References
Last updated: March 15th, 2023
We appreciate and value your feedback.
What's Next
What Is Heat Transfer?Sign up for SimScale
and start simulating now