Fatigue analysis studies the amount of stress cycles a part or an assembly can go through, until it reaches a breaking point, and is dependent on the material properties used. A special solver cannot directly calculate this, but there is a workaround to assess it using SimScale!
For this method, your material will need the S-N (stress-number of cycles until fracture) curve. This is something that will probably come from the supplier. This curve defines the relationship between the stress and the number of cycles until fracture, and as mentioned, it is unique for each material.
You can read more about this here: https://www.sciencedirect.com/topics/engineering/s-n-curve
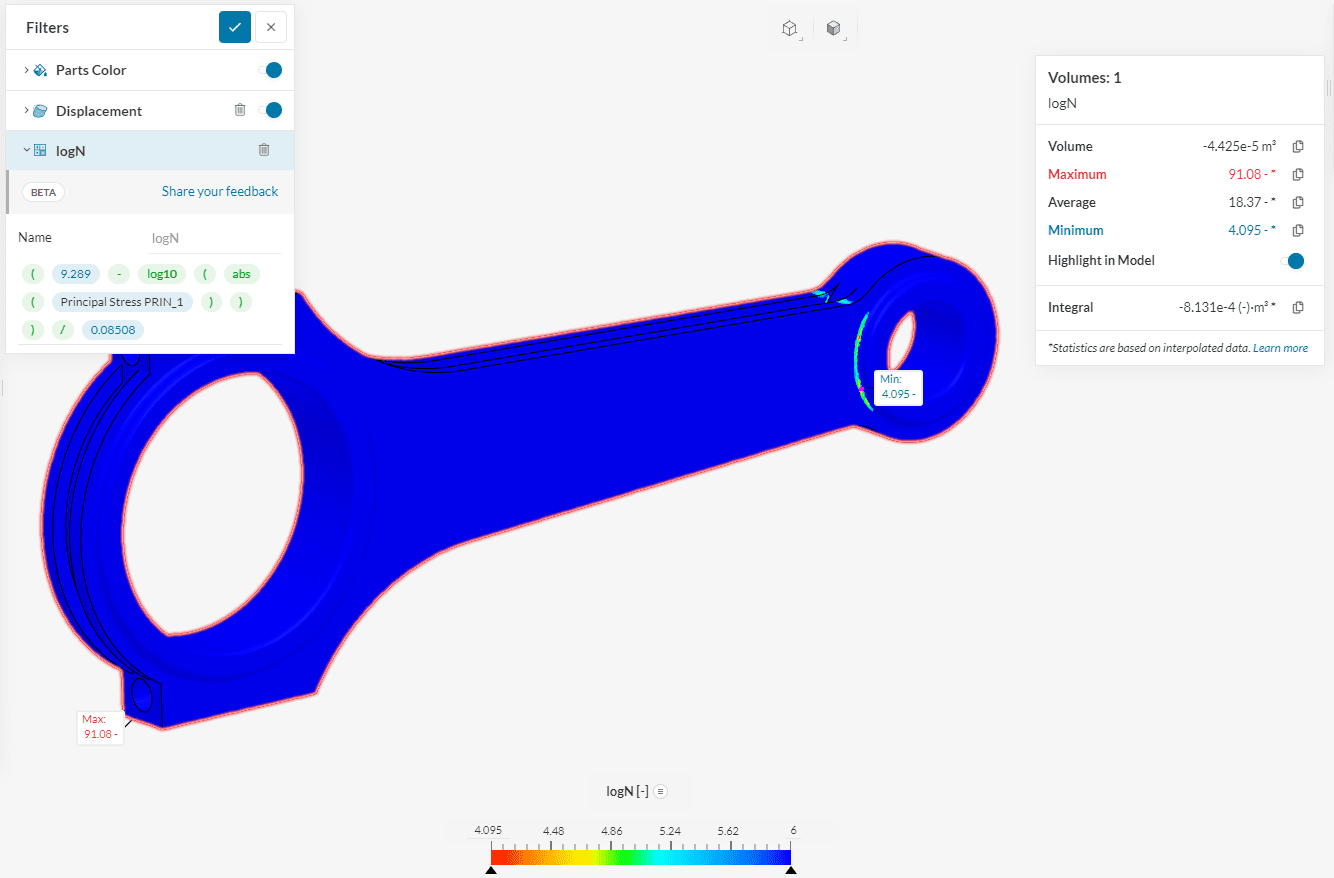
When you have your S-N curve, you can extract the equation that connects the stress (S) with the number of cycles (N) until the material fails. Then you can use this in the post-processor to visualize the “N” all over your part and isolate the most dangerous areas (where the “N” is the lowest).
This should be possible with our Calculator (for the creation of this “N” parameter using the stress), and the Iso-Volume (for isolating the range of interest).
Contact us
If none of the above suggestions did solve your problem, then please post the issue on our forum or contact us.


