Validation Case: Pedestrian Wind Comfort: AIJ Case F
With the increase in the number of high-rise buildings being constructed all around the world, proper planning of the close vicinity for comfort and safety becomes important. Computational fluid dynamics (CFD) is an apt solution for assessing these comfort and safety levels for pedestrian wind comfort (PWC) even before the buildings are erected, and also helps in faster design iterations. Pedestrian-level (micro-climate) condition is one of the first microclimatic issues to be considered in modern city planning and building design\(^1\).
Wind analysis results using CFD simulation are now seen as reliable sources of quantitative and qualitative data, and they are frequently used to make important design decisions. However, to have full confidence in those decisions, extensive verification and validation of the CFD results are necessary. For this, we will be validating against the experimental results provided by the Architectural Institute of Japan (AIJ), using AIJ Case F.
Architectural Institute of Japan (AIJ) Pedestrian Wind Comfort Experiments
The Architectural Institute of Japan (AIJ) is a Japanese professional organization for architects, building designers, and engineers. It was founded in 1886 and has gathered over 38,000 members since. It publishes several journals, technical standards for architectural design and construction, and research committee studies.
The wind analysis test case for this validation was taken from the “Guidebook for Practical Applications of CFD to Pedestrian Wind Environment around Buildings”\(^3\), published by AIJ in 2008, which sets the standards for cross-comparison between the results of CFD predictions, wind tunnel tests, and field measurements, and helps validate the accuracy of CFD codes for pedestrian wind comfort assessments.
We have also validated our LBM solution against another AIJ case, AIJ Case E, you can read about it here.
AIJ Case F
Wind Analysis in an Urban Area
The case being validated is Case F and is described as ‘Building complexes with complicated building shape in an actual urban area’\(2\) in Tokyo, Shinjuku. Many data sets are provided from [2] including measured data in the actual city location, wind tunnel data, and data obtained from several different CFD codes available at the time of publishing.
The complexity comes from the reliability of the sources, the closer to reality we measure, the less controlled the measurement environment becomes, and we see this first in the difference between wind tunnel and field measured data. Furthermore, it is described that not only is the wind tunnel model a simplification (naturally) of the real environment, but the CAD model for CFD provided is not the same as the wind tunnel model, where the model was constructed using aerial images of the area as it was in 1977, which instantly introduces inaccuracies.
That said, even if we expect a result to be different from experimental, we should expect results to be of a similar trend to past CFD studies, which are close within reason.
The results in paper\(^2\) are not the complete data set and are somehow selected as best points, we assume that was based upon an assessment of the location and how points may have been influenced. Furthermore, the presented results were slightly different than those defined in the spreadsheet, therefore the paper results were used in this comparison.
It is stated in the paper that points were measured at heights between 3 and 9 \(m\) however, this is not documented and the measurement points given in the excel sheet\(^4\) are at 10 \(m\). It is expected that some points are more sensitive to this than others.
Geometry
The below picture shows the AIJ Case F geometry with the main buildings highlighted:
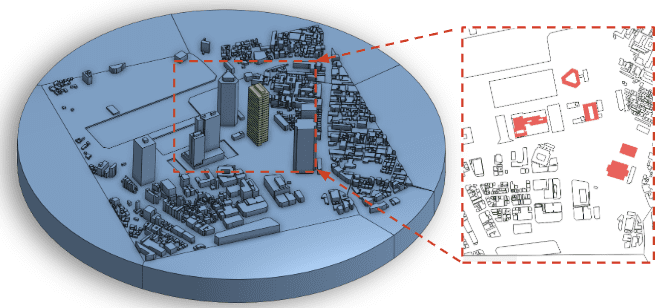
The original CAD model was downloaded as the .DXF file from the AIJ website and converted into an STL file. This STL file was then imported to SimScale directly and used for simulation.
Setup
- The case was run in the southerly wind condition.
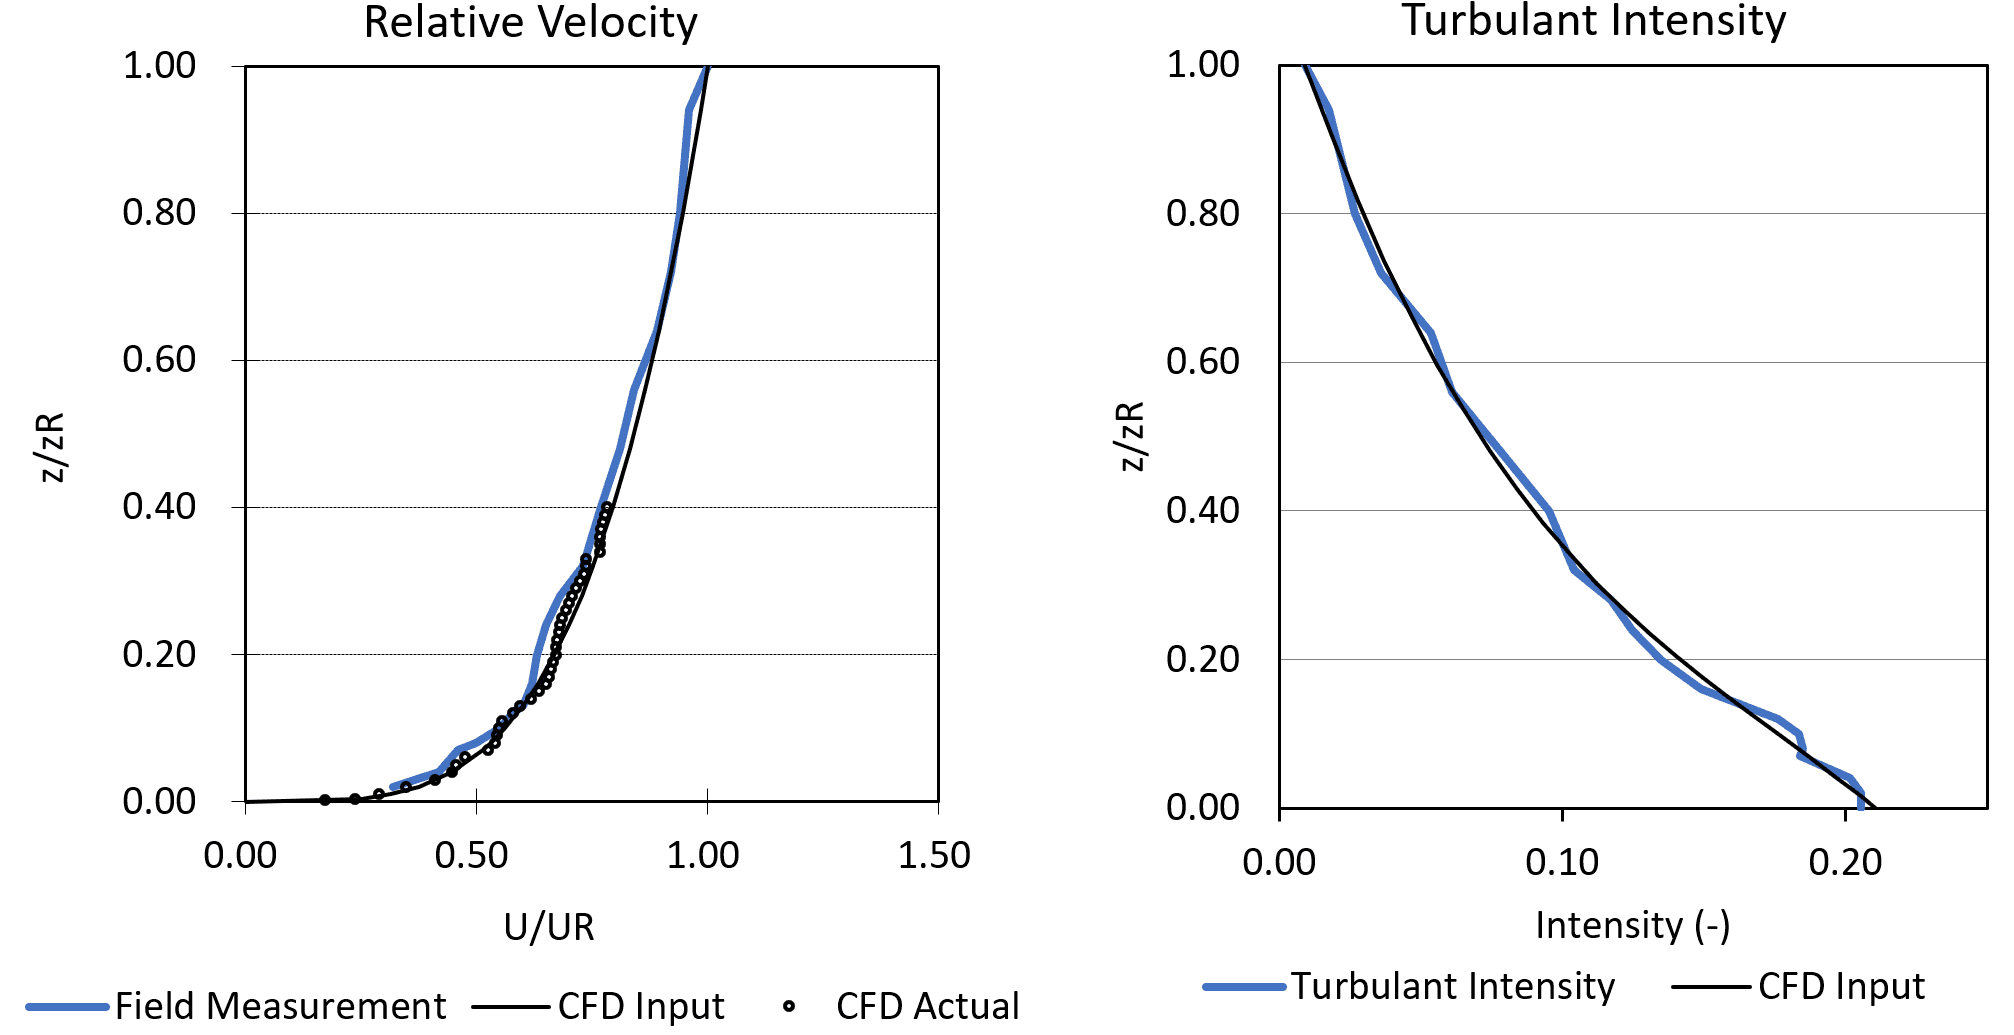
- The wind profile best fitting the experimental results were used:
- Power law with an exponent of 0.25\(^1\).
- A reference velocity of 25 \(m/s\) was used at a reference height of 500 \(m\).
- The Intensity profile was the best fit from experimental data\(^4\) using 3rd order polynomial.
- SimScale’s LBM Implementation, Pacefish®, was used from Numeric Systems\(^5\).
- The K-omega SST DDES turbulence model was chosen as it particularly excels for present cell sizes whilst still providing wall modeling.
- The floor had a roughness of .015 \(m\) sand grain equivalent to maintaining the profile.
- Sidewalls had a periodic condition.
- The top wall was a ‘slip’ wall.
- The upstream boundary was assigned the ABL profiles and the downstream boundary was assigned a pressure outlet with reference pressure 0 \(Pa\).
- The simulation was run for approximately 3 fluid passes using the reference velocity at building height.
- A virtual wind tunnel was used that measured 2.5 \(km\) long x 2 \(km\) wide x 1 \(km\) tall.
- Default air properties were used where the properties are;
- 1.529e-5 \(m^2/s\) for kinematic viscosity.
- 1.196 \(kg/m^3\) for density.
Mesh
- Automatic meshing was used where the final run was ‘Very Fine’ resulting in a mesh that had;
- 177 million cells.
- Minimum cell size on the building of 0.52 \(m\).
- Maximum cell size in the far-field of 33 \(m\).
- Reynolds scaling factor of around 1:25 \(m\).
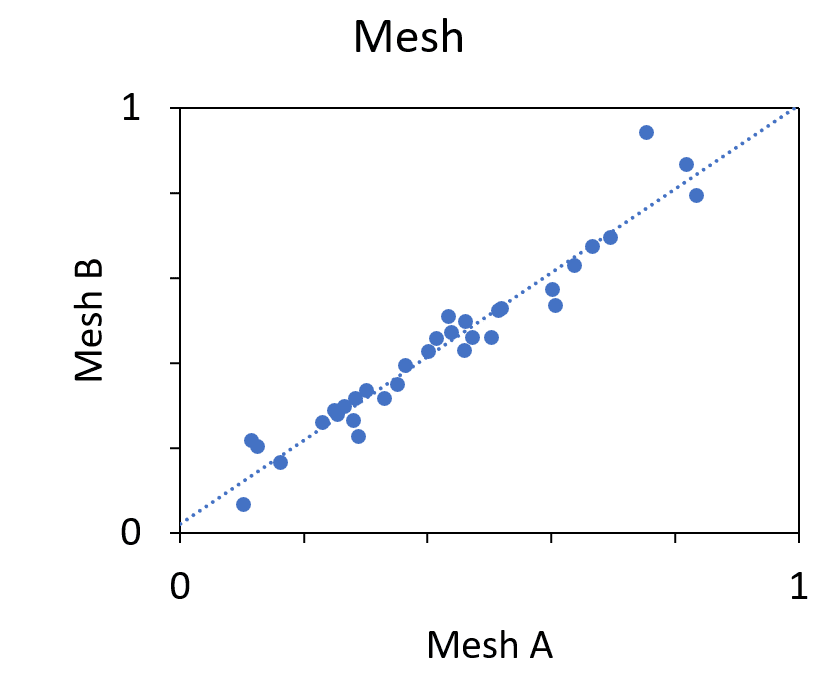
- A correlation between 2 meshes showed that the chosen mesh was sufficiently mesh-independent.
CFD Analysis Results for AIJ Case F
The purpose of our validation is to prove that mean velocities at measurement height were within a reasonable range from measured and wind tunnel experimental results, using the past CFD validations to set expectation due to the previously described discrepancies.
- Relative velocities normalized against the velocity of point C, located on top of the KDDI Building were used to compare the results.
- This experimental data and past CFD data was taken from the paper using a graph tracing tool, therefore, some minor error could be expected.
- Results from SimScale were averaged over 50% of the simulation, which is for the last 375 \(s\).
- These average results were processed into pressure coefficients using the velocity at building height.
- The result sets were plotted against each other in a post-processing tool to show how they all compare.
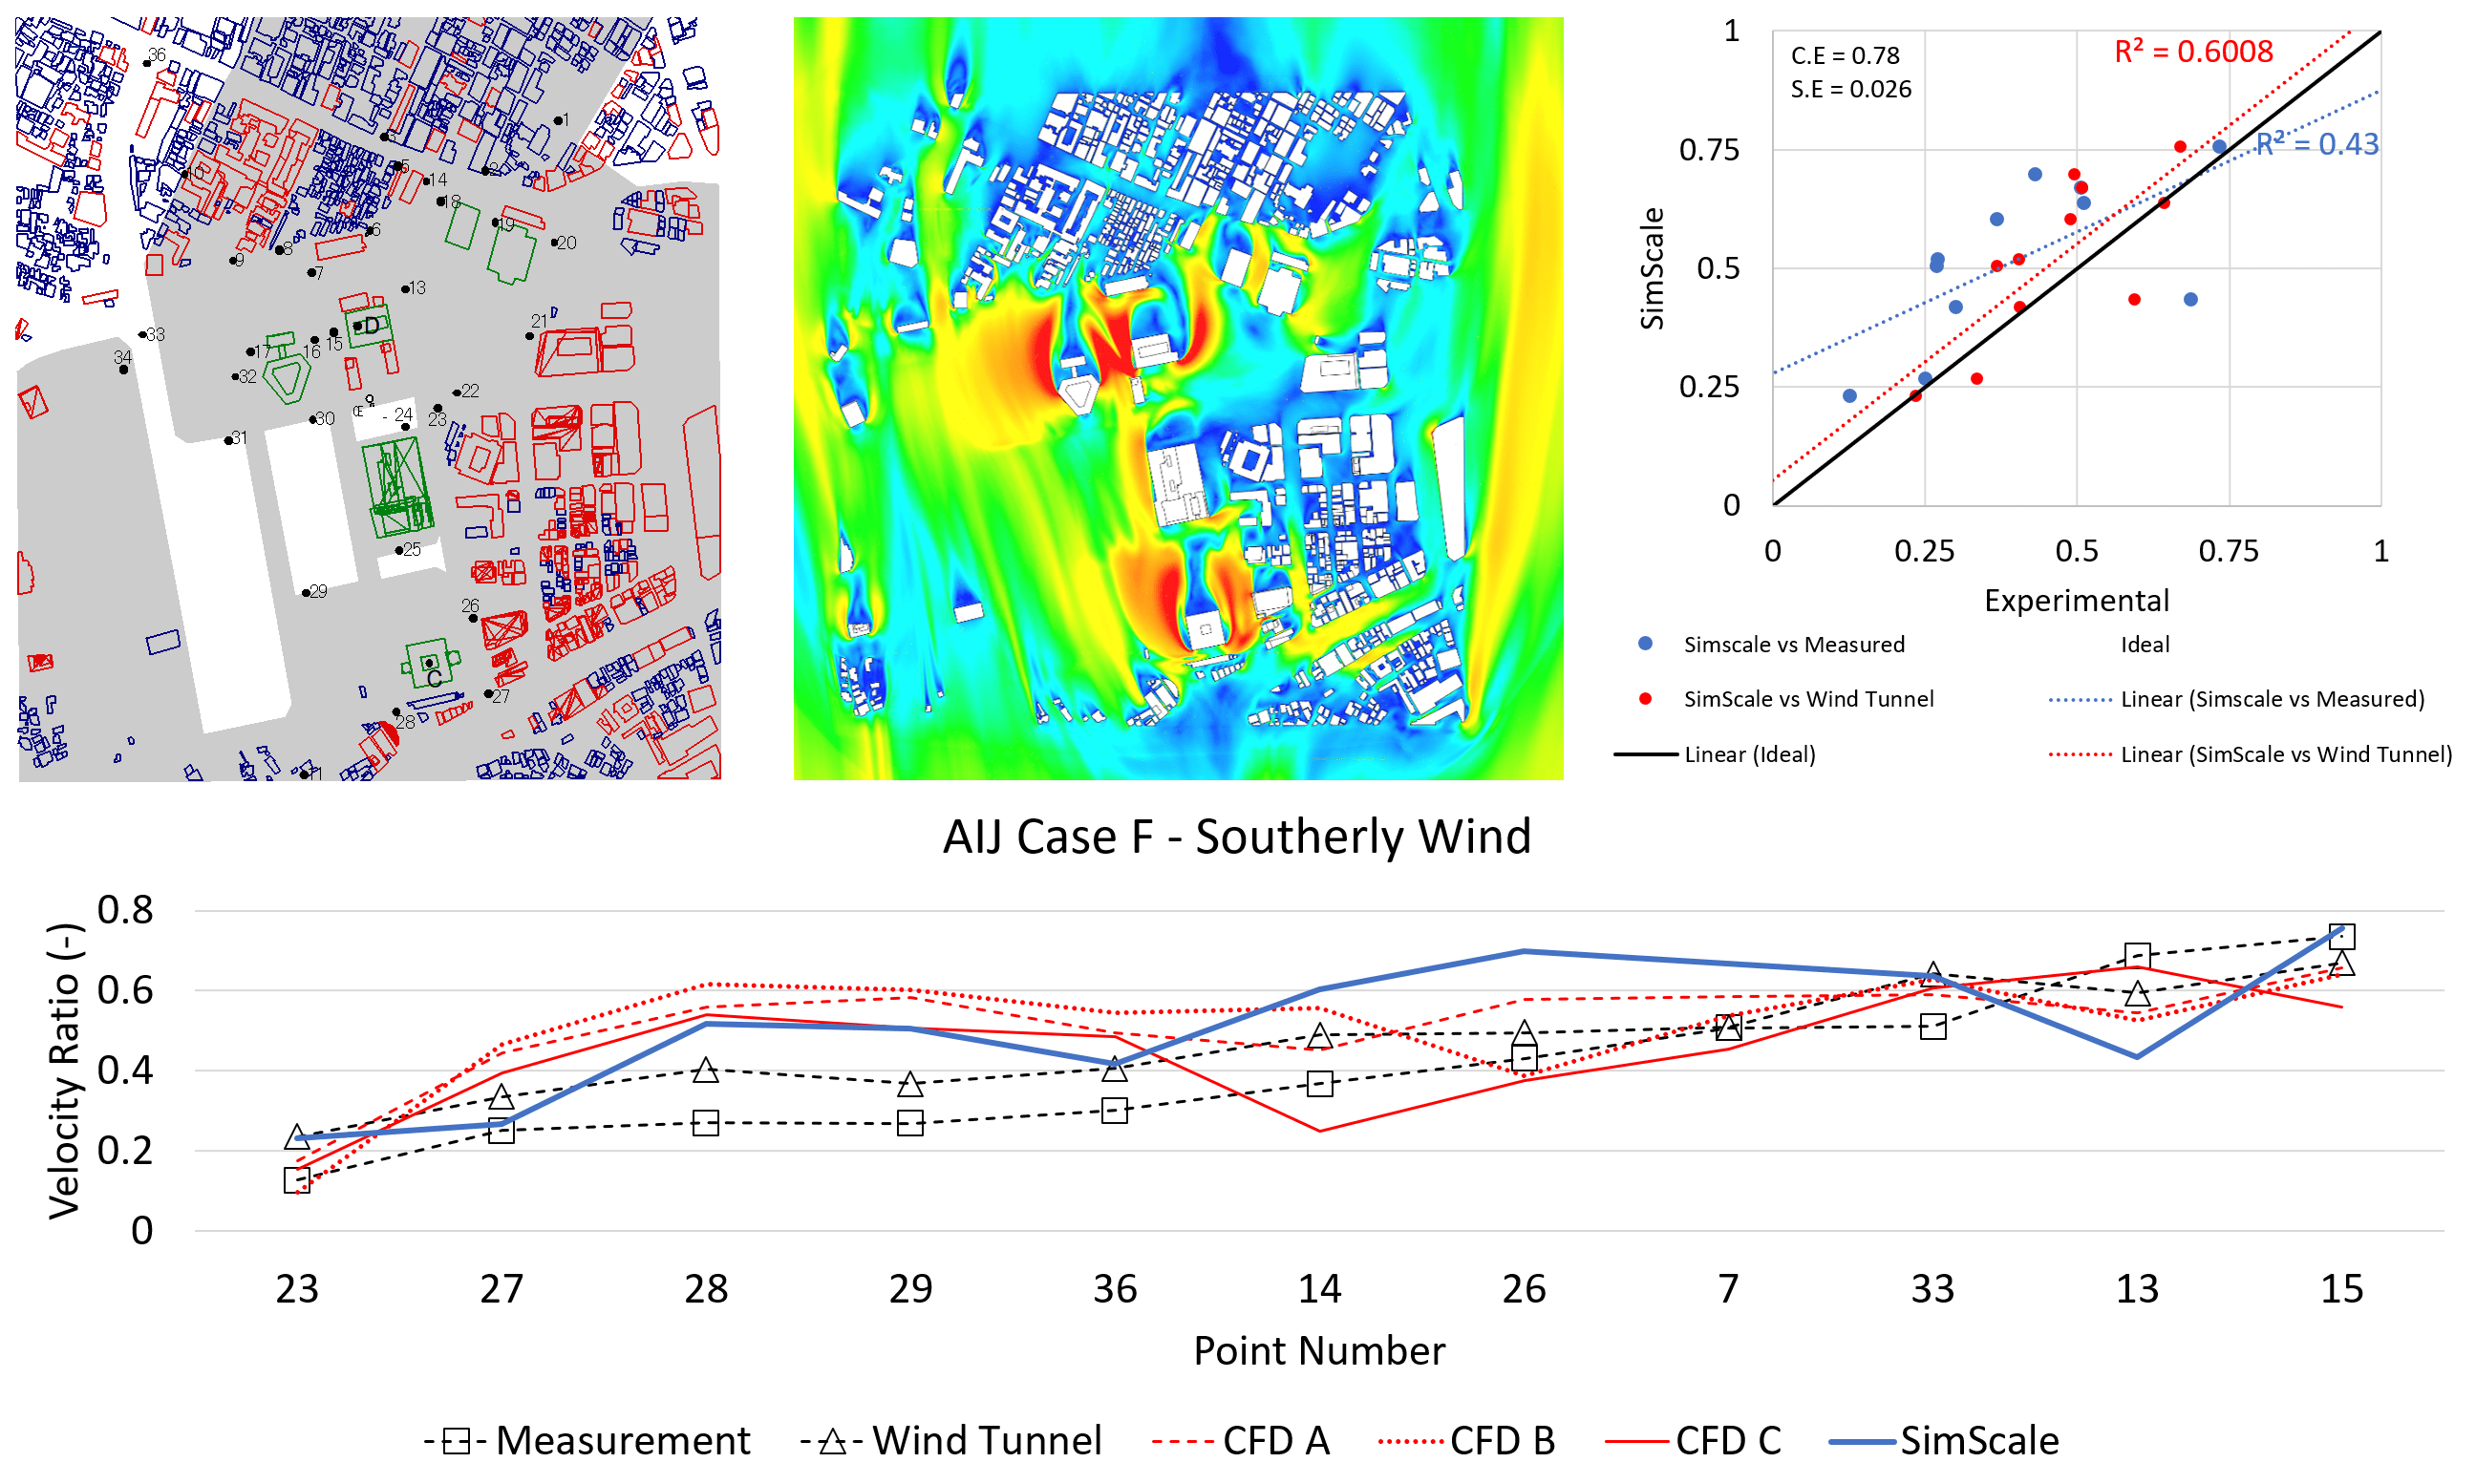
For explanation purposes, the points are grouped into 3, where group 1 represents points 23, 27, 28, 29, and 36; group 2 represents points 14, 26, 7, and 33; and Group 3 represents 13 and 15.
Group 1 generally fits better or as well as the other CFD codes, where points such as 23 and 36 almost exactly agree with wind tunnel results. The others are a little higher than wind tunnel results.
Group 2 is higher in velocity than both experimental results and also in general, the CFD results. Point 33 once again shows good agreement with all CFD results and the wind tunnel results. The only two points whose error is higher than the CFD results however are points 26 and 7.
Group 3 has a higher error than most CFD codes in comparison to either wind tunnel or measured data. Point 15 is much closer, and almost has no error in comparison to measured data.
AIJ Case F: Conclusion
The correlation between SimScale results and wind tunnel results are stronger than past CFD results. Additionally, all the caveats described about the data, CAD, and methodology, makes this a great outcome and a good reminder that measurements, wind tunnels, and modeling techniques have their pros and cons. This case also reassures that CFD results can be achieved at a much lower price point than wind tunnel testing, and the CFD results can corroborate well. We are also reminded that even wind tunnel testing can differ from real measurement results, but also real measurements are at the mercy of how long they can be monitored before the built environment changes.
In terms of turnaround time, this validation quality mesh, consisting of 177 million cells took just 10 hours to solve, with a resolution of 0.52 \(m\), and cost around 87 GPU hours. In comparison to wind tunnel modeling this is a big advantage, but also against traditional finite volume methods, was much faster than the expected 2 days solve time. The robustness of the solver also makes a large difference since there was no iterating to obtain numerical stability from the mesh, setup, and CAD quality, where experienced readers will know this is where we have traditionally spent the most amount of time.
References
- (104-106, 397-407) (2012) “Designing for pedestrian comfort in response to local climate.” Journal of Wind Engineering and Industrial Aerodynamics – Wu and Kriksic
- (2016) AIJ Benchmarks for Validation of CFD Simulations Applied to Pedestrian Wind Environment around Buildings
- (2006) “AIJ Guideline for Practical Applications of CFD to Wind Environment around Buildings” The Fourth International Symposium on Computational Wind Engineering – Akashi Mochida, Yoshihide Tominaga and Ryuichiro Yoshie.
- Guidebook for Practical Applications of CFD to Pedestrian Wind Environment around Buildings – Architectural Institute of Japan.
- https://www.numeric.systems/
Last updated: February 18th, 2026
Did this article solve your issue?
How can we do better?
We appreciate and value your feedback.


