Documentation
This case belongs to thermodynamics. The aim of this test case is to validate the following parameter during a convective heat transfer — governed by the Nusselt number — in a sphere for different time steps:
The simulation results of SimScale were compared to the results presented by VPCS in [TTLV01]\(^1\) .
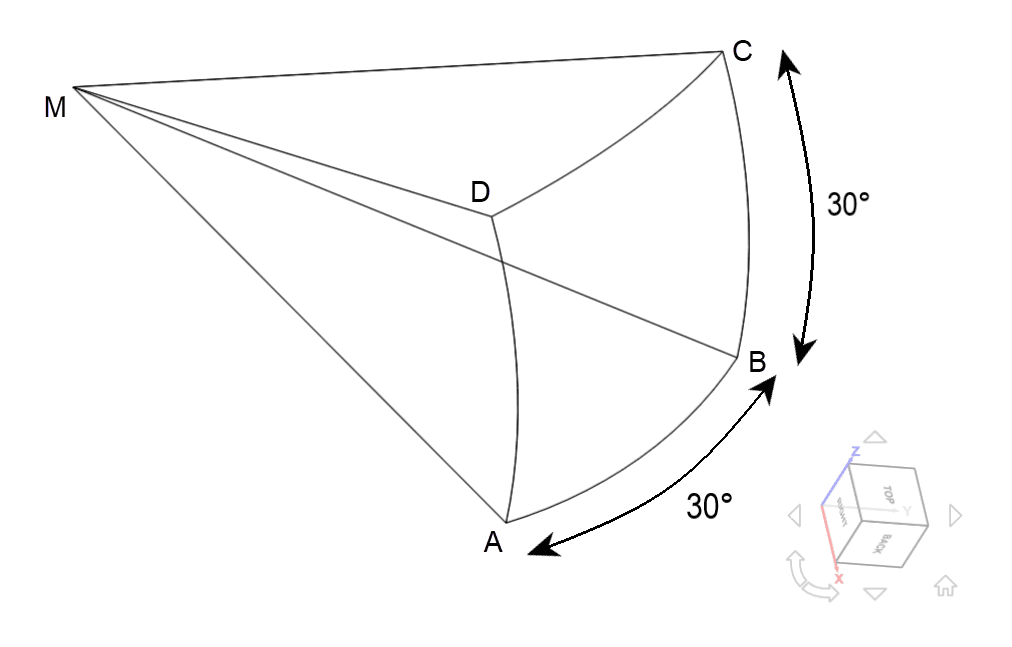
Only a portion of a sphere with a diameter of 0.2 \(m\) is used for the analysis, as shown in the figure below. M is the center of the sphere and the face ABCD represents the outer surface.
Tool type: Code_Aster
Analysis type: Heat transfer, linear
Time dependency: Transient
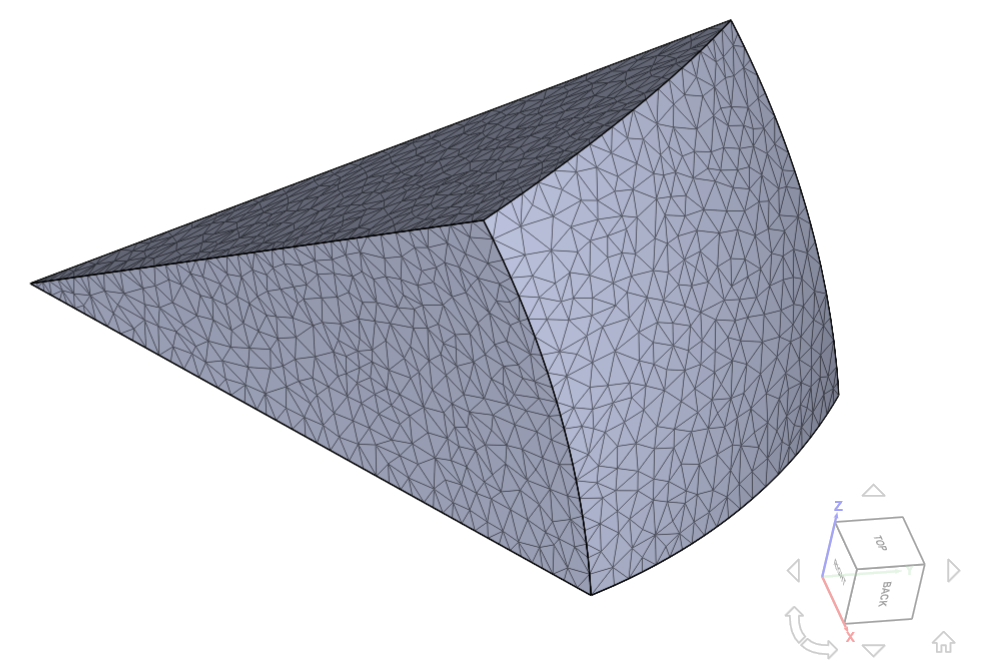
Mesh and element types: Two meshes, used in cases (A) and (B), were created with the standard meshing algorithm on the SimScale platform.
| Case | Mesh type | Number of nodes | Element type |
|---|---|---|---|
| (A) | 1st order tetrahedral | 5286 | Standard |
| (B) | 2nd order tetrahedral | 38271 | Standard |
The mesh for case A was created using 1st order tetrahedral elements:
For case B, a similar mesh with 2nd order tetrahedral elements was used.
Be Aware
All temperature dependent data in this cases is given as a function of °C (although it says °K in the Workbench)!
This is because of the equivalency between \(\frac {W}{°K}\) and \(\frac {W}{°C}\).
Material/Solid:
Initial Conditions:
Loads:
In the table below are the temperature values at different time steps at the center of the sphere. The SimScale results are compared against the results from VPCS\(^1\)
| Time \([s]\) | VPCS\(^1\) \([K]\) | Case A \([K]\) | Error [%] | Case B \([K]\) | Error [%] |
|---|---|---|---|---|---|
| 400 | 334 | 341.18 | 2.15 | 341.153 | 2.14 |
| 600 | 500 | 493.494 | -1.30 | 493.453 | -1.31 |
| 800 | 618 | 610.619 | -1.19 | 610.572 | -1.20 |
| 1000 | 706 | 700.66 | -0.756 | 700.613 | -0.76 |
| 1200 | 774 | 769.88 | -0.532 | 769.835 | -0.538 |
| 1400 | 828 | 823.093 | -0.593 | 823.052 | -0.598 |
| 1600 | 872 | 864.002 | -0.917 | 863.964 | -0.87 |
| 1800 | 902 | 895.45 | 0.726 | 895.417 | -0.73 |
| 2000 | 923 | 919.626 | -0.366 | 919.598 | -0.369 |
| 2200 | 942 | 938.212 | -0.402 | 938.188 | -0.405 |
| 2400 | 956 | 952.5 | -0.366 | 952.48 | -0.368 |
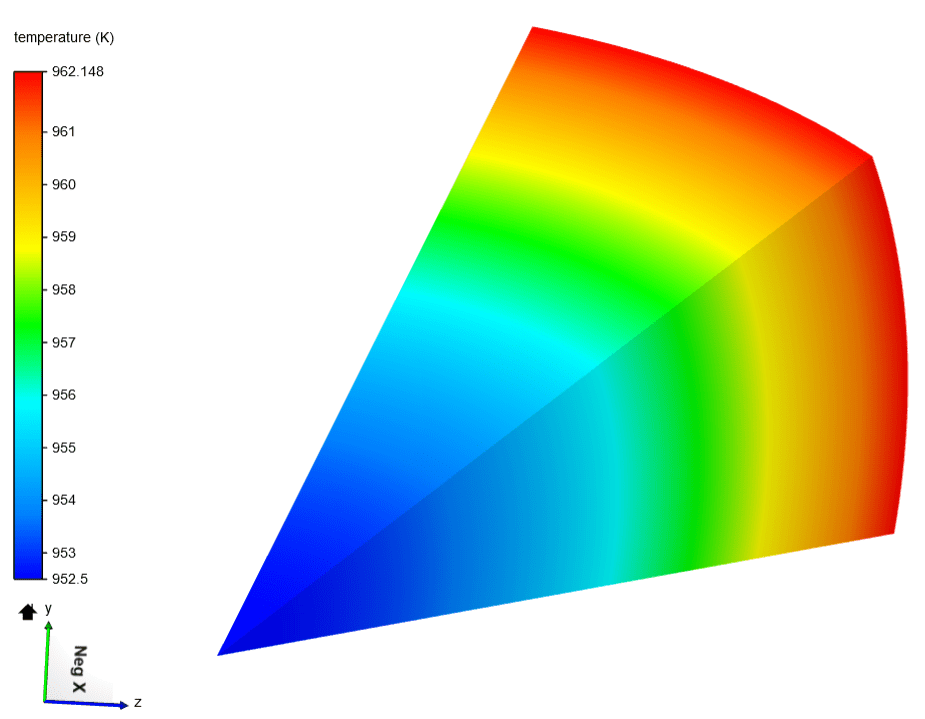
And at the outer surface the following comparison stats for the temperature were obtained:
| Time \([s]\) | VPCS\(^1\) \([K]\) | Case A \([K]\) | Error [%] | Case B \([K]\) | Error [%] |
|---|---|---|---|---|---|
| 400 | 461 | 474.889 | 3.013 | 474.8 | 2.99 |
| 600 | 608 | 596.363 | -1.914 | 596.28 | -1.93 |
| 800 | 696 | 689.704 | -0.905 | 689.628 | -0.92 |
| 1000 | 774 | 761.458 | -1.62 | 761.39 | -1.63 |
| 1200 | 828 | 816.619 | -1.375 | 816.56 | -1.38 |
| 1400 | 868 | 859.024 | -1.03 | 858.973 | -1.04 |
| 1600 | 902 | 891.624 | -1.15 | 891.58 | -1.16 |
| 1800 | 923 | 916.685 | -0.684 | 916.648 | -0.69 |
| 2000 | 942 | 935.951 | -0.642 | 935.92 | -0.65 |
| 2200 | 956 | 950.762 | -0.548 | 950.736 | -0.55 |
| 2400 | 962 | 962.148 | 0.015 | 962.127 | -0.013 |
Both cases are in a good agreement with the reference results with maximum error < 3%, which showcases the ability of SimScale to successfully analyze the heat transfer of a sphere.
Last updated: March 16th, 2026
We appreciate and value your feedback.
Sign up for SimScale
and start simulating now


