Validation Case: Choked Flow Due to Cavitation
This validation case belongs to computational fluid dynamics and aims to validate the following parameters:
- The cavitation model, available for the Multi-purpose solver in a pipe section with an orifice plate.
Simulation results were compared to experimental results available in the article “Characterization of high-pressure cavitating flow through a thick orifice plate in a pipe of constant cross-section“\(^1\), by Ebrahimi et al.
Geometry
This validation case uses a simple straight pipe section with an orifice plate, where the arrows indicate the flow direction:
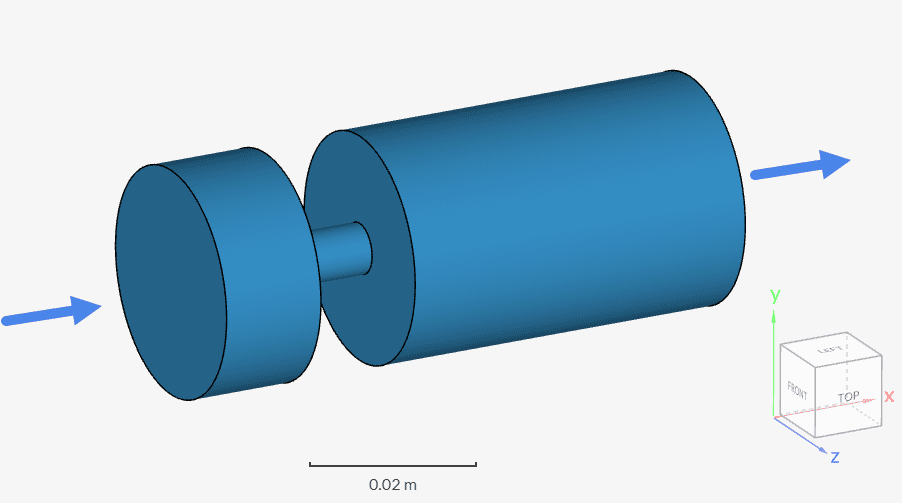
The dimensions of the pipe are listed below:
| Dimension | Value \([mm]\) |
| Inlet diameter | 28.5 |
| Inlet section length | 12.7 |
| Orifice plate diameter | 6.35 |
| Orifice plate length | 12.7 |
| Outlet diameter | 28.5 |
| Outlet section length | 44.45 |
The reference study tackles multiple scenarios, with various combinations of pressures at the inlet and outlet. This validation case focuses on the harshest scenario explored by the reference study, with an inlet pressure of 5000 \(psi\).
Analysis Type and Mesh
Analysis Type: Steady-state, Multi-purpose with k-epsilon and Cavitation model
Mesh and Element Types:
The mesh was created with SimScale’s Multi-purpose mesh type, which is a body-fitted structured mesh. A manual sizing definition relative to the CAD was used.
| Mesh Type | Minimum Cell Size | Maximum Cell Size | Cell Size on Surfaces | Number of cells | Element Type |
| Manual | 1e-5 (relative) | 0.005 (relative) | 0.0025 (relative) | 1137916 | 3D Hexahedral |

Simulation Setup
Material
Fluid:
- Water
- Kinematic viscosity \((\nu)\): 5.5668e-7 \(m^2/s\)
- Density \((\rho)\): 988 \(kg/m^3\)
- Vapor molecular weight: 18 \(kg/kmol\)
- Liquid bulk modulus: 2.15e9 \(Pa\)
- Liquid bulk modulus coefficient: 0
- Liquid reference pressure: 1.01325e5 \(Pa\)
- Saturation pressure: 1.234162e4 \(Pa\)
- Liquid temperature: 48.9 \(°C\)
Boundary Conditions
Using Figure 1 as a base, the table below provides the boundary conditions used in the setup:
| Boundary Condition | Value |
| Pressure inlet \([psi]\) | 5000 (total pressure) |
| Pressure outlet \([psi]\) | 345; 506; 1101; 2052; 2502; 2813 (fixed gauge pressure) |
| No-slip wall | Pipe walls and orifice plate |
Result Comparison
As the delta pressure between the inlet and outlet increases, a low-pressure region in the orifice causes bubbles to arise. These bubbles will occupy a portion of the orifice’s cross-section, limiting the amount of water that can go through, which causes a choked flow phenomenon.
Therefore, the main parameter of interest is the volumetric flow rate through the system, using the inlet as a reference. The table below summarizes the results:
| Outlet Pressure \([psi]\) | Volumetric Flow Rate – Reference \([GPM]\) | Volumetric Flow Rate – Simulation \([GPM]\) | Error |
| 345 | 77.0 | 81.8 | 5.9% |
| 506 | 77.1 | 81.8 | 5.7% |
| 1101 | 77.1 | 81.8 | 5.7% |
| 2052 | 77.0 | 81.0 | 4.9% |
| 2502 | 75.2 | 72.4 | -3.9% |
| 2813 | 70.7 | 67.9 | -4.1% |
Overall, the Multi-purpose solver was able to predict the flow behavior over a wide range of pressures, including choked flow behavior for outlet pressures of around 2050 \(psi\) or less.
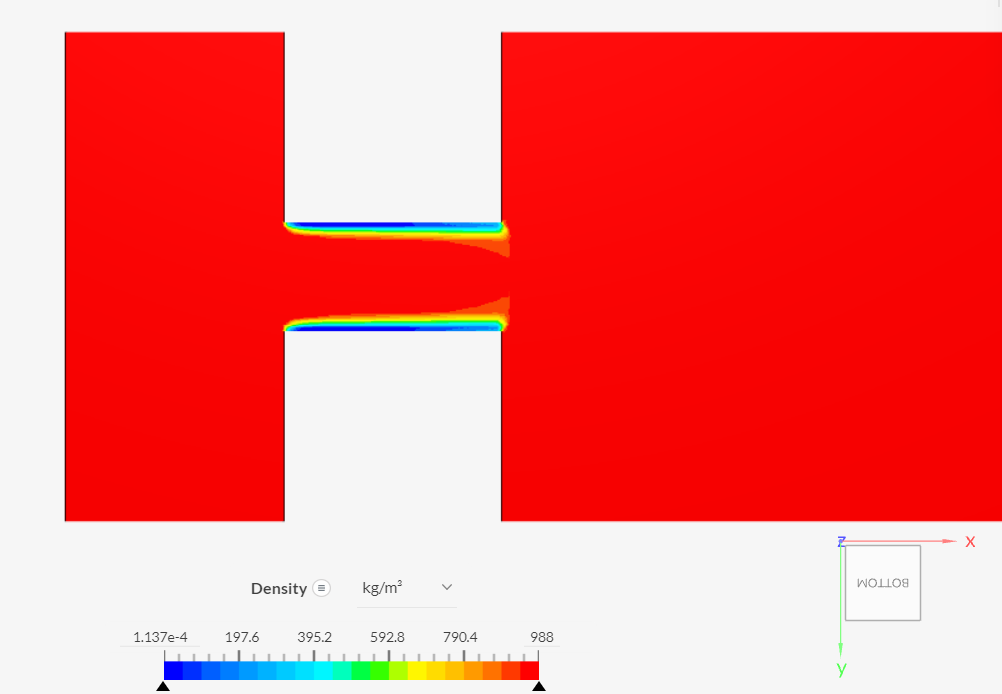
In the post-processor, cavitation is observed by monitoring density and gas volume fractions. The images below show the behavior for the case with the outlet pressure equal to 345 \(psi\).
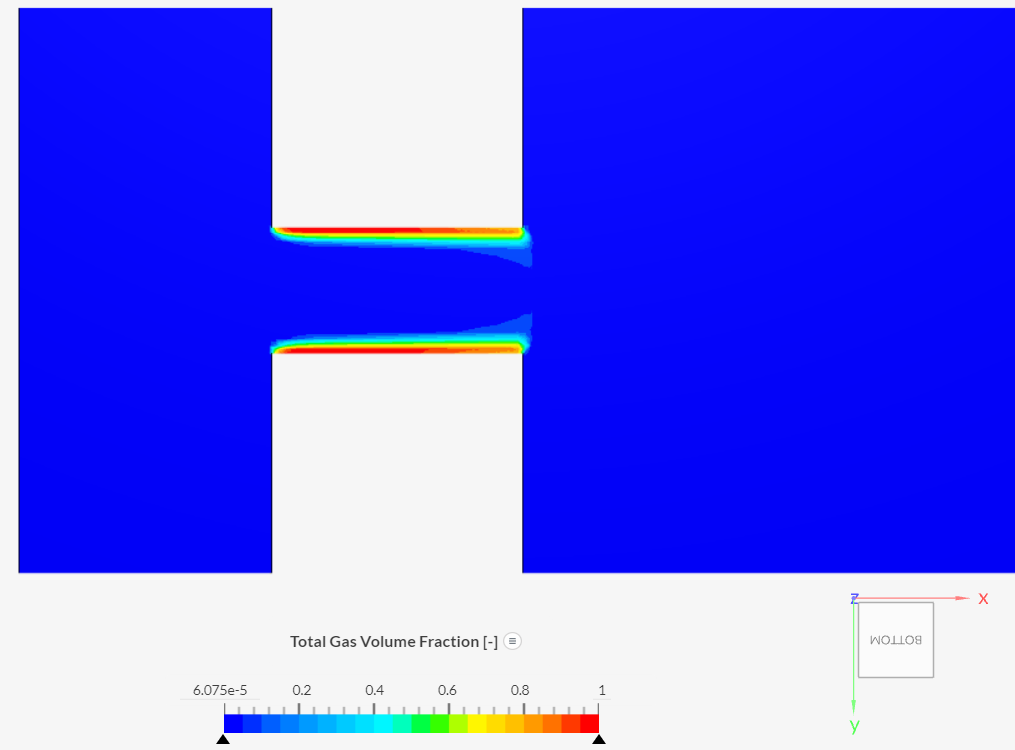
The bubbles close to the wall limit the cross-section area that water can flow through, choking the flow. The gas volume fraction shows this behavior more clearly:
Note
If you still encounter problems validating your simulation, then please post the issue on our forum or contact us.
Last updated: September 11th, 2024
Did this article solve your issue?
How can we do better?
We appreciate and value your feedback.


