The focus of this article is to show the best practice recommendations when setting up a pressure drop analysis for an internal flow using the OpenFOAM solver with the objective of achieving the most accurate results.
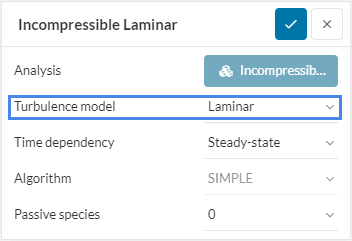
Turbulence Model
At first, the flow has to be characterized as laminar or turbulent. This can be determined by calculating the Reynolds number and comparing this against the critical Reynolds number.
For a laminar flow, it’s suggested to use the \(Laminar\) turbulence model, whereas, for a turbulent model, it’s suggested to use the \( k-\omega \:SST\) turbulence model.
Meshing
One critical aspect when trying to achieve highly accurate results is generating a good mesh. The following section describes the best practices and targets for mesh generation. In addition, it’s recommended to perform a mesh sensitivity study to ensure that the correct level of mesh fineness has been fulfilled.
General Mesh Requirements
As a first step, the user should ensure that a mesh with a high mesh quality is created. Information about the general mesh quality parameters and suggested ranges for each mesh quality parameter can be found here. Ensure that the mesh is below the suggested values for each parameter. In addition, it is recommended that for the flow channel at least 20 – 40 cells are created between the boundary layer cells. This helps to ensure an accurate solving of the bulk flow.
Extruded Mesh
If the Geometry is created as single continuous extruded part, it’s even recommended to use the sweep mesh function in order to generate an extruded mesh.
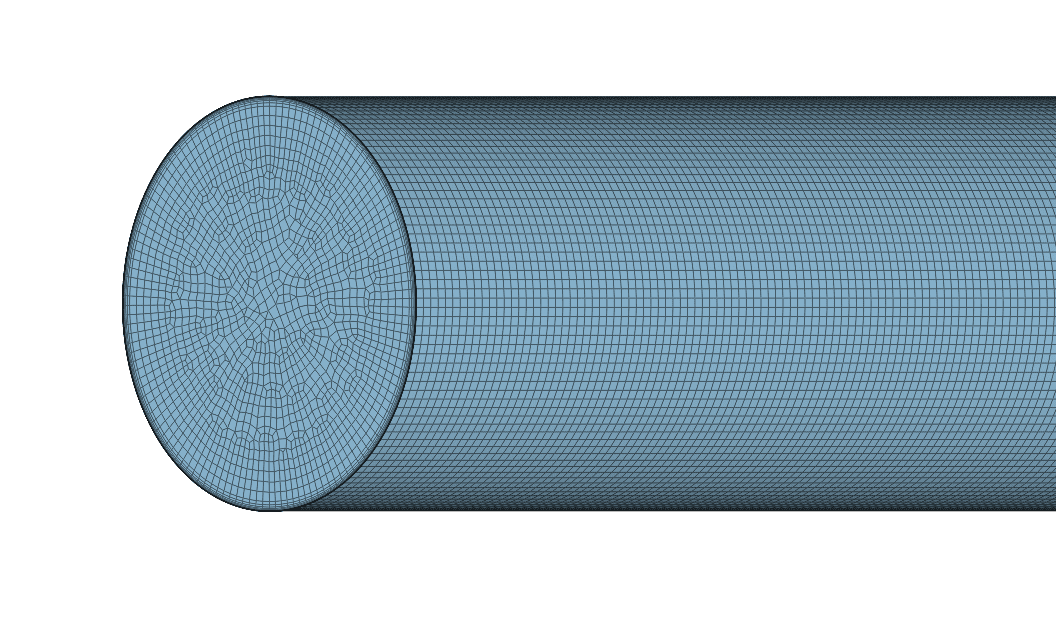
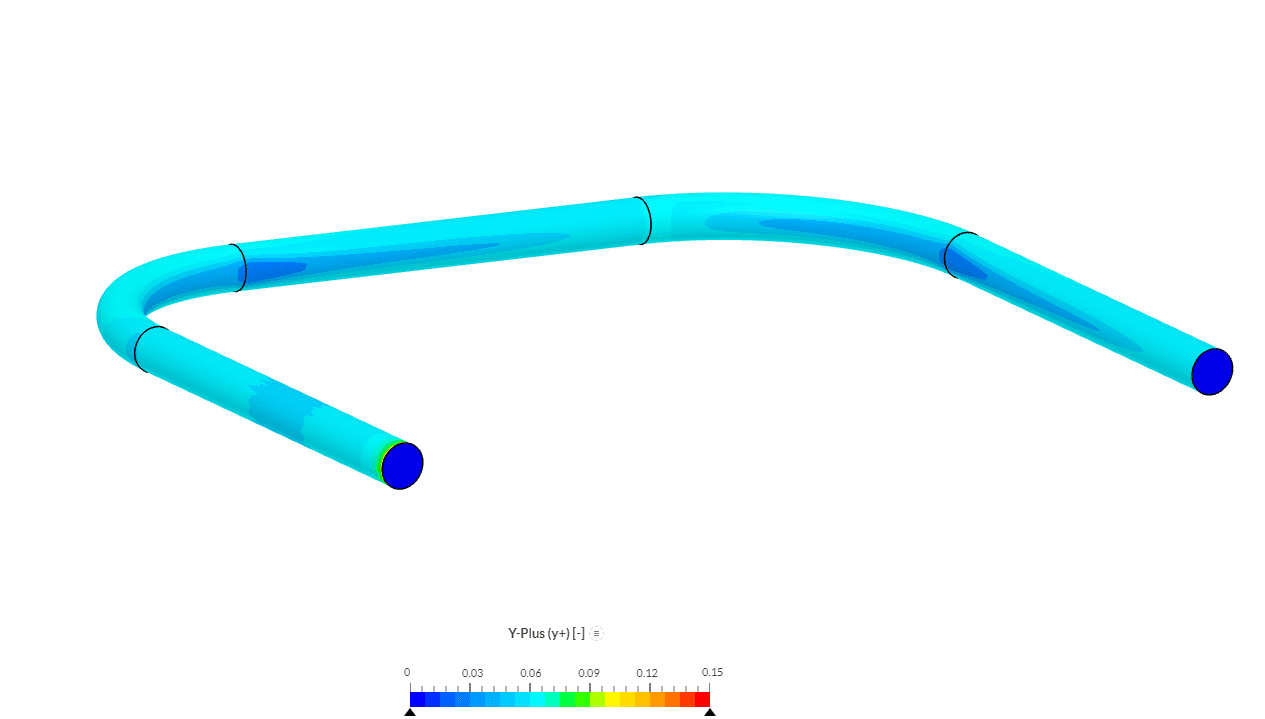
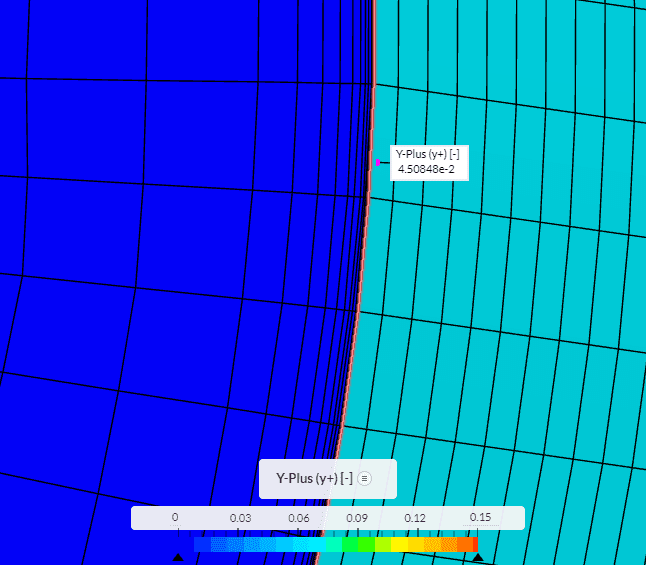
Boundary Layer Specification
In order to accurately simulate the near-wall flow it’s important that at least six boundary layer cells are created, especially in areas of expected high wall shear stress. Further, it’s important that the boundary layer cells resolve the correct Y+ range. Therefore the Y+ value should be below 1, or above 30.
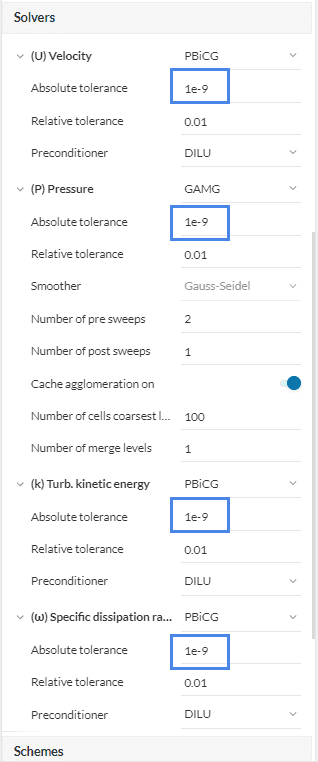
Numerical Tolerances
To ensure that the numerical error of the simulation is as low as possible and that convergence of all equations is obtained, it’s recommended to reduce the numerical tolerances of the solvers. This can be done in the numerical solvers setting. It’s best practice to reduce the Absolute solver tolerance to at least 1e-9.
Absolute Tolerance Limit
To ensure that the simulation is not limited by the absolute tolerance value, it’s recommended to check the residual plot and solver log to ensure that the solver tolerance has not been limited by the threshold too early in the simulation.
Numeric Schemes
In cases where a high-quality mesh has been achieved, further result improvements can be achieved by reducing the coefficient of the pressure gradient scheme to 0.5 or switching to the Gauss linear gradient scheme.
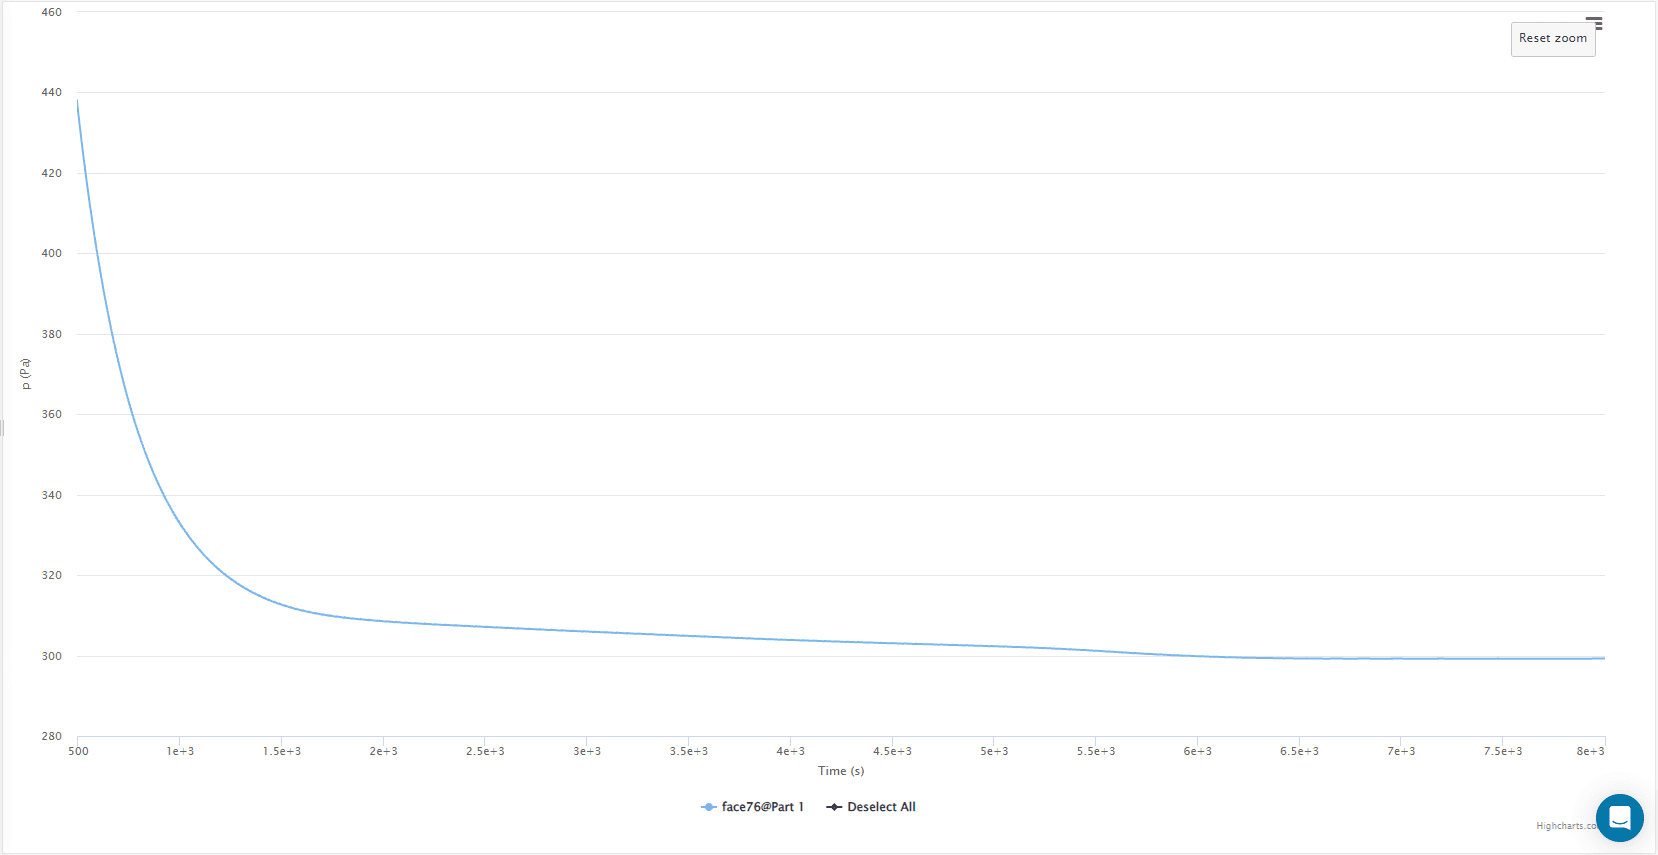
Convergence
To ensure that the simulation is converged it’s important to validate that enough iterations have been solved. This should be monitored in the residual plot ensuring that all residuals are converged and are at least below \(1e^{-5}\). In addition, the pressure at the inlet, or outlet should be monitored via a result control item, and it should be ensured, that the pressure values are stable. If the solution is not converged, it’s recommended to either extend the runtime or to further improve the mesh.
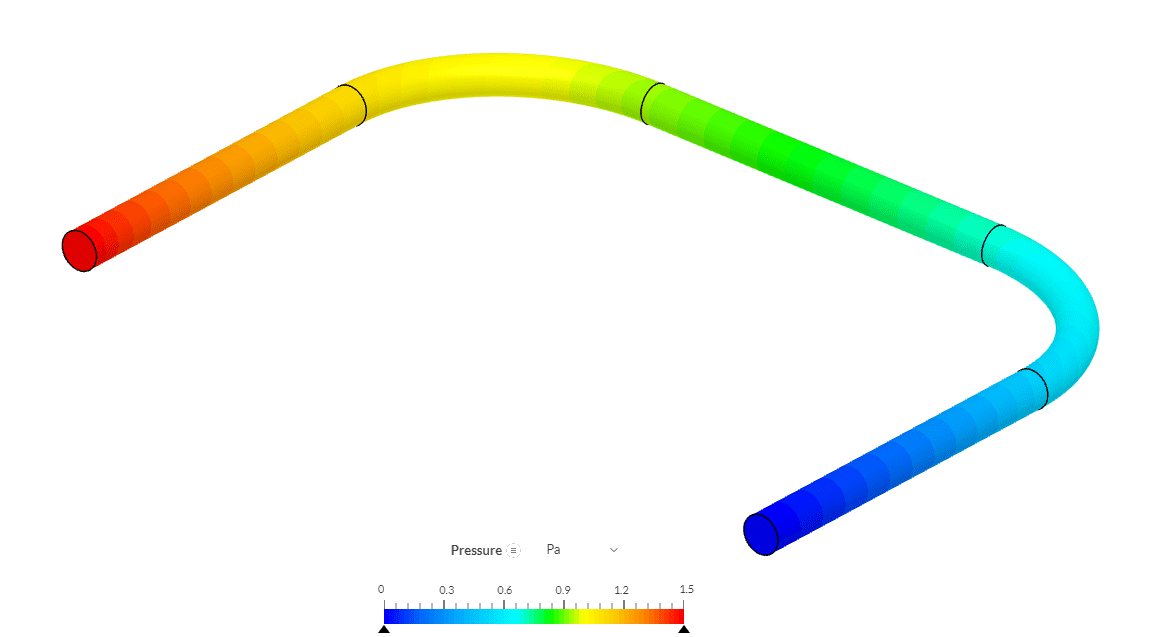
Example Project
An example project of an accurate laminar and turbulent pressure drop analysis can be found below. The goal of the simulation is to evaluate the pressure drop in a U-shaped pipe. Two flow states have been assessed, a laminar flow state and a turbulent flow state.
Note
If you have questions or suggestions, please reach out either via the forum or contact us directly.


