Validation Case: Random Vibration Analysis of a Cantilever Beam
This validation case belongs to solid mechanics. It aims to validate the random vibration response of a square cantilever beam, where the beam is excited by the Base excitation boundary condition in SimScale Harmonic analysis solver.
The simulation results from SimScale were compared to the reference results presented in results in [Johnsen and Dey (1978)]\(^1\)
Geometry
The geometry used for the case is as follows:
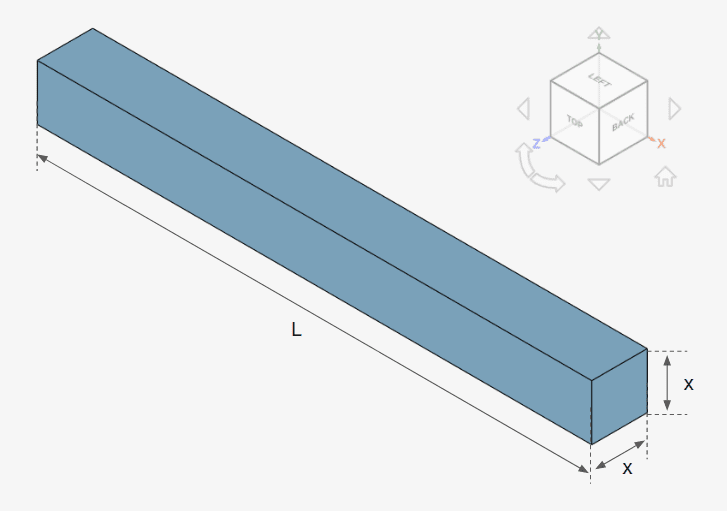
The dimensions of the geometry are tabulated below:
| Geometry Parameter | Dimension [m] |
|---|---|
| Length (L) | 1 |
| Width/Height (X) | 0.1 |
Analysis Type and Mesh
Tool Type: Code_aster
Analysis Type: Harmonic Analysis
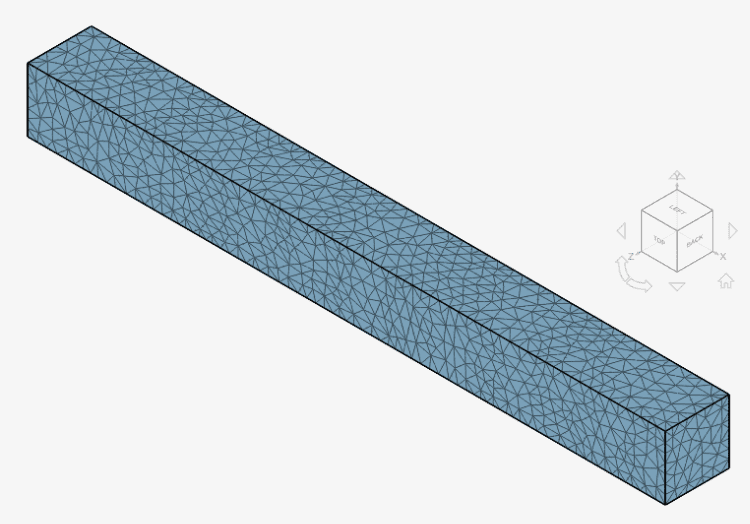
Mesh and Element Types:
The meshes were computed using SimScale’s standard mesh algorithm and manual sizing. The following table shows an overview of the mesh characteristics:
| Case | Element Type | Number of Nodes | Element Technology |
|---|---|---|---|
| A | 1st Order Tetrahedral | 32 663 | Standard |
| B | 2nd Order Tetrahedral | 118 696 | Reduced Integration |
| C | 2nd Order Tetrahedral | 240 757 | Reduced Integration |
Simulation Setup
Material:
- Linar Elastic Isotropic
- \(E\) = 210 \(GPa\)
- \(\nu\) = 0.3
- Hysteretic damping
- Hysteretic coefficient = 0.05
- \(\rho\) = 8000 \(kg/m^3\)
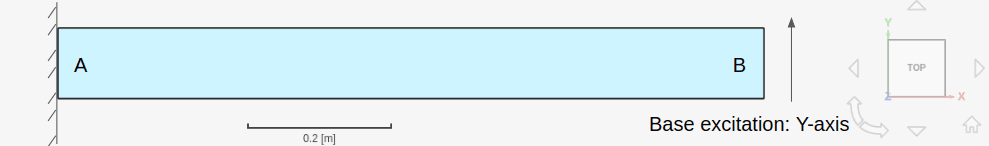
Boundary Conditions:
Random vibration analysis tests the response of a structure under a vibrating load. For practicality, this analysis uses the PSD (Power Spectral Density) curve to determine the peak responses of the structure.
- Fixed Support:
- Face A is fixed
- Base Excitation:
- The whole structure is subjected to a fixed acceleration of 1 \(m/s^2\) along Y-axis.
The base excitation is applied as an acceleration (1 \(m/s^2\)) in the Y-axis together with the Power Spectral Density (PSD), which is presented in the following table:
| Frequency [Hz] | PSD acceleration [g^2/Hz] |
|---|---|
| 20 | 0.02 |
| 52 | 0.053 |
| 900 | 0.053 |
| 2000 | 0.0022 |
Reference Solution
The reference solution comes from the analysis of Johnsen and Dey (1978)\(^1\). The published reference data covers the Response Power Spectral Density (RPSD) of the displacement at the tip of the cantilever. In SimScale, acceleration at the tip of the cantilever is measured and RPSD of the displacement is calculated as follows:
First, calculate the Response Power Spectral Density of the Acceleration.
$$RPSD_{Acceleration}= \big(\frac{a_{out}}{a_{in}} \big) ^{2} .PSD_{input} . g^2$$
- \(RPSD_{Acceleration}\) \([m^2/(s . Hz)]\): Response power spectral density of acceleration
- \(a_{in}\) \([m/s^2]\): Input acceleration that is defined in the base excitation (in this example 1 \([m/(s^2)]\).
- \(a_{out}\) \([m/s^2]\): Output acceleration. This value is measured in SimScale, using a probe point at the tip of the cantilever, for magnitude of acceleration at Y-axis.
- \(PSD_{input}\) \([g^2/Hz]\): Input PSD of acceleration, which is given in the reference.
- \(g\) \([m/s^2]\): Gravitational acceleration
Next, convert the RPSD of the acceleration to RPSD of the displacement, using the following equation:
$$RPSD_{Displacement} = \frac{RPSD_{Acceleration} }{ \big(2 . \pi . f \big)^4 }$$
- \(RPSD_{Displacement}\) \([m^2/(s . Hz)]\): Response power spectral density of displacement
- \(f\) \([Hz]\): Frequency
Results Comparison
The power spectral density of the displacement at the tip of the cantilever per frequency is presented in Table 3, alongside the comparison with SimScale results.
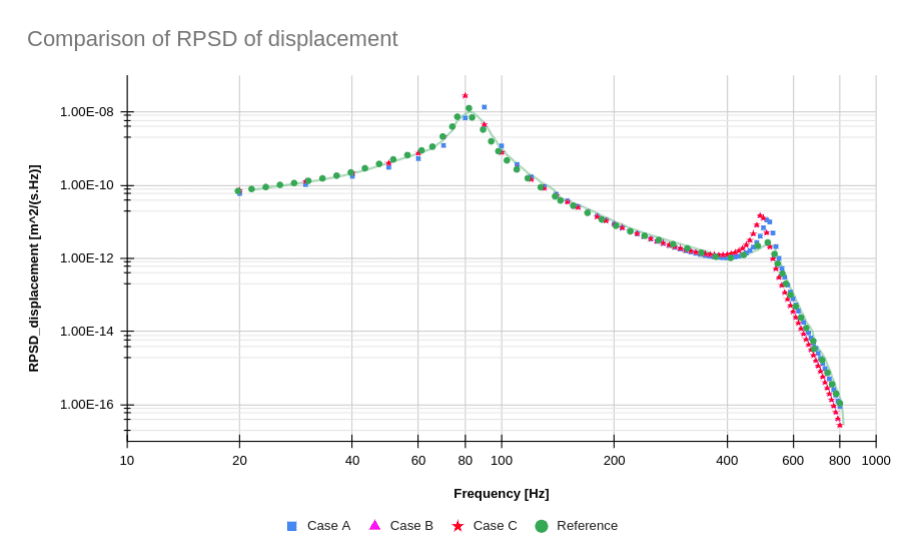
The results produced are in good agreement with the reference. The frequencies at peak responses are successfully captured. The higher deviations at peaks are most probably due to the difference between the element types used between Johnsen and Dey, and SimScale.
References
- Johnsen, T. L, and S. S. Dey, ASKA Part II – Linear Dynamic Analysis, Random Response, ASKA UM 218, ISD, University of Stuttgart, 1978.
Last updated: January 26th, 2023
Did this article solve your issue?
How can we do better?
We appreciate and value your feedback.


