Validation Case: LED Thermal Management – Chip on Plate (COP)
This case validates the thermal management inside an LED against the CFD and experimental results obtained in the conference paper, “Thermal Analyses and Measurements of Low-Cost COP Package for High-Power LED”\(^1\), using the Conjugate Heat Transfer analysis type in SimScale.
Geometry
The geometry consists of a cylindrical LED module constructed using the images from the conference paper\(^1\) with certain thickness assumptions for the Silicone encapsulant and the Aluminum Pkg substrate.
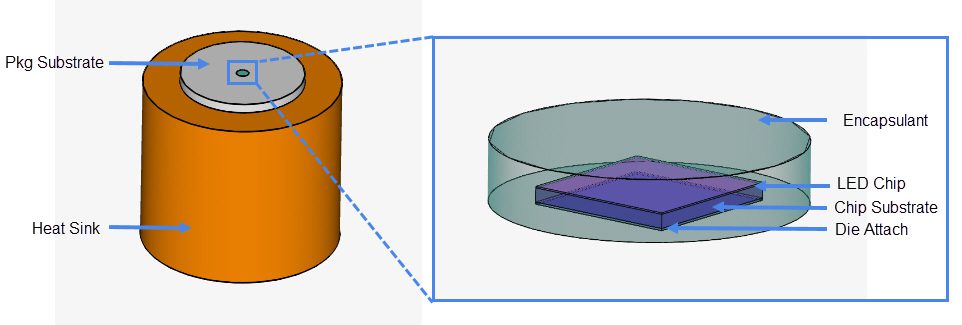
A cubic domain, with seven times the size of the LED module, is also constructed to model the air region surrounding the module in each direction.
Analysis Type and Mesh
Tool Type: OpenFOAM®
Analysis Type: Incompressible, steady state Conjugate Heat Transfer
Turbulence Model: Laminar flow
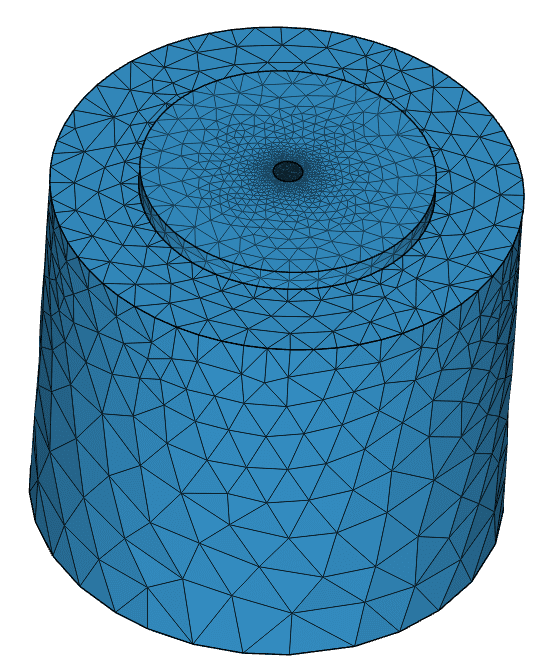
Mesh and Element Types: The mesh is generated using the standard meshing algorithm in SimScale.
| Mesh | Number of cells | Element type |
| F0.5 (Coarse) | 144000 | Tetrahedral and hexahedral |
| F5.5 (Moderate) | 725000 | Tetrahedral and hexahedral |
| F8.5 (Fine) | 4200000 | Tetrahedral and hexahedral |
Simulation Setup
Material
Solid: The materials constituting the LED are tabulated with their properties as follows:
| Materials | Thermal conductivity \([W/m\ °C]\) | Mass density \([kg/m^3]\) | Specific heat \([J/kg\ °C]\) |
| Silicone (Encapsulant) | 0.3 | 1200 | 2000 |
| LED Chip | 42 | 2330 | 712 |
| Sapphire (Chip substrate) | 35 | 3980 | 761 |
| Ag epoxy (die attach) | 8 | 2300 | 671 |
| Aluminum (Pkg substrate) | 220 | 2702 | 910 |
| Thermal Grease | 3.6 | 1180 | 1044 |
| Copper (Heat sink) | 380 | 8800 | 380 |
Fluid: Air
- Viscosity model: Newtonian
- Kinematic viscosity \((\nu)\): 1.469e-5 \(m²/s\)
- Density \((\rho)\): 1 \(kg/m^3\)
Boundary Conditions
As in the reference paper, all the faces of the LED module are modeled as no-slip walls with the temperature being zero-gradient. All the faces of the air domain are also modeled as no-slip walls with a fixed temperature value of 24 \(°C\) except for the top face which is open for natural convection.
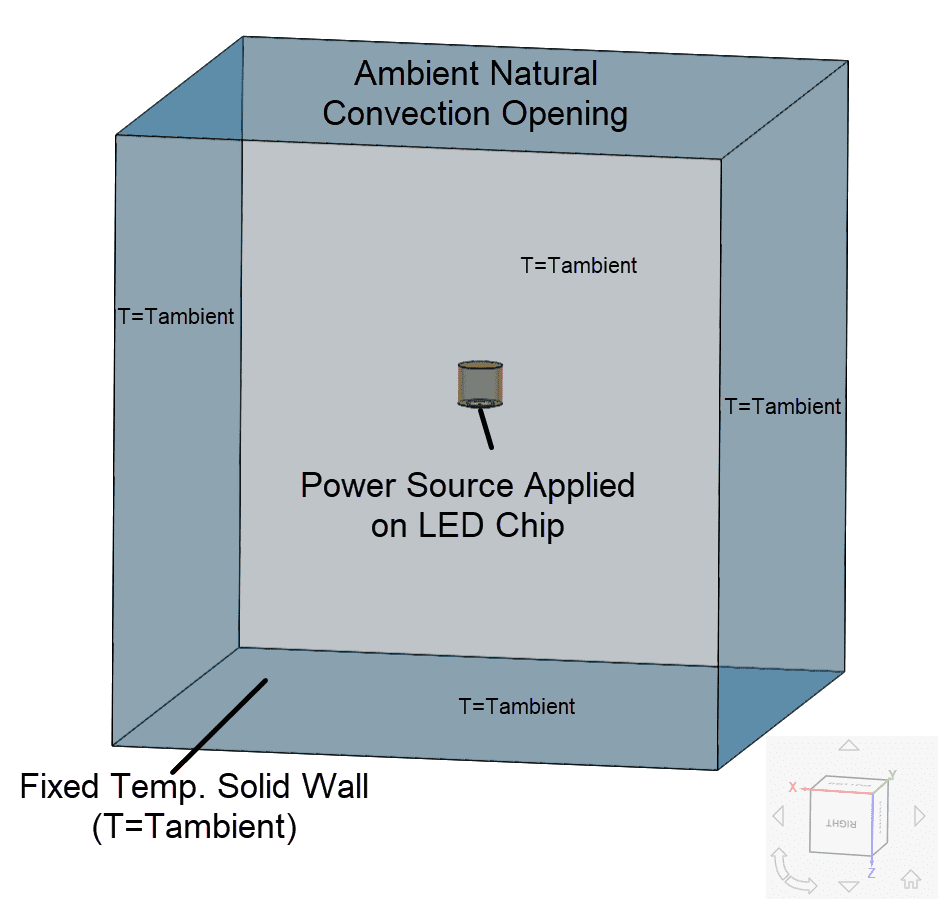
The LED module is placed in the air domain such that the Silicone encapsulant faces the direction in which gravity is modeled (+z axis).
Power Source
The experiments mentioned in the conference paper\(^1\) were performed at three different input powers: 0.96 \(W\), 1.22 \(W\), and 1.47 \(W\). The paper assumes that only 78% of the input power is transferred into heat, which is uniformly distributed over the entire chip volume. Thus, the LED Chip is modeled as an absolute power source with the values of 0.749 \(W\), 0.952 \(W\), and 1.147 \(W\) respective to the power inputs used in the experiment\(^1\).
You can read more about power sources in SimScale in the following documentation:
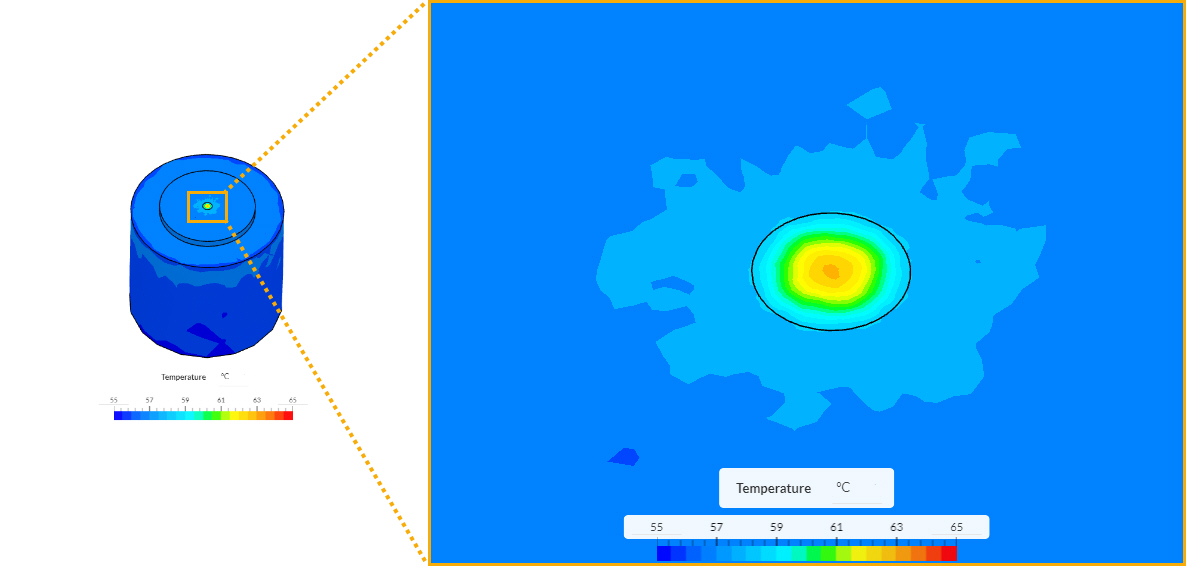
LED Thermal Management: Result Comparison
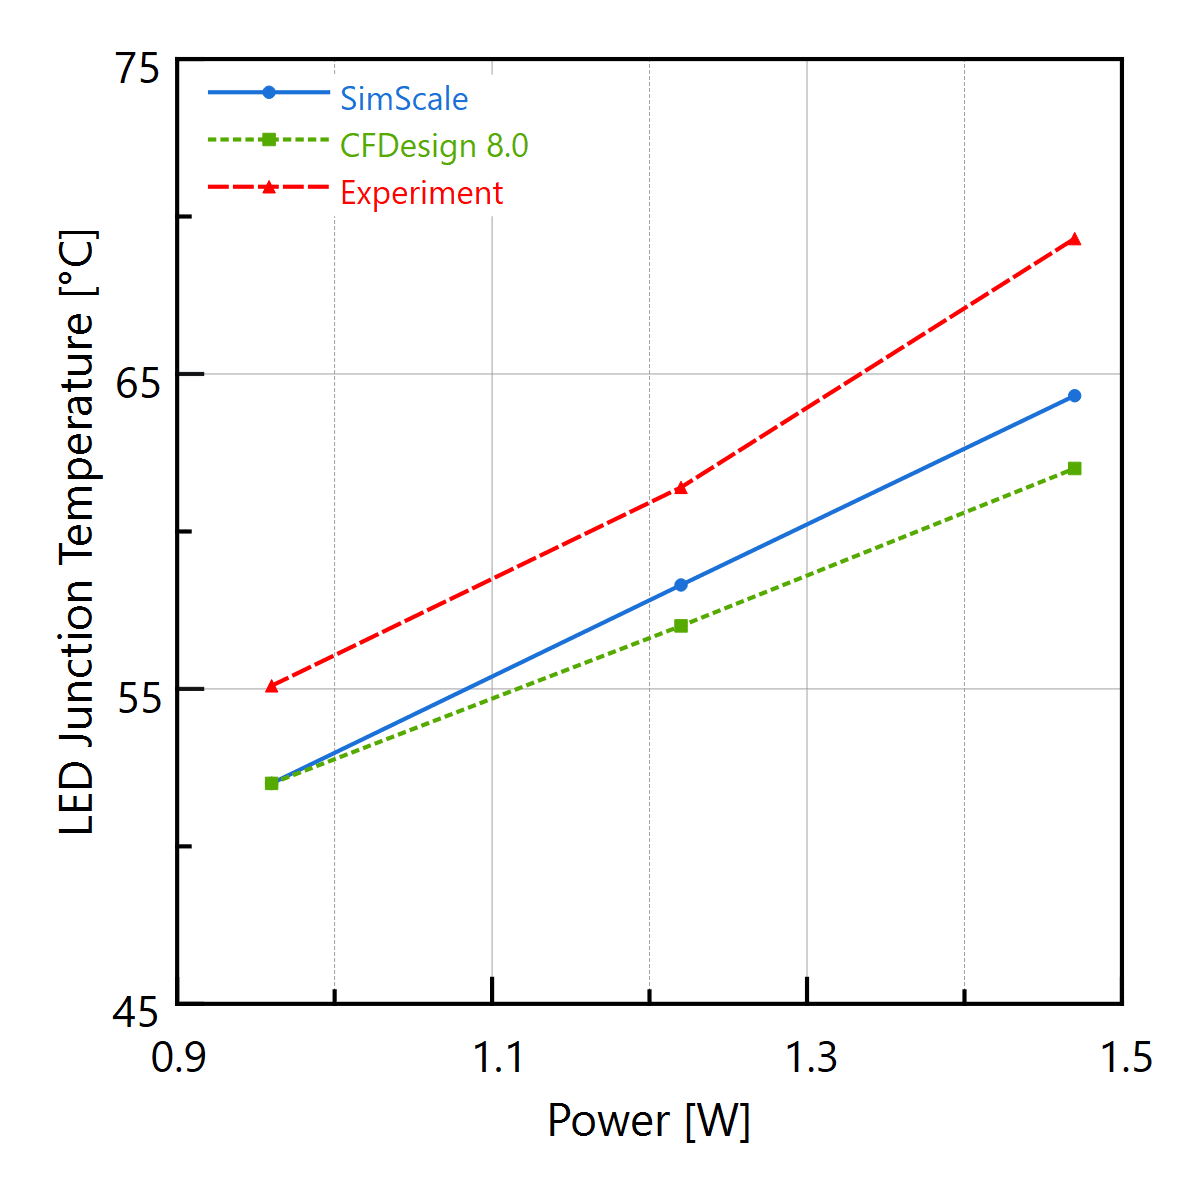
The simulation results from SimScale are compared against the CFD results and experimental results from [1]. The results for the temperature of the surface-junction between LED Chip and Chip Substrate in \(°C\), for various power inputs, are tabulated as follows:
| Power input \([W]\) | SimScale \([°C]\) | CFDesign 8.0 \([°C]\) | Experiment \([°C]\) | % Deviation SimScale | % Deviation CFDesign 8.0 |
| 0.96 | 52 | 52 | 55.1 | 5.63 | 5.63 |
| 1.22 | 58.3 | 57 | 61.4 | 5.03 | 7.17 |
| 1.47 | 64.3 | 62 | 69.3 | 7.23 | 10.53 |
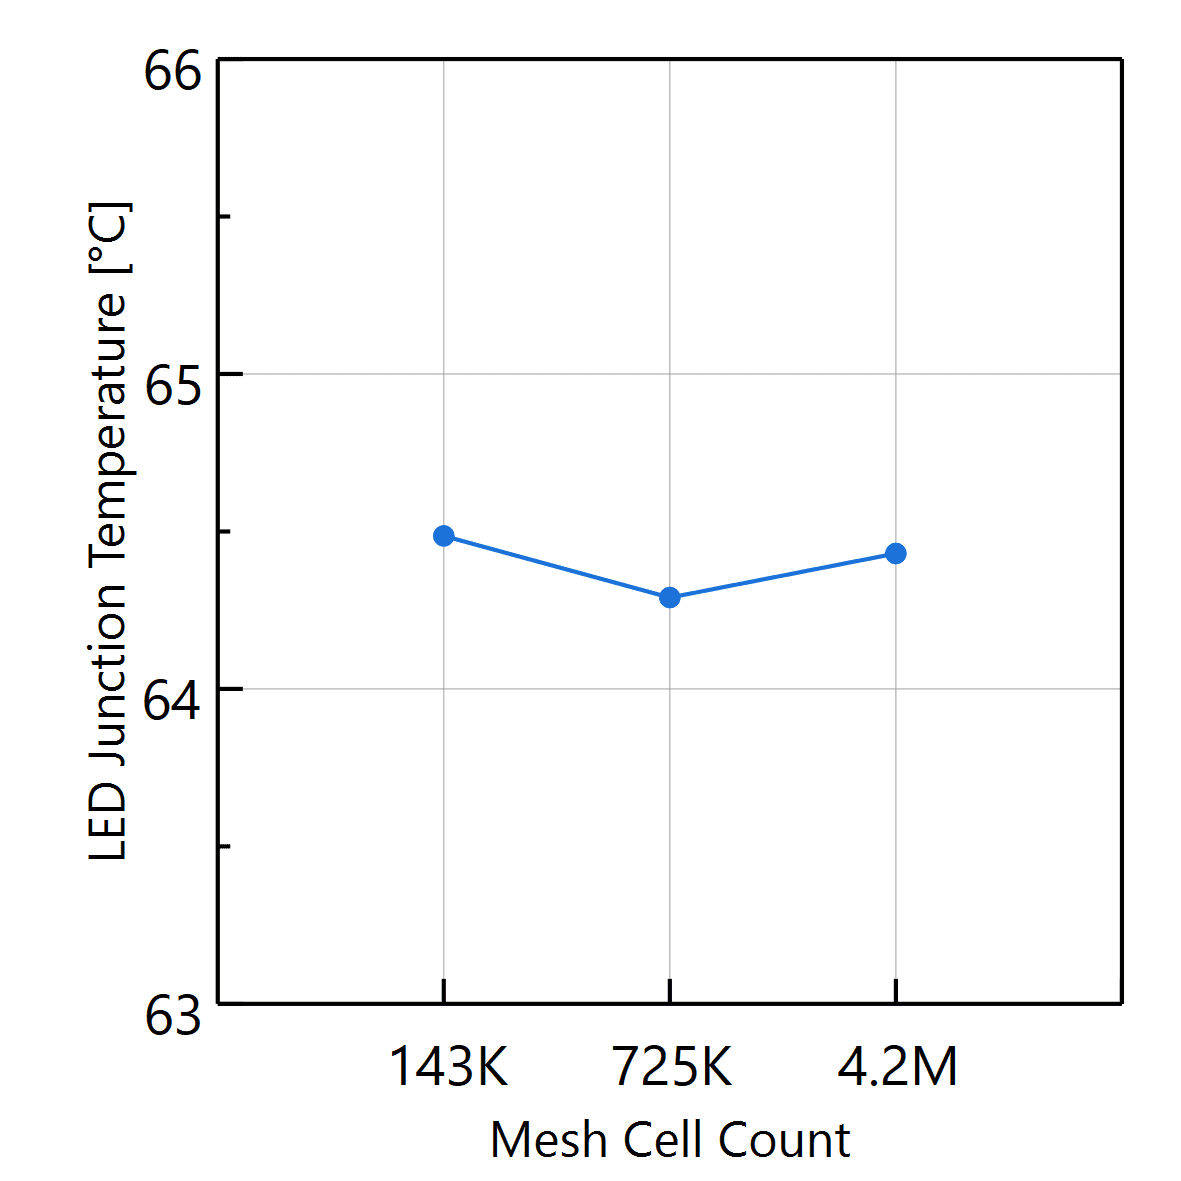
Mesh Sensitivity Study
For the power input of 1.47 \(W\), a mesh sensitivity study was also performed for meshes with a fineness of 0.5 (F0.5), 5.5 (F5.5), and 8.5 (F8.5). This study is plotted below:
LED Thermal Management: Conclusion
The discrepancy is likely due to the difference between simulation setup and physical testing environment. Unfortunately, full experimental details were not provided in the conference paper.
The following conclusion can be made from this LED performance thermal management validation case:
- Reasonable agreement with experimental trends
- Good agreement with alternate CFD software CFDesign 8.0
- Outperformed alternate CFD in % result deviation
Last updated: January 30th, 2026
Did this article solve your issue?
How can we do better?
We appreciate and value your feedback.


