Documentation
Lift and drag are aerodynamic forces that act on an aerofoil-shaped body moving through air. Airplanes are the most common application of lift and drag forces. In order to understand how airplanes take off and keep flying, we need to understand how lift, drag, and pitch can influence an airplane’s motion through air.
In this article, we will explore how airfoils generate lift using the airfoil theory and its application in airplanes and rotating machinery, such as wind turbines.
An airfoil is the shape of an object that is designed to generate lift during its motion through air. A cross-section of an airplane wing has the shape of an airfoil. It generates lift by creating a pressure gradient between the air above and below the wing.
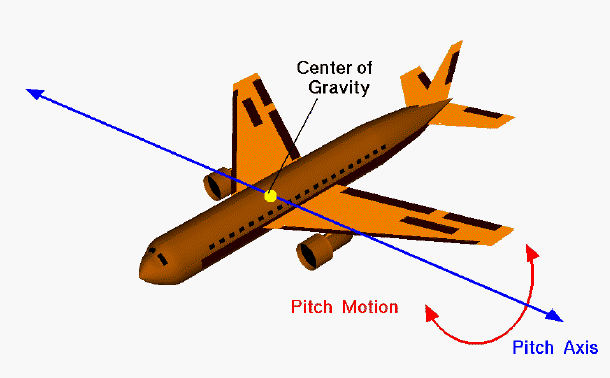
Consider the following figure of an airplane.
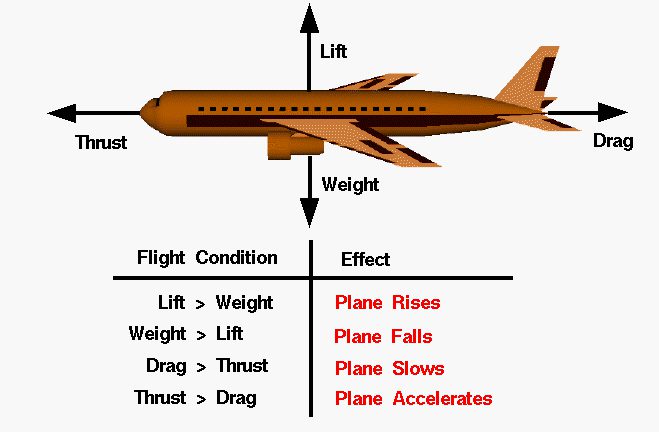
For an airplane in flight, the forces acting on it are its weight pulling it down and drag holding it back. Meanwhile, the airplane generates a thrust force to move forward and a lift force to counter its weight and keep flying.
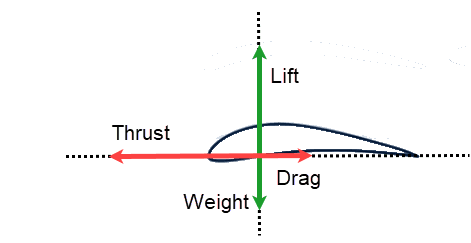
The airplane wing is made of several airfoils stacked along its axis. If we understand the physics of a single airfoil, we can understand the physics of the whole wing structure. Figure 2 shows the force distribution on a single airfoil. Notice the directions and magnitude of each force. In this state, the plane is able to accelerate and rise since thrust and lift and stronger than weight and drag, respectively.
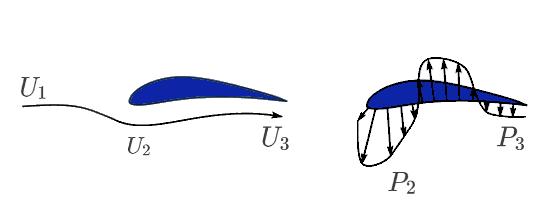
Consider a streamline, where state ‘1’ represents the state before interacting with the airfoil and state ‘2’ the state after interacting with the airfoil. Figure 3 shows the schematics for the associated variable terminologies:
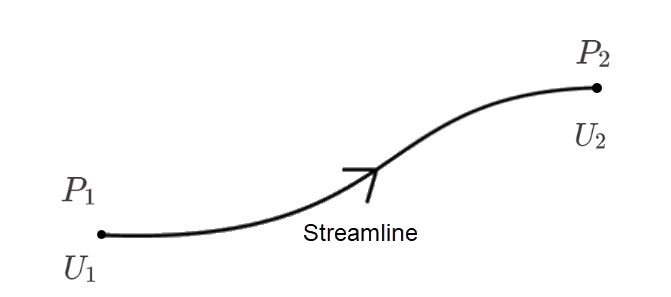
Applying Bernoulli’s equation along this streamline gives:
$$ P_2 – P_1 = – \frac{1}{2} \rho(U_2^{2} – U_1^{2}) \tag{1} $$
Where,
The shape of the airfoil is designed for different purposes. This allows the airfoil to have different fluid velocities along its length. The change in velocity leads to a change in pressure relative to the local atmospheric pressure according to Bernoulli’s equation.
These corresponding pressure loads act normal to the surface and can be integrated to give the total force exerted per unit surface area.
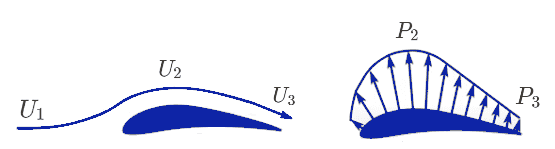
If we imagine the flow of air only over the top surface of the airfoil in 2D, we can see that the velocity accelerates around the curvature of maximum thickness. This means that velocity \(U_2\) would be more than the freestream velocity \(U_1\). Thus, the static pressure \(P_2\) would be less than the freestream pressure \(P_1\). This creates suction on the top surface and pulls the airfoil upwards, contributing towards lifting the airfoil (See Figure 4).
In a similar fashion, the pressure distribution on the bottom surface can be analyzed. For this particular airfoil, the flow around the leading edge accelerates, creating a suction pressure pulling it downwards. Further ahead, the flow decelerates, causing an increase in pressure. Since this pressure is higher than the local atmospheric pressure, it will act into the airfoil and, thus, contribute to the lift (See Figure 5).
Note that each airfoil will have a different flow pattern around it that solely depends on the shape of the airfoil.
This pressure distribution on both the top and bottom surface can now be integrated to give a total force vector \(\vec F\), whose perpendicular and parallel components to the flow provide lift and drag, respectively.
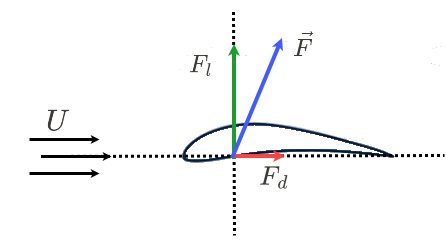
Lift is the component of the total force vector \(\vec F\) that works through the center of pressure of an object and is perpendicular to the incoming flow. For a zero angle of attack, it acts opposite to the weight (see Figure 1).
Lift is a mechanical force that is produced by the movement of an object through the air. Therefore, it has a magnitude and direction.
Lift force requires two things:
Lift is a function of the fluid density, the freestream velocity, and the reference area of the airfoil. It also involves a dimensionless quantity called Lift Coefficient, which is used to compare how different airfoils perform at varying shapes or speeds. Basically, the lift coefficient helps measure how an airfoil’s shape, inclination, and flow conditions affect its lift.
$$F_l = \frac{1}{2} \rho V^2 A C_l $$
Where:
Drag is the component of the total force vector \(\vec F\) that works through the center of pressure of an object and acts parallel to the direction of the incoming flow. For a zero angle of attack, it acts opposite to the thrust of the airplane (see Figure 1).
However, drag generates due to the velocity difference between the solid body and the fluid. Therefore, drag only generates when there is a relative movement between an object and a fluid. If one of those two does not exist, then there is no drag.
For a flying object, there are two important drag forces:
Note
The generation of wingtip vortices and the trailing of eddies is a 3D phenomenon. This is one of the reasons for why drag results differ between 2D and 3D simulation studies.
Drag is also a function of the fluid density, the freestream velocity, and the reference area of the airfoil. It involves another dimensionless quantity called Drag Coefficient, which helps measure an airfoil’s resistance in a fluid environment.
$$F_d = \frac{1}{2} \rho V^2 A C_d $$
Where:
The troubleshooting of errors related to the setting up of lift and drag coefficients in SimScale is discussed in the following knowledge base article:
Pitch is an up-and-down movement of the nose of an aircraft about an axis. This motion heavily influences the lift generated by the wings of the airplane.
Using Figure 7, imagine an axis along the trajectory between the end of one wing to the end of the other wing through the center of gravity. Consider the motion of the airplane around that axis.
Upward pitching will lead to an increase in the angle of attack (defined below), thus increasing the lift component of the total force (see Figure 10). This is because of the added downward deflection leading to an accelerated flow over the airfoil. The more upward movement there is, the larger the lift the wings generate. However, this continues to happen only up to a certain point, where stalling takes place (discussed below).
Figure 8 shows the schematics for the relation between pitching and angle of attack of an airfoil. Notice the change in the magnitude of the lift and drag forces as the angle of attack increases. Both forces increase in magnitude but not equally. The resulting lift-to-drag ratio increases as lift increases faster than drag.
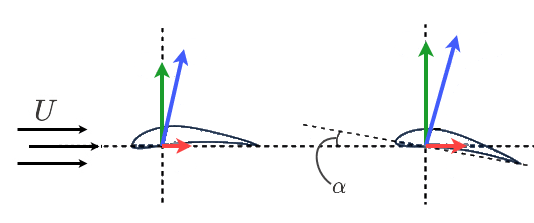
For an airfoil, the angle of attack is the angle between the incident freestream fluid and the chord line extending from the leading edge to the trailing edge.
The pitch angle, on the other end, is the angle made by the chord line with any reference plane. This reference plane can be a flat ground for a flying object or the plane of the rotor disk of a turbine.
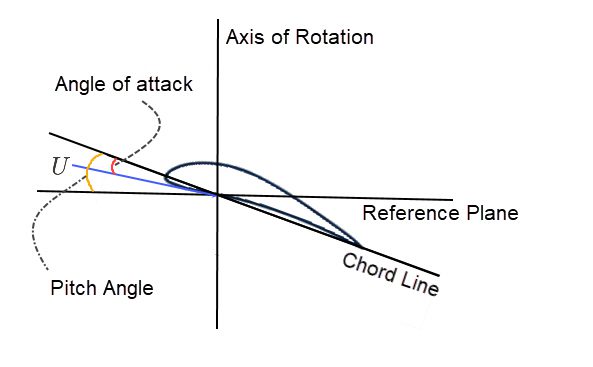
Depending on the reference plane, the angle of attack may be greater than, less than, or the same as the pitch angle.
An increase in the angle of attack causes the ratio of lift force to drag force to increase up to a certain point. Increasing the angle of attack beyond this point leads to a sudden decrease in lift and a sharp increase in drag, entering into a state of stall. This means the airplane cannot generate enough lift that can support the weight of the airplane, causing the plane to sink.
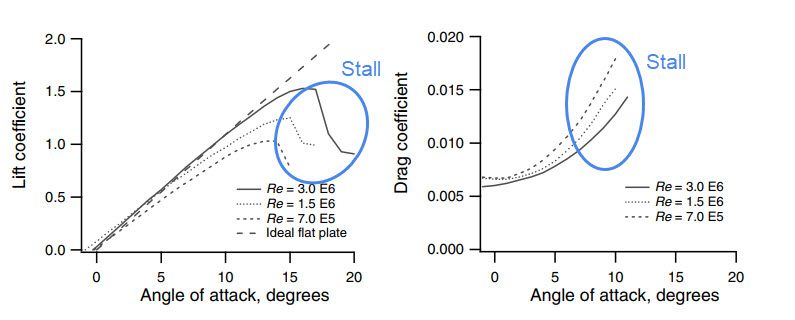
Airplanes should avoid stall at all costs, as this would mean an inadequate amount of lift force to balance the weight. The phenomenon of stalling can also be observed in compressors causing non-uniform blade rotation, which in turn slows down the rotor while also causing blade failure.
Join SimScale today!
If you have made it this far then you must be genuinely interested in the topic of lift, pitch, and drag. SimScale offers a variety of tutorials on aerodynamics alongside a tonne of public projects to refer to. A quick signup and and you will have access to all of that. Join SimScale today!
Horizontal- or vertical-axis rotating machinery consists of a rotor or impeller with a set of blades arranged in a symmetric fashion. This includes wind turbines, jet engines, centrifugal pumps, and compressors. Like airplane wings, these blades are also constructed from a set of airfoils.
Each airfoil has a different function. The ones closer to the root ensure structural rigidity, while the ones in the middle and towards the tip contribute mostly to the lift.
A major difference between airplanes and rotating machinery is that the airfoil in rotating machinery receives the wind/fluid velocity from two components: freestream fluid and blade rotation.
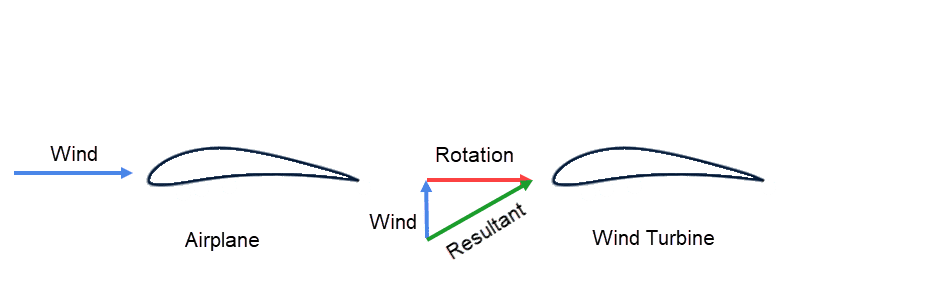
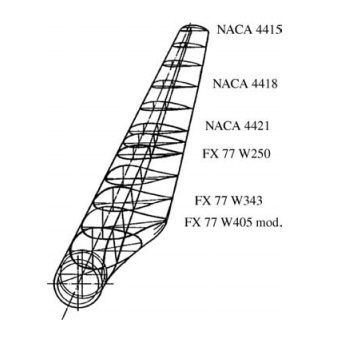
Consider a horizontal-axis wind turbine blade observed from the top in the plane of the rotor when the blade is at the bottom dead center. The wind approaches horizontally to the ground, and the rotation is clockwise. The top-view schematics for this scenario are shown in Figure 14. Notice how different airfoils are pitched at varying angles along the span of the blade.
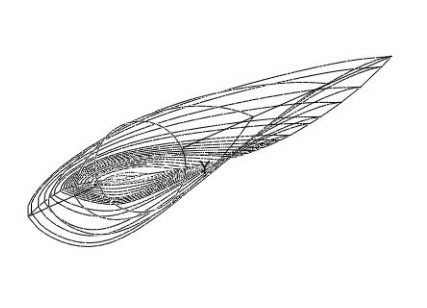
Each section of the blade has a different set of airfoils, meaning that each section serves a different purpose as previously discussed. The skeleton clearly shows how each airfoil has a different pitch angle. The ones close to the root/hub are heavily pitched, while the ones near the tip require less pitching. The explanation for this is given in the following section.
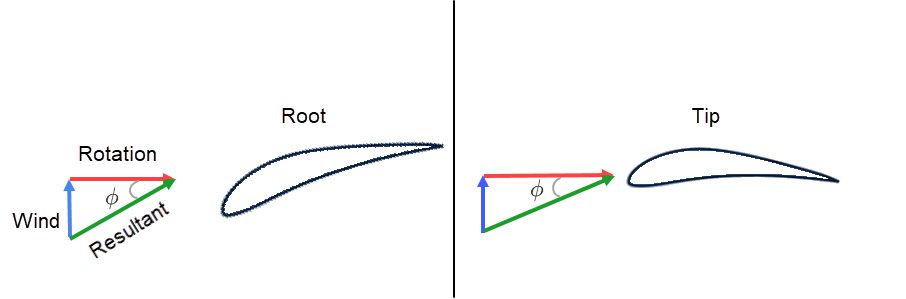
Flow angle \(\phi\) is the angle made by the resultant incident wind speed and the plane of the rotation. This flow angle will become lesser and lesser as we move from the root of the blade to the tip. This is because the tangential velocity near the root is lower than at the tip.
$$ \vec v = \vec \omega \times \vec r $$
Where:
A simple observation from Figure 16 tells us that this flow angle is a sum of the angle of attack and the pitch angle. Therefore,
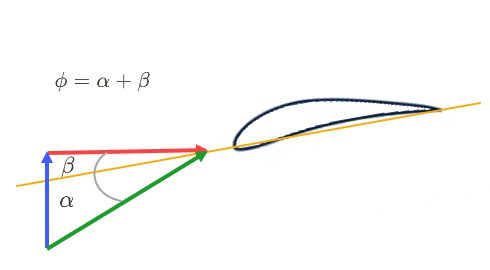
$$ \phi = \alpha + \beta $$
Where,
An increase in the angle of attack leads to stall, and therefore it becomes paramount to keep the angle of attack \(\alpha\) within the prescribed limits, especially at the root where the flow angle \(\phi\) is large. This is done by excessively pitching the airfoils near the root by increasing the pitch angle \(\beta\).
Did you know?
We can achieve increased efficiency in a Francis water turbine by reducing the separation region around the blade airfoils.
Check the following image that shows velocity characteristics on a plane cut through the spiral casing of a Francis turbine: 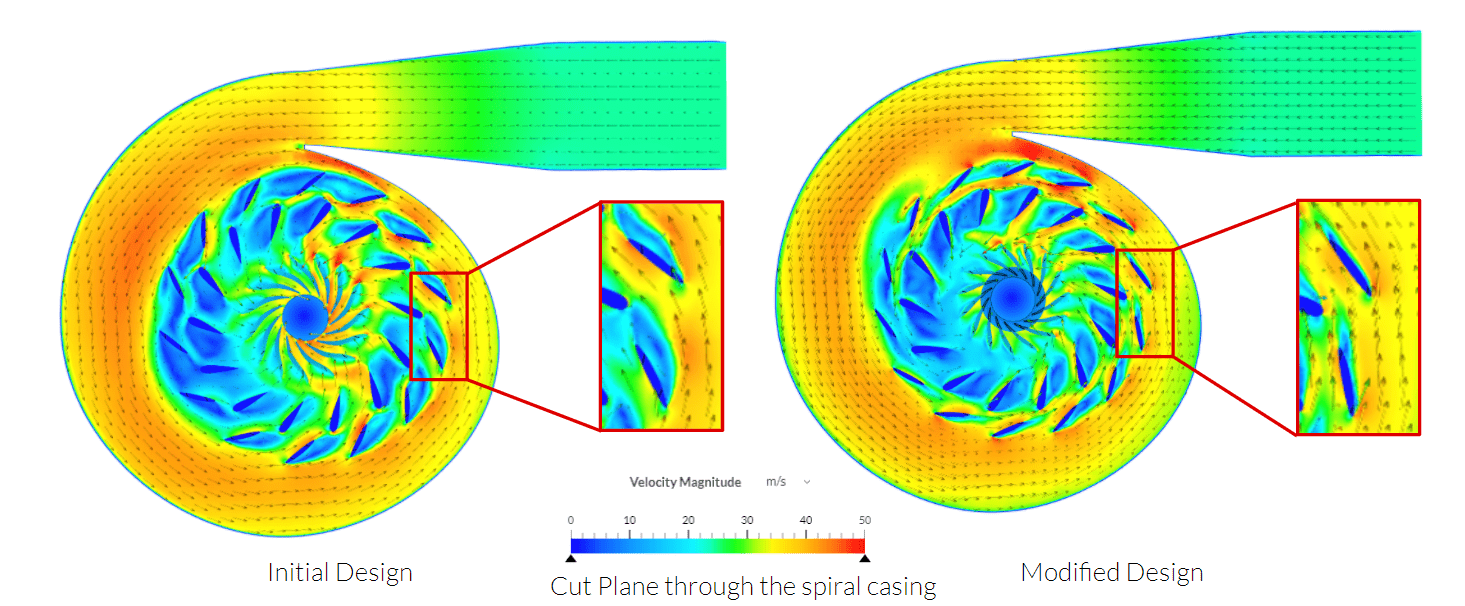
Observe the velocity vectors and magnitude contours in the turbine on the right. Changing the blade angle of the outer blades (stator) results in the reduction of the effective angle of attack (AoA). This reduces the separation (blue regions with low velocities) and the flow becomes attached.
To get more insights into this simulation refer to our demo and discussion series here.
SimScale allows its users to calculate lift and drag forces and lift, drag, and moment coefficients on specific surfaces of the geometry. This requires defining certain parameters like the reference length and area, freestream velocity, pitch axis, and some other important parameters. The setup is well documented in the following article
Important Information
If none of the above suggestions solved your problem, then please post the issue on our forum or contact us.
References
Last updated: September 1st, 2023
We appreciate and value your feedback.
What's Next
What is Drag Coefficient?Sign up for SimScale
and start simulating now