Validation Case: Flange Under Bolt Preload
This validation case belongs to structural analysis, with the case of a pipe flange under the effect of bolt preload. The aim of this test case is to validate the following parameters:
- Bolt preload boundary condition
The simulation results from SimScale were compared to test case results presented in [SSNV228]\(^1\).
Geometry
The geometry used for the case is shown below:
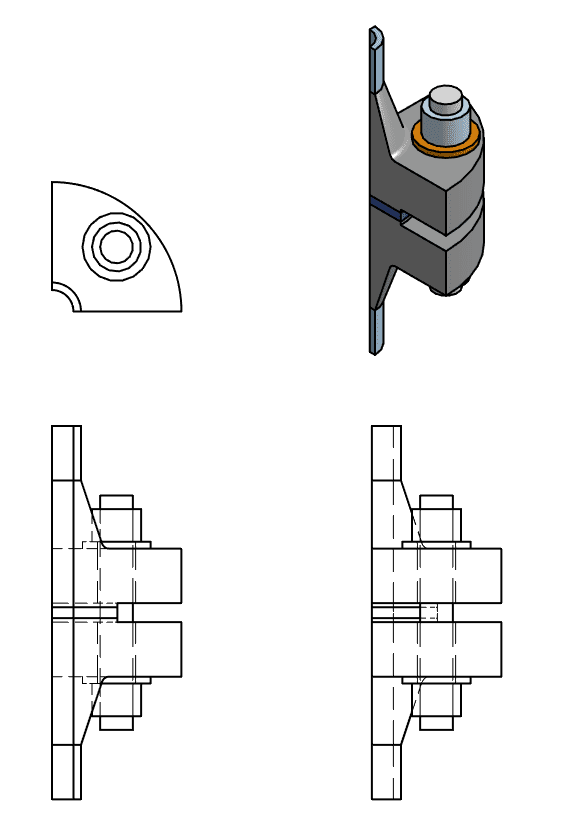
It represents a quarter section of a pipe bolted flange pair. The bolt shaft is simplified as a cylinder, as well as the nut. The model includes the pipe sections, flanges, a bolt, nuts, washers, and a gasket.
Analysis Type and Mesh
Tool Type: Code Aster
Analysis Type: Non-linear Static
Mesh and Element Types:
| Mesh Type | Number of Cells | Number of Nodes | Element Type |
|---|---|---|---|
| Standard (structured) | 50210 | 62344 | 1st Order Hexahedrals and Pyramids |
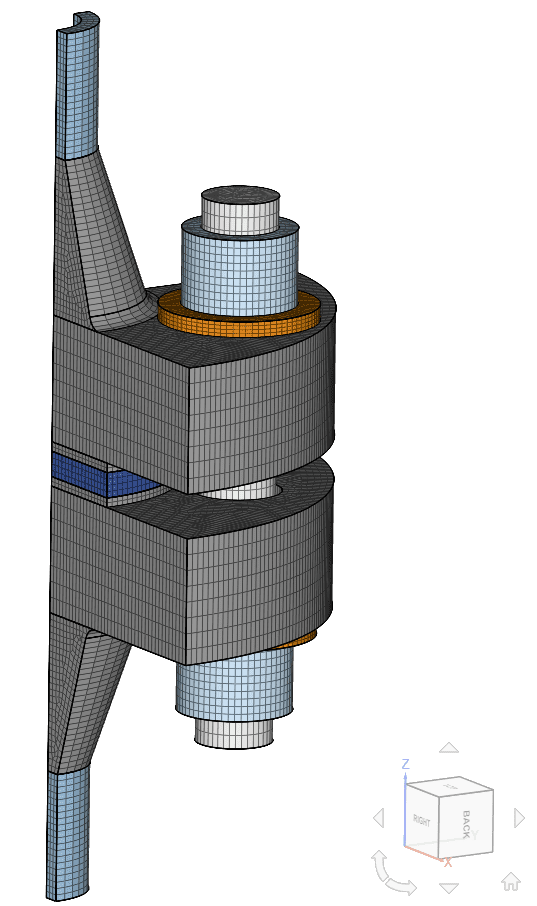
The mesh was computed using SimScale’s Standard Mesher algorithm. To optimize the performance of the FEA model, Sweep meshing refinement was used on the different parts, resulting in a structured mesh. Such a mesh consists of mapped hexahedral and pyramid elements, as can be seen in the figure:
Simulation Setup
Material:
- Elastic Modulus \(E = \) 200 \(GPa\)
- Poison’s ratio \(\nu = \) 0.3
Boundary Conditions:
- Constraints:
- Symmetry plane on the XZ plane faces
- Symmetry plane on the YZ plane faces
- Symmetry plane on pipe end faces
- Contacts:
- Bonded contact between the pipes and flange necks
- Bonded contact between the flange faces and washers
- Bonded contact between the washers and nuts
- Bonded contact between the nuts and bolt shaft
- Physical contact between the flanges and seal ring
- Load:
- Bolt preload of 3393 \(N\)
- Pressure on internal pipe, flange and seal faces \(P = \) 1e-6 \(Pa\), automatically ramped from zero to the maximum value.
Reference Solution
The reference solution is of the numerical type, as presented in [SSNV228]\(^1\). It is given in terms of the mean stress on the bolt shaft:
$$ \sigma_{bolt} = 30\ MPa $$
Result Comparison
Comparison of the axial bolt stress \(\sigma_{ZZ}\) at a point data result control item located on the bolt shaft with the theoretical solution is presented below:
| FIELD | COMPUTED | REF | ERROR |
|---|---|---|---|
| \(\sigma_{ZZ}\) \((SIZZ)\) \([MPa]\) | 30.3135 | 30.0 | 1.05 % |
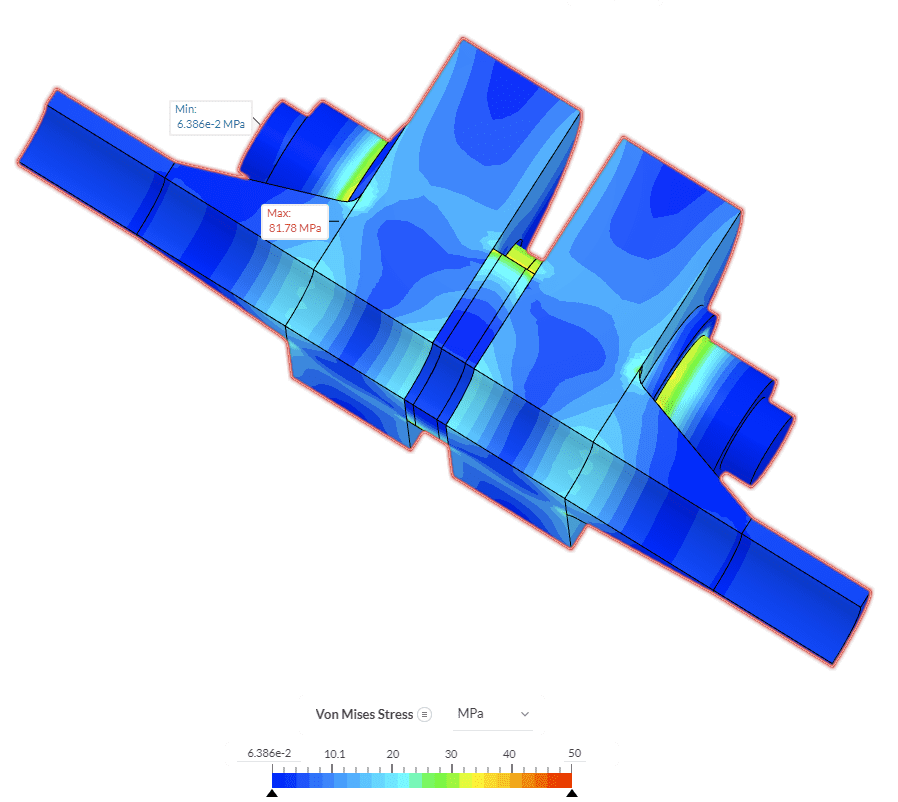
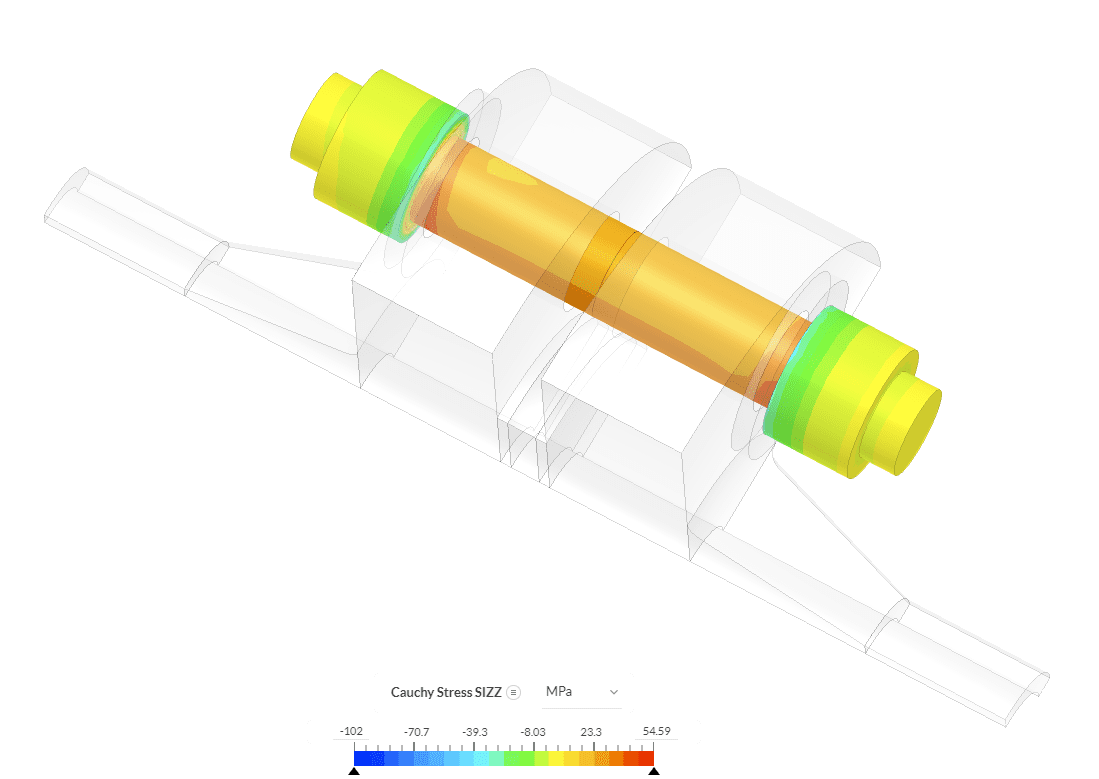
Illustration of the deformed shape and stress distribution on the flange under bolt preload condition is presented in Figure 3, while the overall distribution of the axial stress on the bolt \(\sigma_{ZZ}\) is presented in Figure 4:
Note
If you still encounter problems validating you simulation, then please post the issue on our forum or contact us.
Last updated: March 1st, 2023
Did this article solve your issue?
How can we do better?
We appreciate and value your feedback.


