Surface Data
The Surface data result control item calculates statistics of result fields over the specified faces of the CAD model, such as average value or surface integral. The settings panel appears as follows:
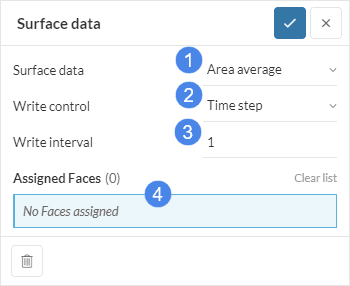
The parameters to be specified in the settings panel for the surface data calculations are:
- Surface data: Select the type of computation to perform, between Area average and Area integral (see below for details).
- Write control: Control how you want the results to be written in the output:
- Time step: It corresponds to the value of Delta t in the simulation control settings panel for fluid flow analysis.
- Synchronize with field output: The output will synchronize with other Write control types specified under simulation control for fluid flow analysis.
- Write interval: Specify the number of Write control intervals to be skipped between two successive writes of results. For example, a write interval value of 3 for a time step length Delta t of 2 seconds means that the results will be written every 3 x 2 = 6 seconds.
Tip
To evaluate the numerical convergence of a result field, writing intervals up to 20 is sufficient. It’s important to have enough data points to visualize the convergence patterns, so defining large values for the write interval is not recommended in this case.
Available Computations
The available surface data statistics are computed as follows:
Area Average
This function calculates the average of the scalar result variable over the assigned face. If the result field is vectorial, the average is reported for each component. The user can choose several faces to run the operation on, and the statistic will be computed over all of them separately.
For instance, for an example scalar quantity \( p \), the average is weighted and normalized using the cell surface areas:
$$ \bar{p} = \frac{1}{A} \int_{S} pdA \tag{1}$$
Where \(A\) is the surface area of the set of assigned faces \(S\). This value is computed numerically over the surface mesh cells:
$$ \bar{p} = \frac{1}{A} \sum_{i} p_i A_i \tag{2}$$
Area Integral
This function calculates the integral of the scalar result variable over the assignment. If the result field is vectorial, the integral is computed for each component. The user can choose several faces to run the operation on, and the statistic will be computed over all of them separately.
For our example, analyzing integrals of velocity \(u\):
$$ Q_u = \int_{S} udA \tag{3}$$
This value is again computed numerically:
$$ Q_u = \sum_{i} u_i A_i \tag{4}$$
Pressure Difference
The pressure difference result control is currently available for the Multi-purpose analysis type, allowing users to obtain pressure differences between a pair of faces.
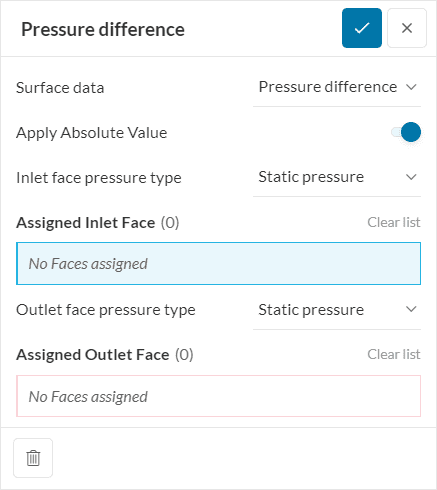
Furthermore, the user can choose to analyze static or total pressures when calculating the pressure differences. When Apply Absolute Value is toggled on, the platform ensures a non-negative pressure difference result, which is a useful option when the pressure difference is assumed to be a pressure drop.
As far as formulations go, the pressure levels are based on area-weighted averages, as outlined in Equations 1 and 2 above.
Important
A single inlet and a single outlet face can be assigned for each pressure difference result control.
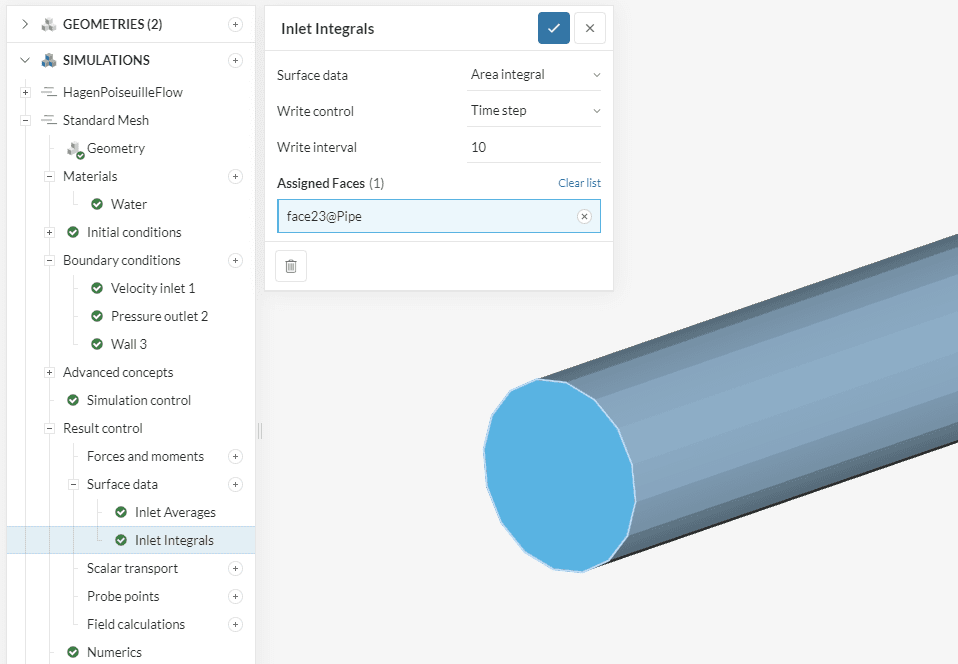
Example Application
To visualize the application of the Surface data control items, let’s take the example of a pipe flow simulation, with statistics to be computed at the inlet face:
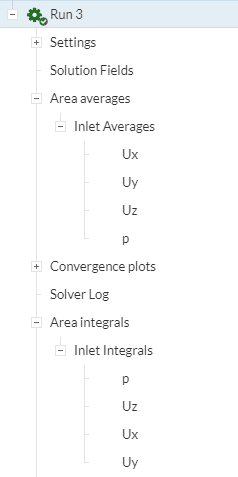
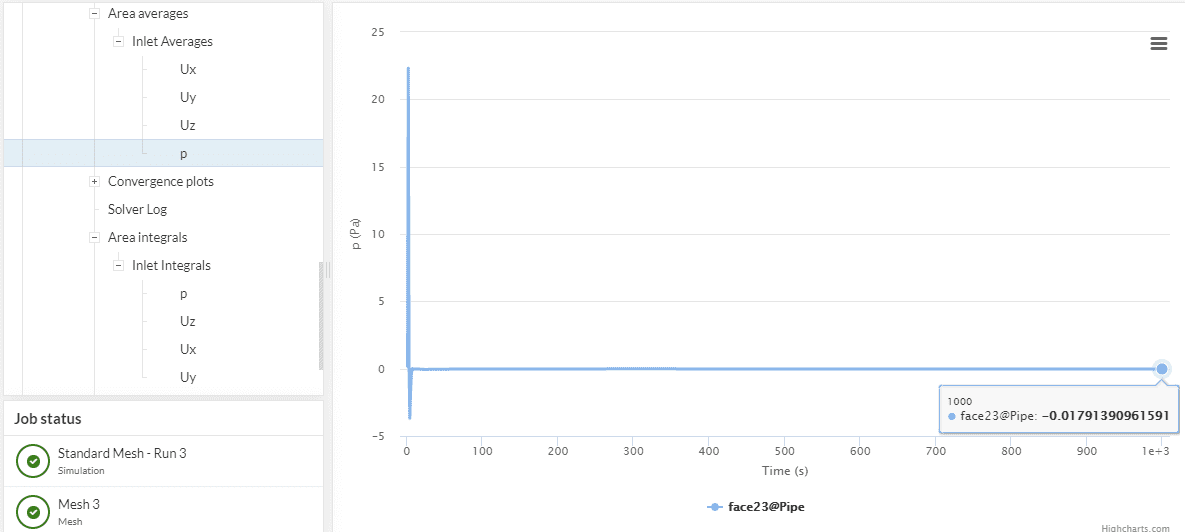
After the run is complete, we have the computed values available in the simulation tree:
We use the surface data to compute two quantities: the average pressure at the inlet, which is useful to compute the pressure drop across the pipe, and the flow rate. First for the pressure:
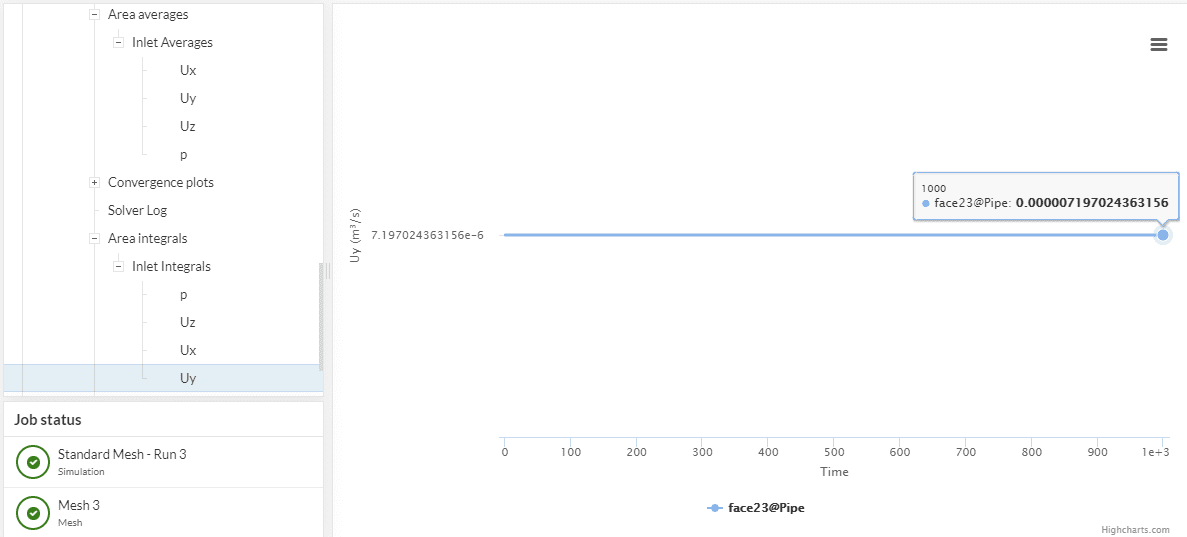
Second, for the flow rate we select the integral of Uy, the y-component of the flow velocity field:
Related Tutorials
The following are some of our tutorials where you can practice the use of the surface data result control item:
- Fluid Flow Through a Non-Return Valve
- Fluid Flow Simulation Through a Centrifugal Pump
- Compressible Flow Simulation Around a Wing
Last updated: August 13th, 2024
Did this article solve your issue?
How can we do better?
We appreciate and value your feedback.


