Documentation
The phenomenon of flow reattachment over a backward-facing step is a classic case in fluid mechanics. For this case, the following parameters have been validated:
The simulation results obtained through SimScale are compared against the experimental results of Driver and Seegmiller\(^1\).
The geometry used for validation is as shown in Figure 1. It has a backward-facing step with a height \(h\) of 0.0127 \(m\) at 1.5 \(m\) from the inlet face A.
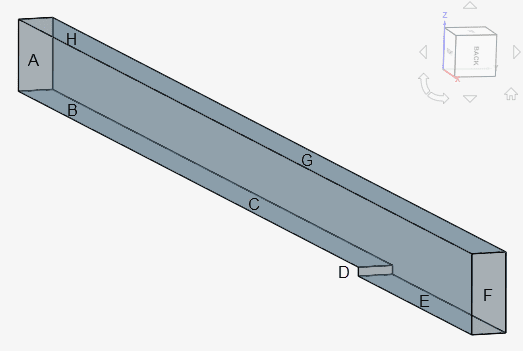
The minimum and maximum limits in the spatial directions are tabulated as follows:
| Spatial direction | Minimum \([m]\) | Maximum \([m]\) |
| x | -1.5 | 0.5 |
| y | 0 | 0.1143 |
| z | 0 | 0.05 |
The faces and their respective boundary types\(^2\) are mentioned in Table 2:
| Face(s) | Type |
| A | Inlet |
| B+H (upto 0.3867 \(m\) from A ) | Symmetry |
| C+D+E+G | Walls |
| F | Outlet |
Tool Type: OpenFOAM®
Analysis Type: Incompressible steady state flow
Turbulence Model: k-omega SST
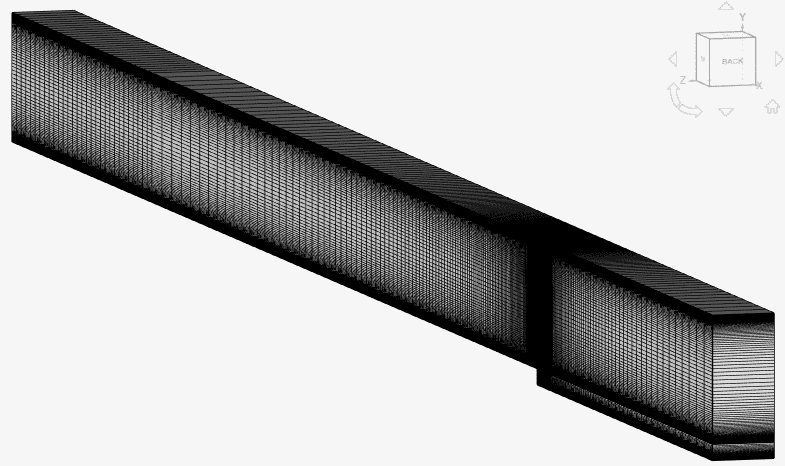
Mesh and Element Types:
The blockMesh tool was used to generate the hexahedral mesh locally and imported to the SimScale workbench. A single-cell width was assigned in the z-direction to ensure a 2D mesh.
The mesh near the walls is resolved for \(y^+\) > 30 meaning the first cell away from the wall lies in the logarithmic region. Read more about how to calculate y-plus (\(y^+\)) value here.
Note
The \(k-\omega\) SST turbulence model was chosen, with wall functions for the near-wall treatment of the flow.
| Mesh type | Number of cells | Element type |
| blockMesh | 550000 | 2D Hexahedral |
The mesh can be seen below.
Fluid:
Boundary Conditions: Using the Custom boundary condition feature in SimScale. the parameters at the boundaries (Table 2) were set to the following values:
| Parameter | Inlet | Symmetry | Walls | Outlet |
| Velocity \([m/s]\) | 44.2 | Symmetry | No slip | Zero Gradient |
| Pressure \([Pa]\) | Zero Gradient | Symmetry | Zero Gradient | 0 |
| \(k\) \([m^2/s^2]\) | 5.366 | Symmetry | Wall Function | Zero Gradient |
| \(\omega\) \([s^-1]\) | 182.399 | Symmetry | Wall Function | Zero Gradient |
The comparisons for velocity, pressure coefficient, and the reattachment length were made between the experimental values\(^1\) and the simulation results from SimScale.
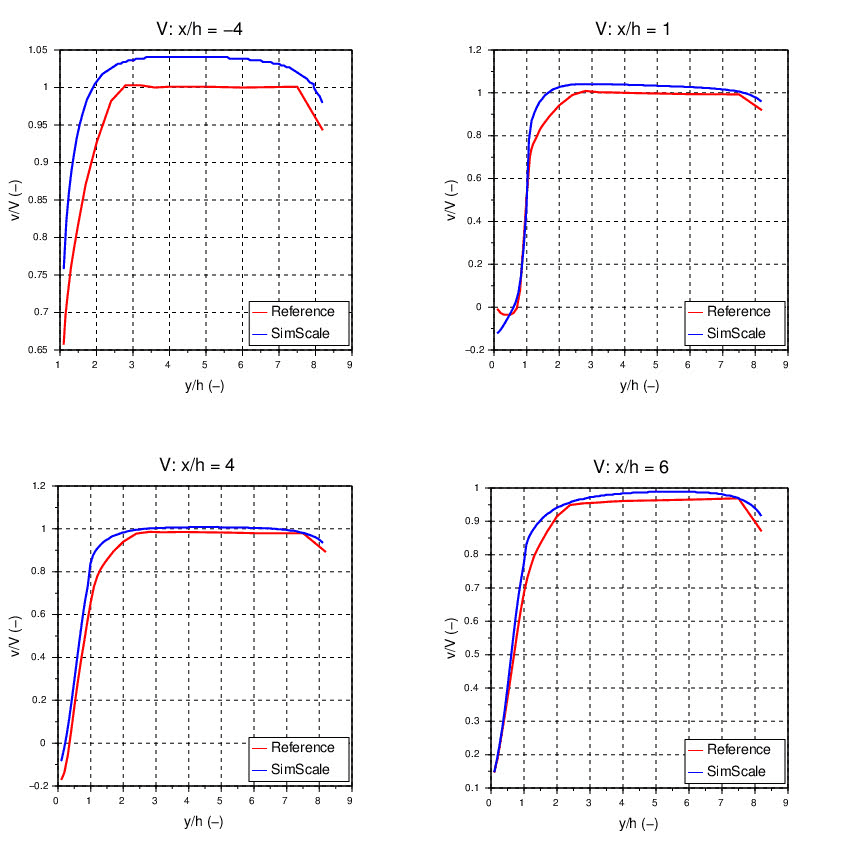
Velocity Profiles
Velocity profiles are compared across the domain height, normalized with the step height \(h\), at different distances into the domain. All distances have been normalized with \(h\) too while the velocity is normalized with respect to the inlet velocity 44.2 \(m/s\).
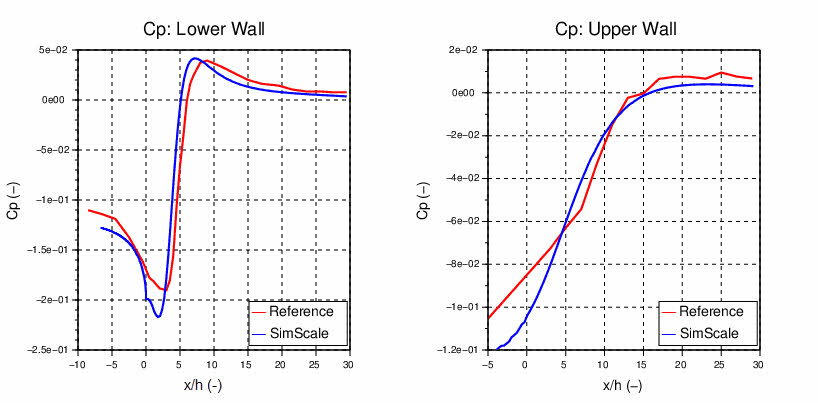
Coefficient of Pressure
Shown below, in Figure 4, is the comparison of the coefficient of pressure \(C_p=\frac{P−P_∞}{\frac{1}{2}ρV^2_∞}\) with respect to the normalized distance from the inlet, obtained from the SimScale simulation with the experimental ones\(^1\) at the lower (faces C+D+E) and upper walls (face G).
Reattachment Length
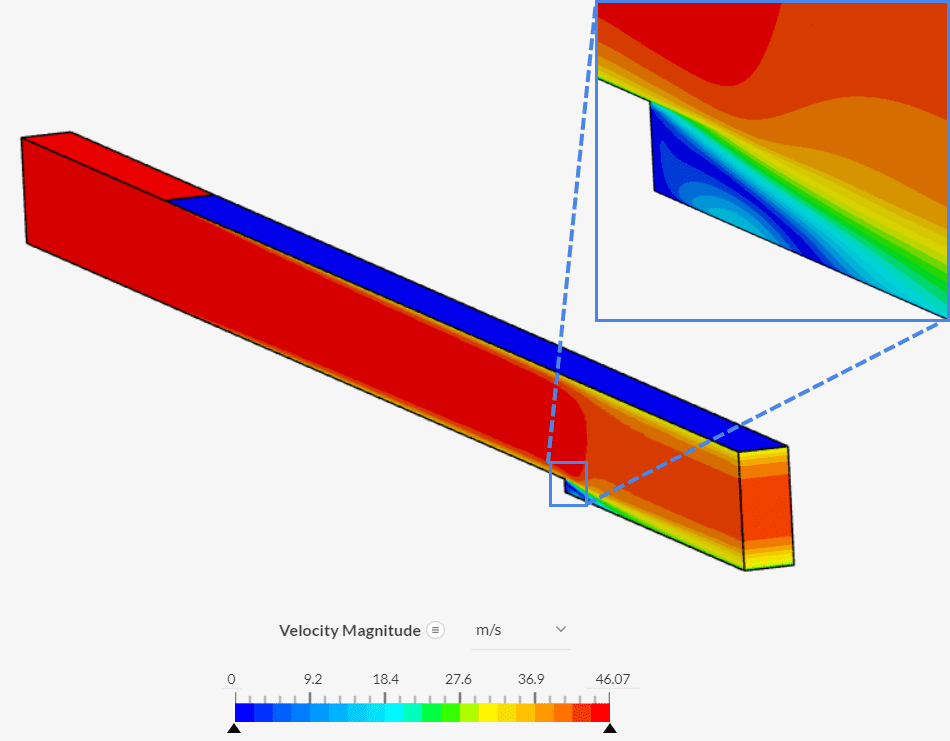
The reattachment length is the distance from the step at which the flow resumes in the positive flow direction all over the cross-section. Using the SimScale post-processor with the velocity vectors, checking the cell-velocity values for the reattachment length was calculated to be 6.84477 \(cm\), which lies within a 12% error limit of the experimental value\(^1\) of 7.74 \(cm\).
A good look into the velocity contours, as observed in the SimScale post-processor, shows the reattachment region (blue) where the velocity is in the opposite direction of the dominant flow. This appears due to sudden change (step) in the geometry.
References
Last updated: September 4th, 2023
We appreciate and value your feedback.
Sign up for SimScale
and start simulating now