What does “All velocity”, “All velocity [node]”, “Pressure_e”, and “Pressure_n” stand for? In this article, we will answer the potential questions regarding the format and meanings of scalar names in the SimScale post-processor.
Solution: Scalar Names
The following table shows some scalar names you will see in the post-processor. This is a brief list only. In addition, you will see the combination of ‘scalar_name’ + ‘[node]’ and ‘axis_name’ + ‘velocity’ + ‘[node]’.
| Scalar Naming | Explanation |
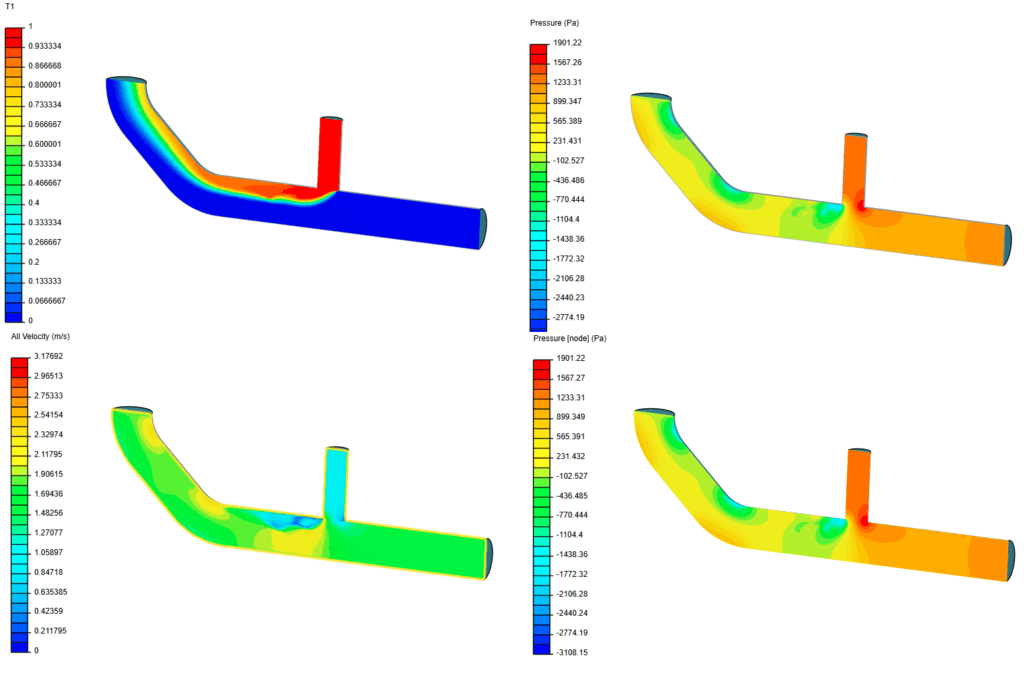
| T1 | Passive scalar value |
| X Velocity (m/s) | Velocity component of x-axis |
| All Velocity (m/s) | Magnitude of the velocity vectors of x, y, and z (Cell value) |
| All Velocity [node] (m/s) | Magnitude of the velocity vectors of x, y, and z (Node value) |
In Incompressible (LBM) and Pedestrian Wind Comfort (PWC) analysis types, a similar naming convention is used.
| Scalar Naming | Explanation |
| Pressure_e (Pa) | Pressure (Cell value) |
| Pressure_n (Pa) | Pressure (Node value) |
Cell and Node Values
What do cell value and node value stand for? Let’s check the following examples:
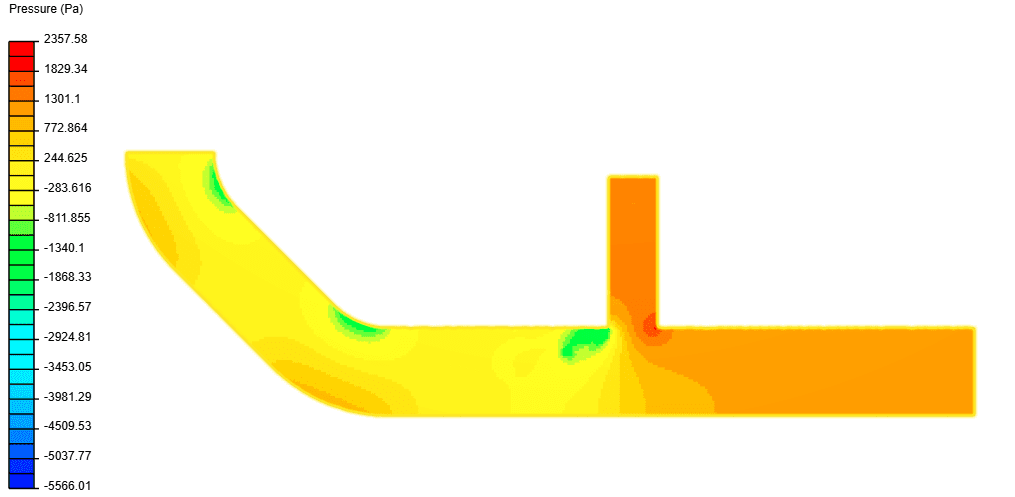
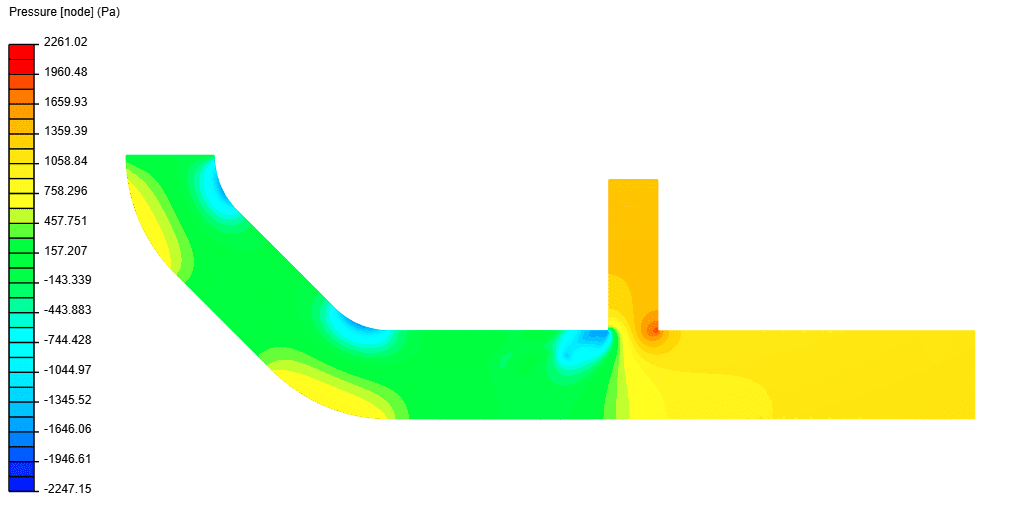
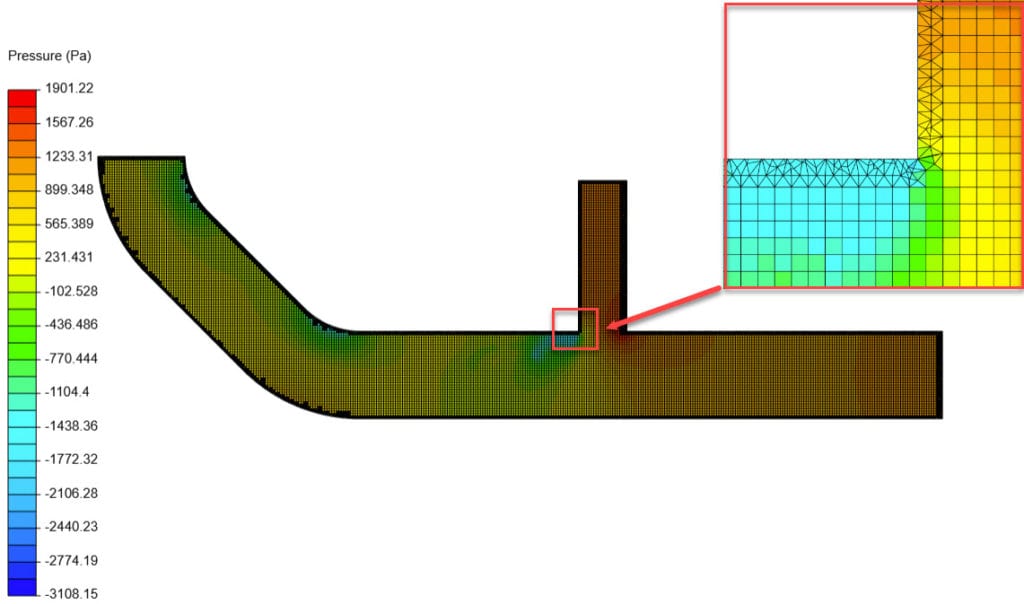
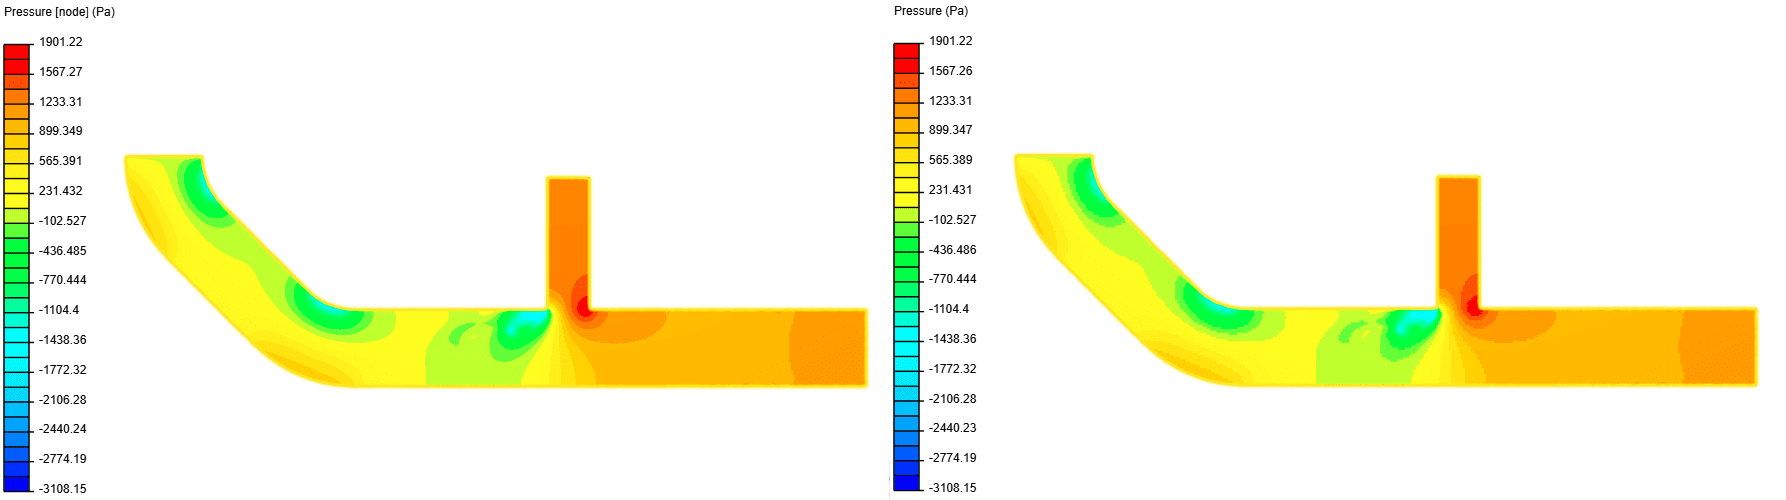
Both images show the pressure distribution on the mid-cross section of a pipe model. The first image looks as if pixelated. Because Pressure (Pa) scalar shows cell values. This is a coarse mesh, therefore we see sudden pressure transition. In a fine mesh, the transition would be smoother.
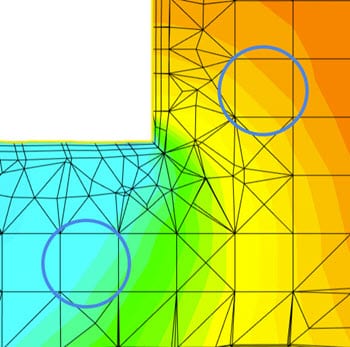
If you zoom-in to the pipe junction, you will see that the pressure contour is smoother on node values. This is because the gradient is interpolated between the nodes (node is simply a corner of a cell). In cell values representation, contours are generated with respect to the individual value of the cell.
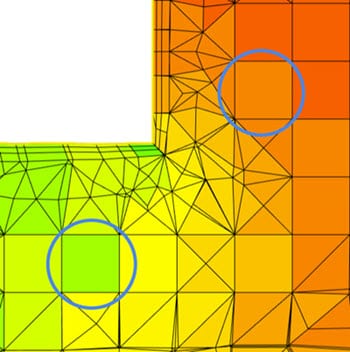
In order to capture the flow effects more accurately, it is advised to reduce the element size until the cell size has no more influence on the results. The following articles can help to teach meshing and mesh visualization:
- Article-1: How to visualize the internal mesh using mesh clip?
- Article-2: How to Define Dimensions of Refinements During Meshing
- Article-3: How to Control, Observe and Analyze Y+ during the Meshing, Simulation, and Post-Processing
Compare Node and Cell Values to Judge the Mesh Quality
Ideally, reduce the element size until the results from cell values are equal to node values.
Note
If none of the above suggestions solved your problem, then please post the issue on our forum or contact us.


