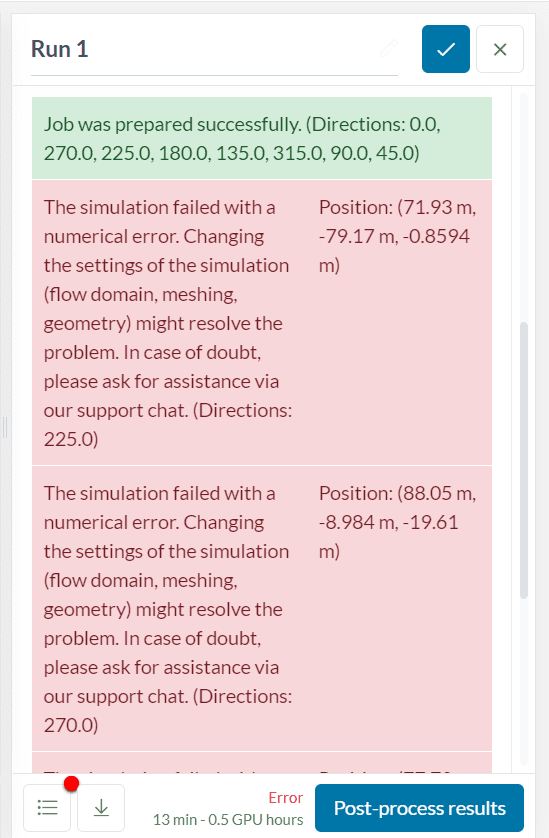
Error
The simulation failed with a numerical error. Changing the settings of the simulation (flow domain, meshing, geometry) might resolve the problem. In case of doubt, please ask for assistance via our support chat.
What Happened?
In a pedestrian wind comfort (PWC) analysis, simulations are often performed with respect to multiple wind directions. If a PWC simulation fails, first check the Event Log, which is located under the simulation run. In the error message, you can see the list of successful individual runs highlighted with green and failed individual runs highlighted with red color. This means that the simulation failed for a particular wind direction/s. This is a general numerical error, which could happen due to several reasons.
What Could Be the Possible Reason/s for PWC Simulation Fails?
Usually, a PWC simulation fails due to the nonphysical flow behavior such as air leaking under the terrain. The CAD model and the flow field are the main reasons for nonphysical flow behavior. The failure typically happens:
- If the wind tunnel size is larger than or equal to the terrain boundaries.
- If the terrain is not watertight. In this case, if the cell size in of mesh is smaller than a hole (means an opening on the terrain).
- If the hole/opening is facing a particular wind direction.
What Can I Do Now?
In the following section, you will see the several possible reasons for PWC simulation fails and how to fix them.
1. Region of Interest
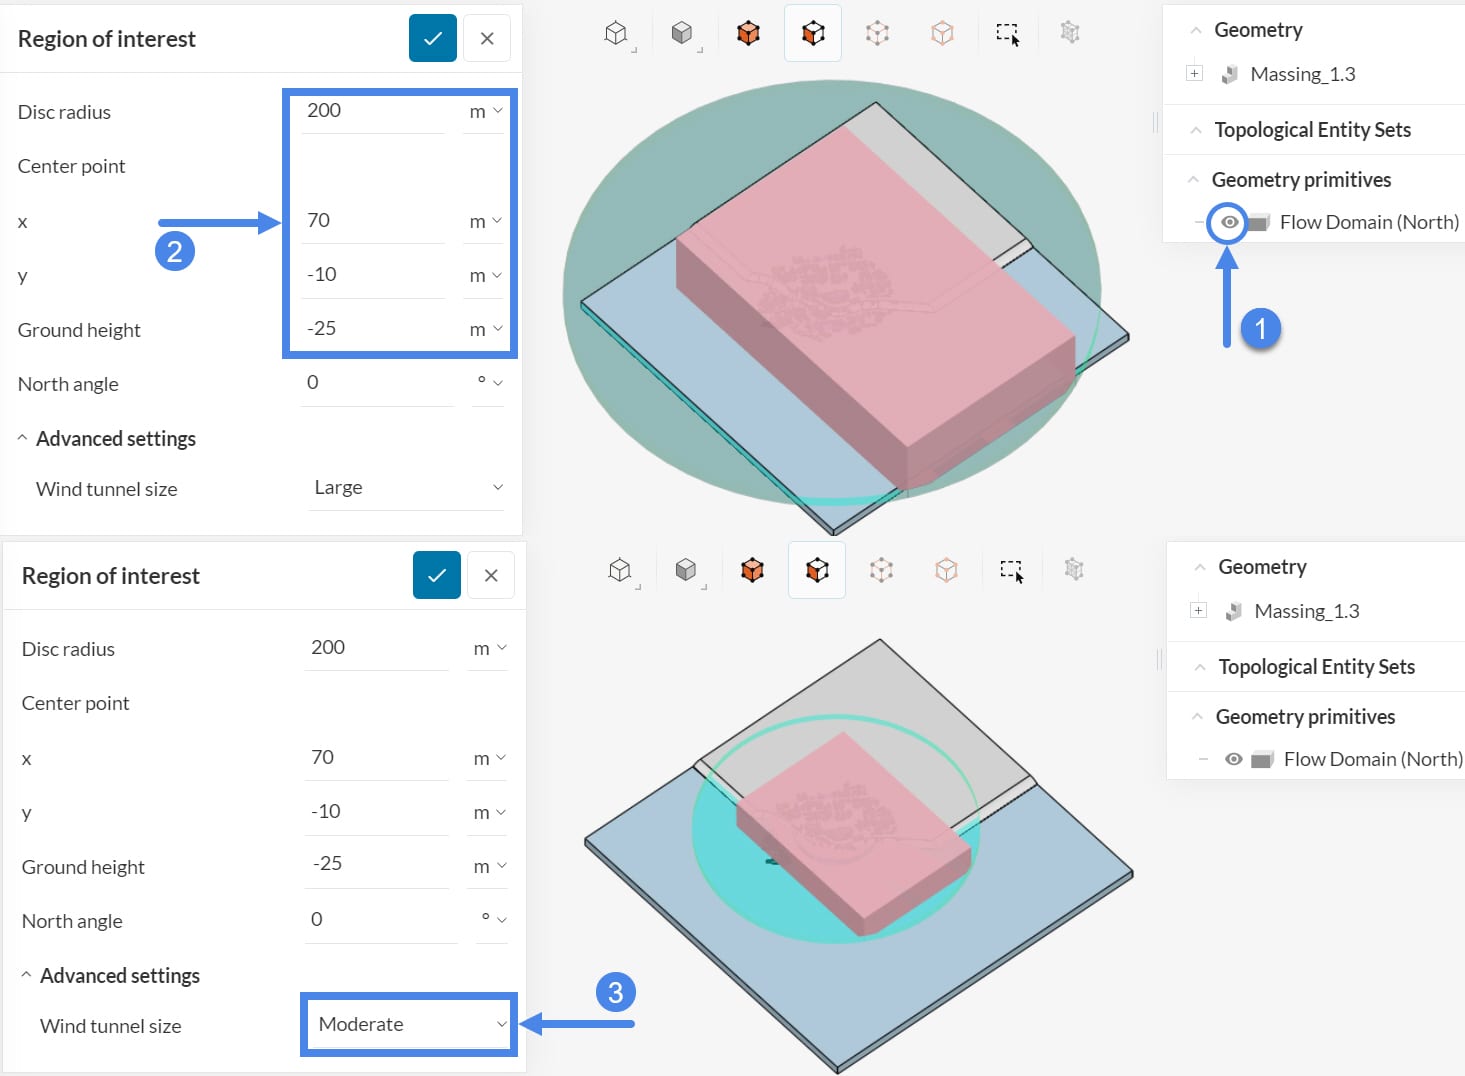
Flow region is generated inside the virtual wind tunnel. The default Moderate and Large wind tunnel sizes are calculated with respect to the disc radius. If the wind tunnel is larger than the terrain boundaries, flow in the upstream will either hit the terrain boundaries (if the terrain has a thickness) and/or separate to the above and below the terrain. This can cause PWC simulation fails. Check whether your terrain boundaries are fully covering the virtual wind tunnel or not:
- Firstly, visualize the Flow Domain, which is located on the right frame. You will see a pink box and a green disc. The pink box represents the virtual wind tunnel. In a typical PWC simulation, you will simulate multiple wind directions. The green disc represents the circumferential area, which the wind box will cover during the simulation of other wind directions. Ensure the green disc to be fully inside the terrain boundaries.
- Secondly, you can change the settings of Region of Interest to change its position or size. As stated before, the Disc Radius changes the default wind tunnel sizes.
- Moreover, if the Moderate wind tunnel size is still too big for the terrain, you can manually control it by choosing Custom.
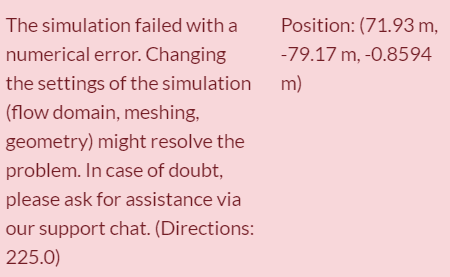
2. Locate the Position of the Error
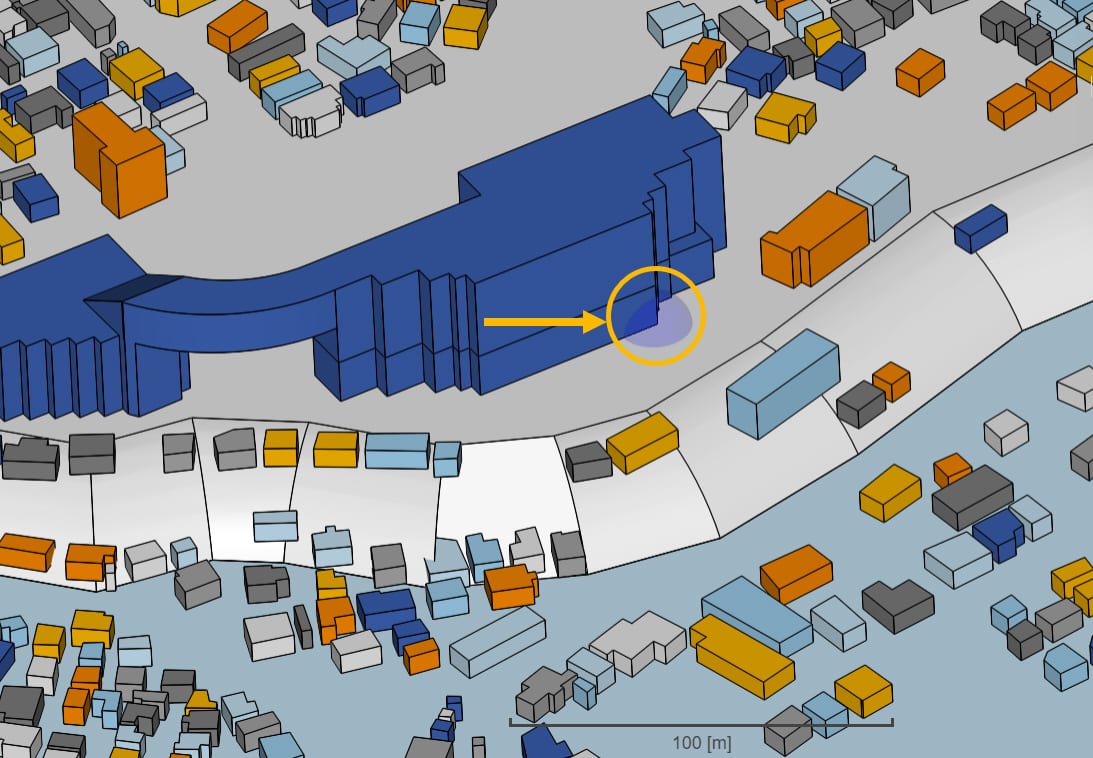
Under the Event Log, check the error message. The message shows the direction (225.0 degrees in this example) and the position (71.93 \(m\), -79.17 \(m\), -0.8594 \(m\)) coordinates of the point, in which the simulation failed.
You can use a Local sphere geometry primitive to mark the coordinates. This will help to visualize the location where the simulation failed.
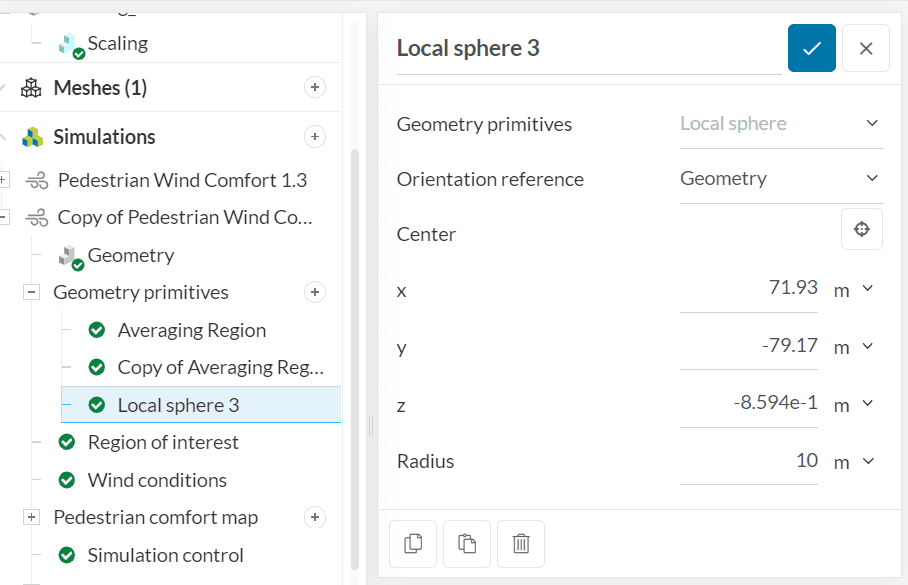
This does not mean that the point will show you where the CAD error is located, but it will often be somewhere close.
3. Check the Additional Results of a Successful Run
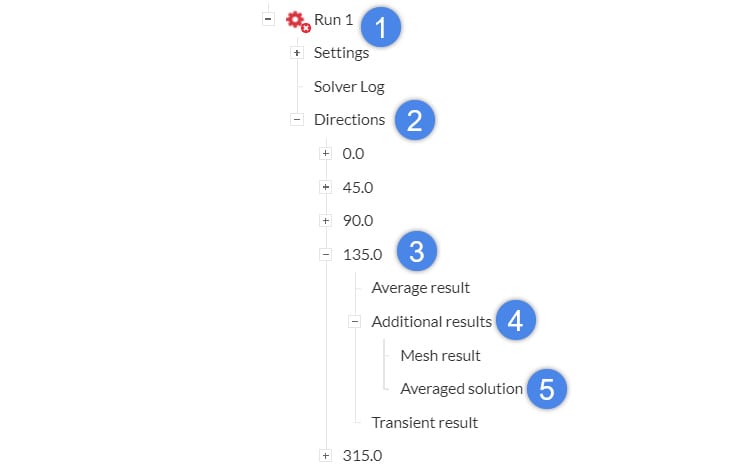
First of all, choose a failed wind direction (e.g., 225 degrees). Then, check the successful wind direction runs and select one of the closest direction to the failed one (135 degrees). In conclusion, investigating the results of a successful run can give tips regarding the problematic region.
- Firstly, Select the failed run.
- Then, expand the Directions tree.
- Next, select a successfully simulated wind direction.
- After that, expand the Additional results tree.
- Finally, choose the Averaged solution to visualize the results.
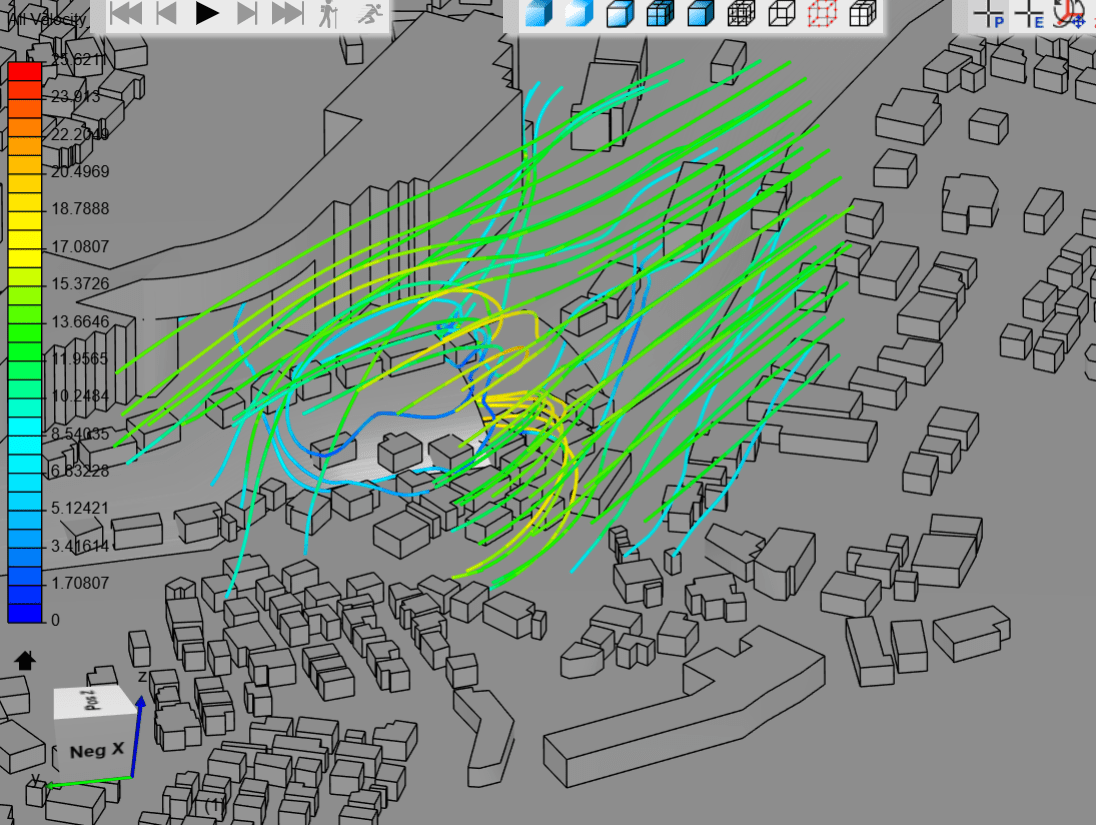
You can generate particle traces and track them to find out a hole in the model. To do so, you need to define a Cartesian Box and use it in the Additional Result Export section. You can learn (and we strongly recommend) how to set this up in the following article:
How to generate particle traces and slices in a PWC analysis?
Check the results from a particular wind direction under the Additional results > Averaged solution section. Particle traces can help to identify the hole:
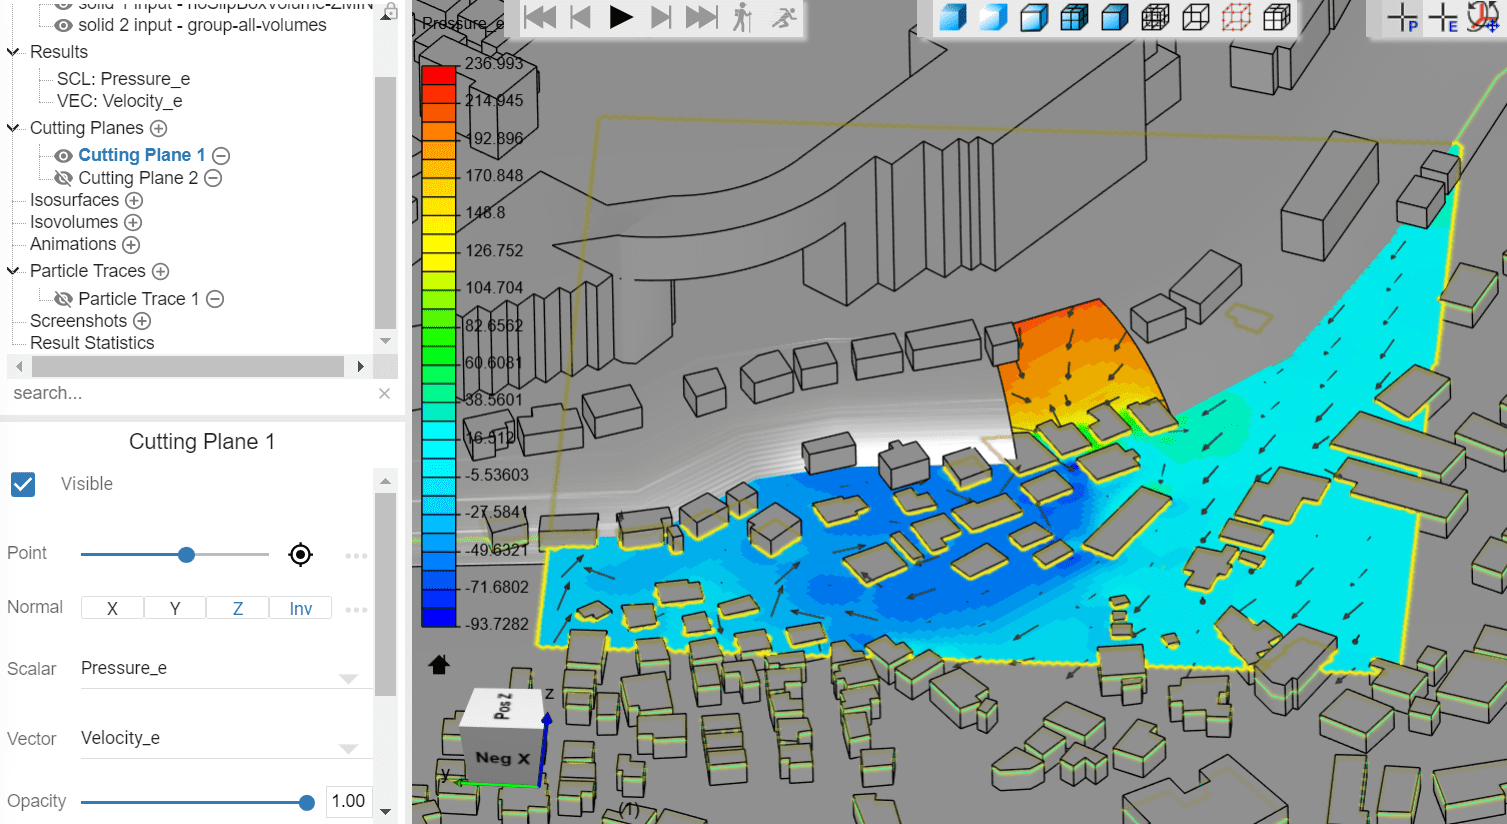
Alternatively, you can use a cutting plane in combination with velocity vectors and a pressure scalar. Usually, we should expect high-pressure gradients around the holes.
Important Information
If none of the above suggestions solved your problem, then please post the issue in our forum or contact us.


