Fill out the form to download

Required field
Required field
Not a valid email address
Required field
Required field
  • Set up your own cloud-native simulation in minutes.

  • Documentation

    How to Plot Vectors on a Plane?

    This knowledge base article explains the procedure to plot vectors on a cutting plane filter inside SimScale’s new-integrated online post-processor.

    Solution

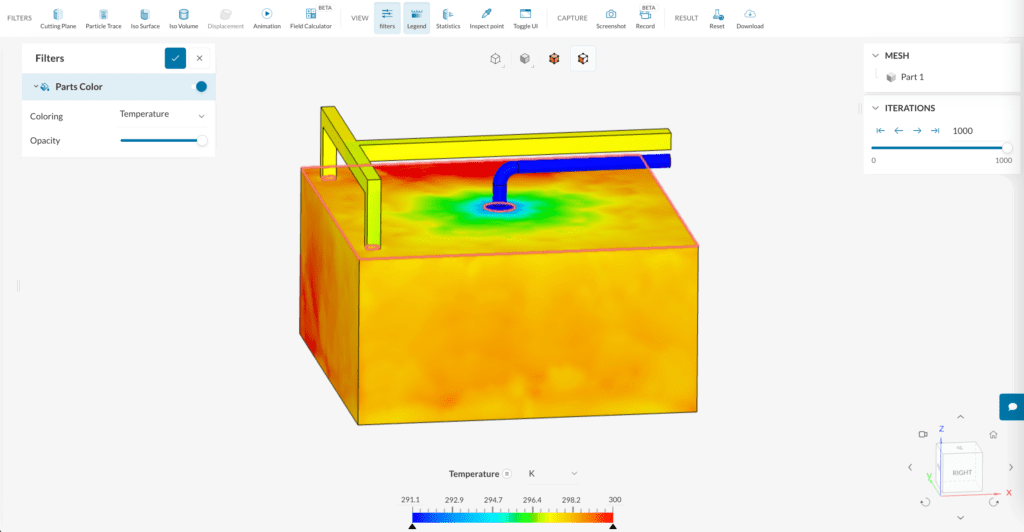
    Consider the domain representing a meeting room with two people sitting inside. Vectors can be mapped on fluid domains (results, isosurfaces, isovolumes) or on cutting planes.

    new integrated post-processing environment interface with features
    Figure 1: The post-processing environment of SimScale

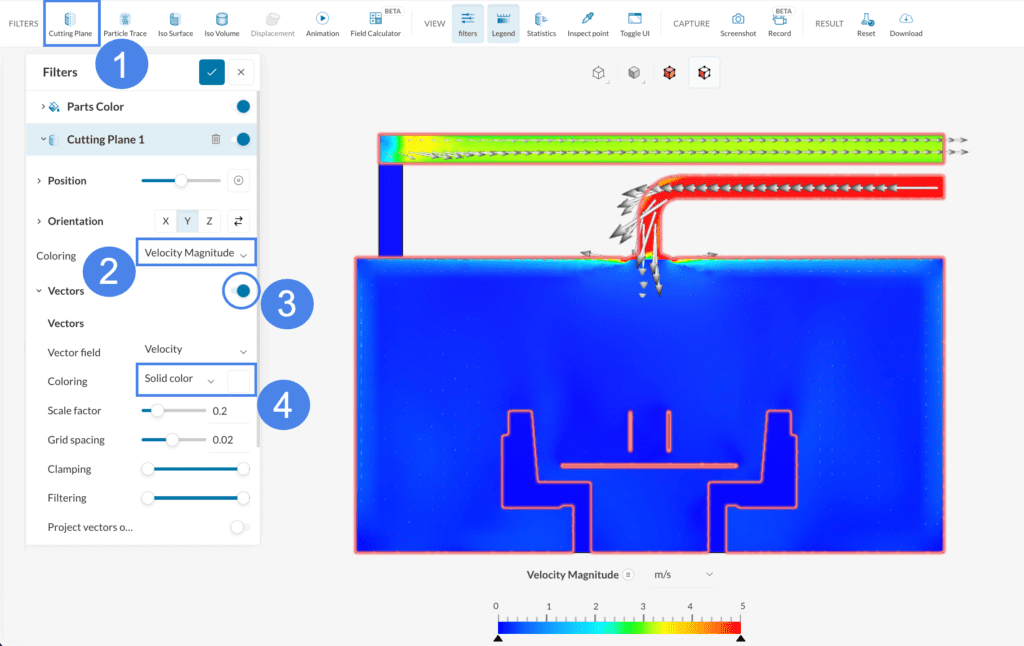
    To start, create a ‘Cutting plane’ from the Filters ribbon above, set the Coloring of your choice ‘Velocity Magnitude‘ for e.g. and activate the ‘Vectors’. What’s more, you can change the Coloring of the vectors to ‘Solid color’ so they are more easily distinguished.

    enabling and visualising the vectors on a new cutting plane
    Figure 2: Enabling the vectors onto a plane allows a better understanding of the airflow in internal flow simulations.

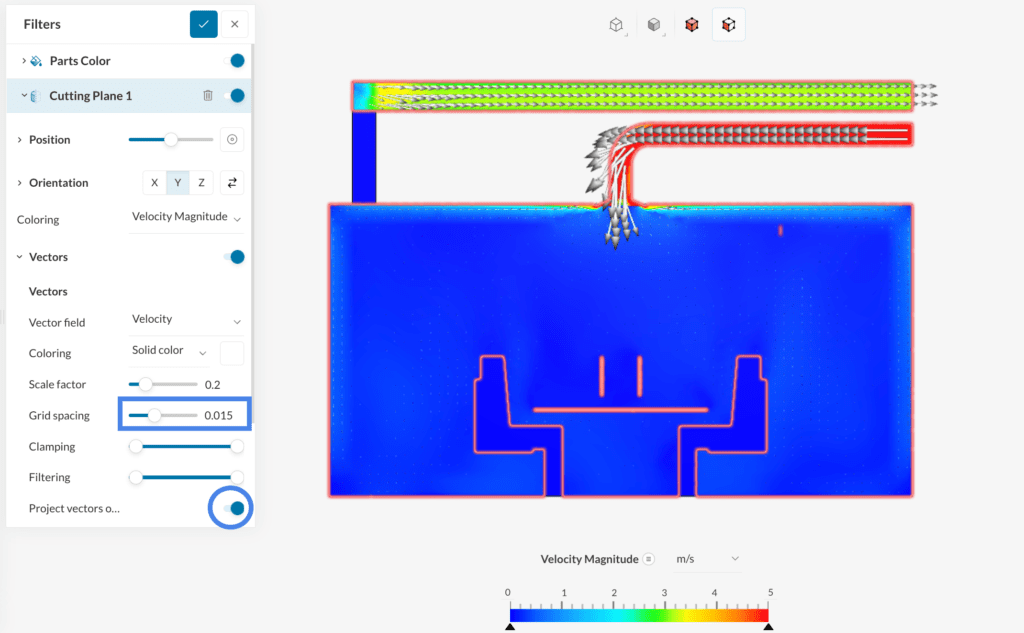
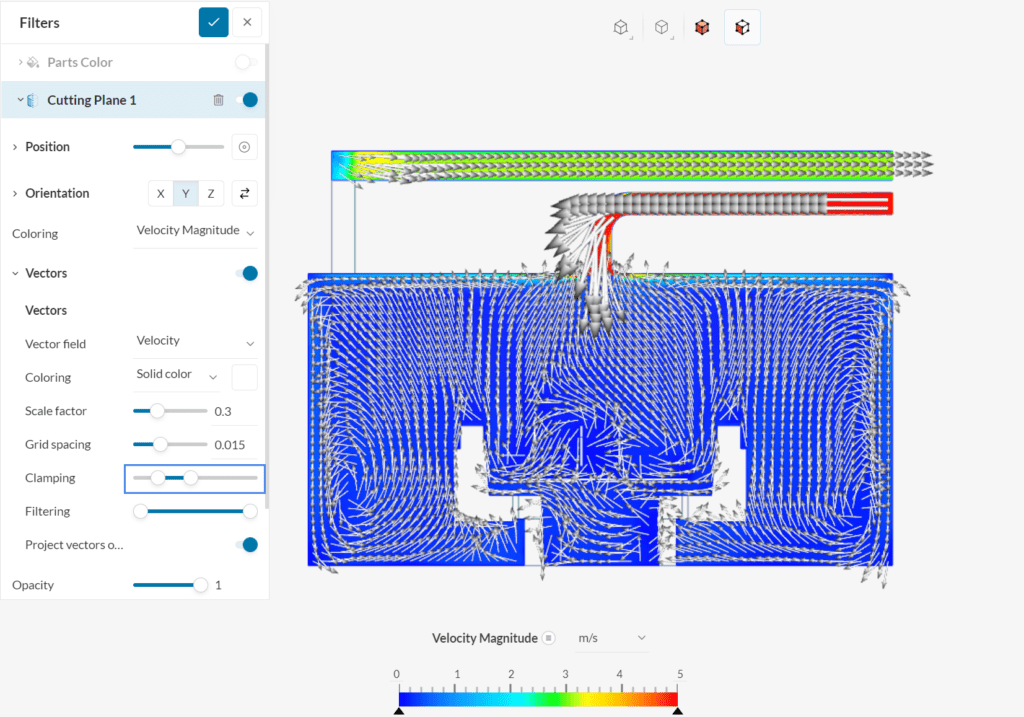
    Use the slider or the input box to change the Grid spacing between the vectors, and enable the Project vectors onto plane‘ option:

    setting the spacing between the vectors and projecting them onto the plane so they appear as 2D
    Figure 3: By default, vectors are mapped in 3D form. Cutting planes are 2-dimensional. Vectors can be converted to 2D form also by selecting ‘Project vectors onto plane‘.

    With the Scale factor option you can increase or decrease the size of the vectors:

    the scale factors can enlarge or decrease the size of vectors
    Figure 4: With a Scale factor of 0.3, the vectors appear larger compared to Figure 3.

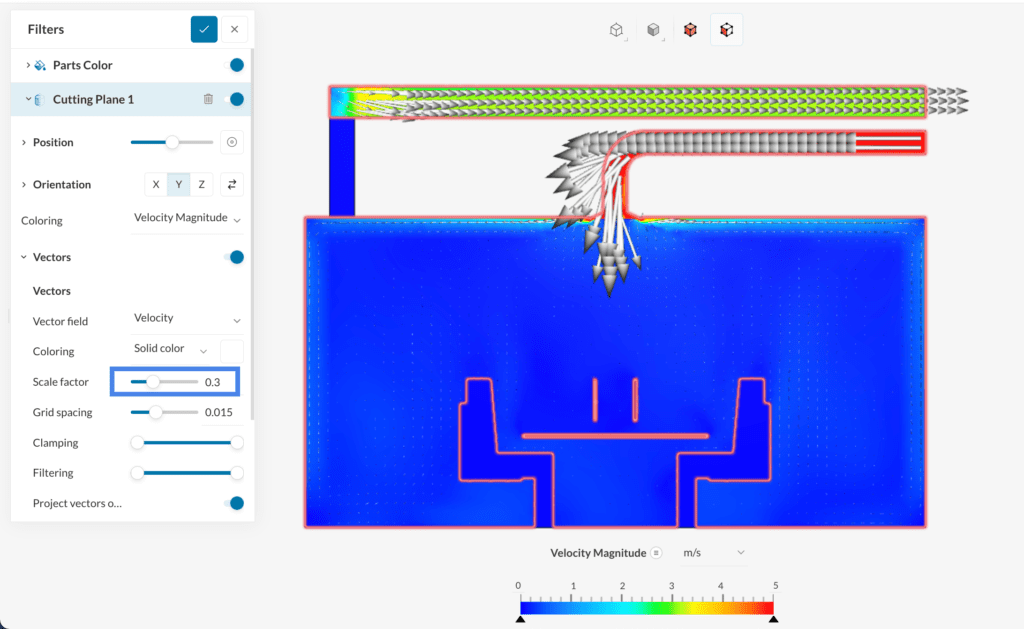
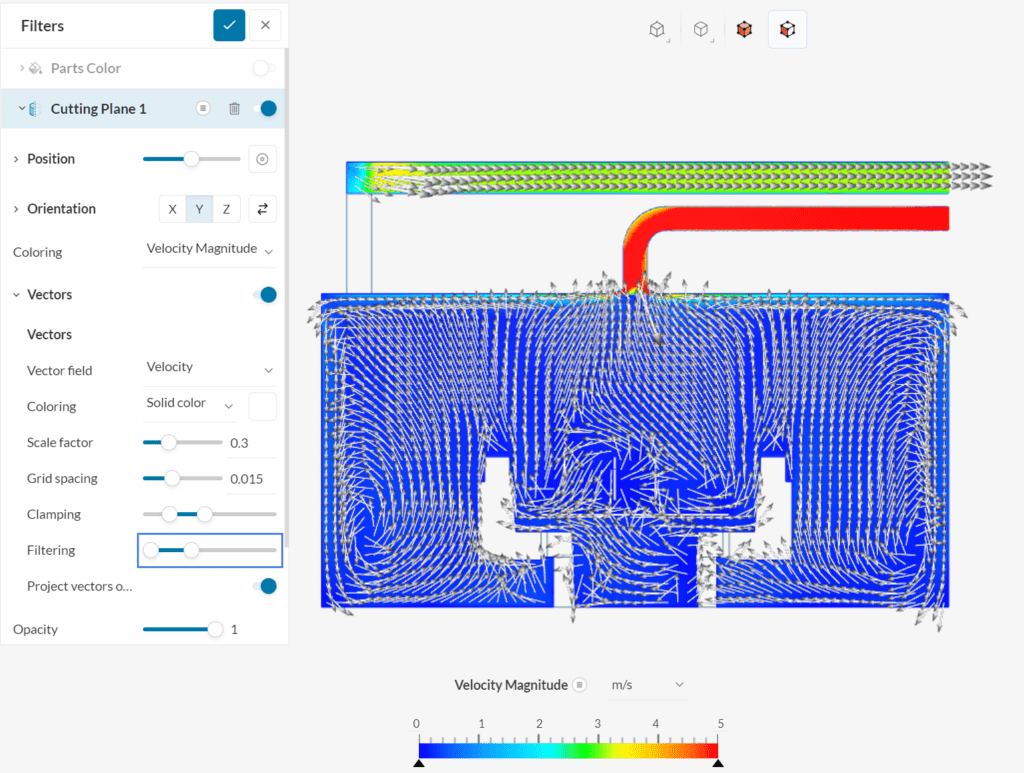
    In the previous figure, one can see that vectors are not obvious inside the room, because vectors are smaller in length on the cells with lower velocity values. The Clamping feature lets users limit the maximum and minimum lengths of vector sizes.

    the Clamping feature limits the maximum and minimum lengths of vector sizes
    Figure 5: Controlling the minimum and maximum length of the vectors by adjusting the range of the Clamping filter

    Next, you can control the Filtering. By lowering the maximum length, it will filter out the bigger vectors, and by increasing the minimum length, the smaller ones will not be shown anymore.

    with the filtering some vectors disappear according to their size
    Figure 6: By reducing the top limit of the Filtering range, the biggest vectors disappear.

    Note

    If none of the above suggestions did solve your problem, then please post the issue on our forum or contact us.

    Last updated: April 12th, 2022

    Contents