Validation Case: Thick Plate Under Pressure
This validation case belongs to pressure load in solid mechanics. The aim of this test case is to validate the following parameters:
- Distributed pressure
- Nodal stress
The simulation results of SimScale were compared to the numerical results presented in [NAFEMS]\(^1\).
Geometry
The geometry used for the case is as follows:

The plate has a thickness of 0.6 \(m\). Table 1 presents the coordinates for each point:
| Point | X [\(m\)] | Y [\(m\)] | Z [\(m\)] |
|---|---|---|---|
| A | 0 | 1 | 0.6 |
| B | 0 | 2.75 | 0.6 |
| C | 3.25 | 0 | 0.6 |
| D | 2 | 0 | 0.6 |
| A’ | 0 | 1 | 0 |
| B’ | 0 | 2.75 | 0 |
| C’ | 3.25 | 0 | 0 |
| D’ | 2 | 0 | 0 |
The point B” is located at the middle of edge BB’ while point C” is located at the middle of edge CC’. The curves of edges BC and AD are defined by equations 1 and 2 respectively:
$$ ( \frac{x}{3.25} )^2 + ( \frac{y}{2.75} )^2 = 1 \tag{1} $$
$$ ( \frac{x}{2} )^2 + y^2 = 1 \tag{2} $$
Analysis Type and Mesh
Tool Type: Code_Aster
Analysis Type: Static Linear
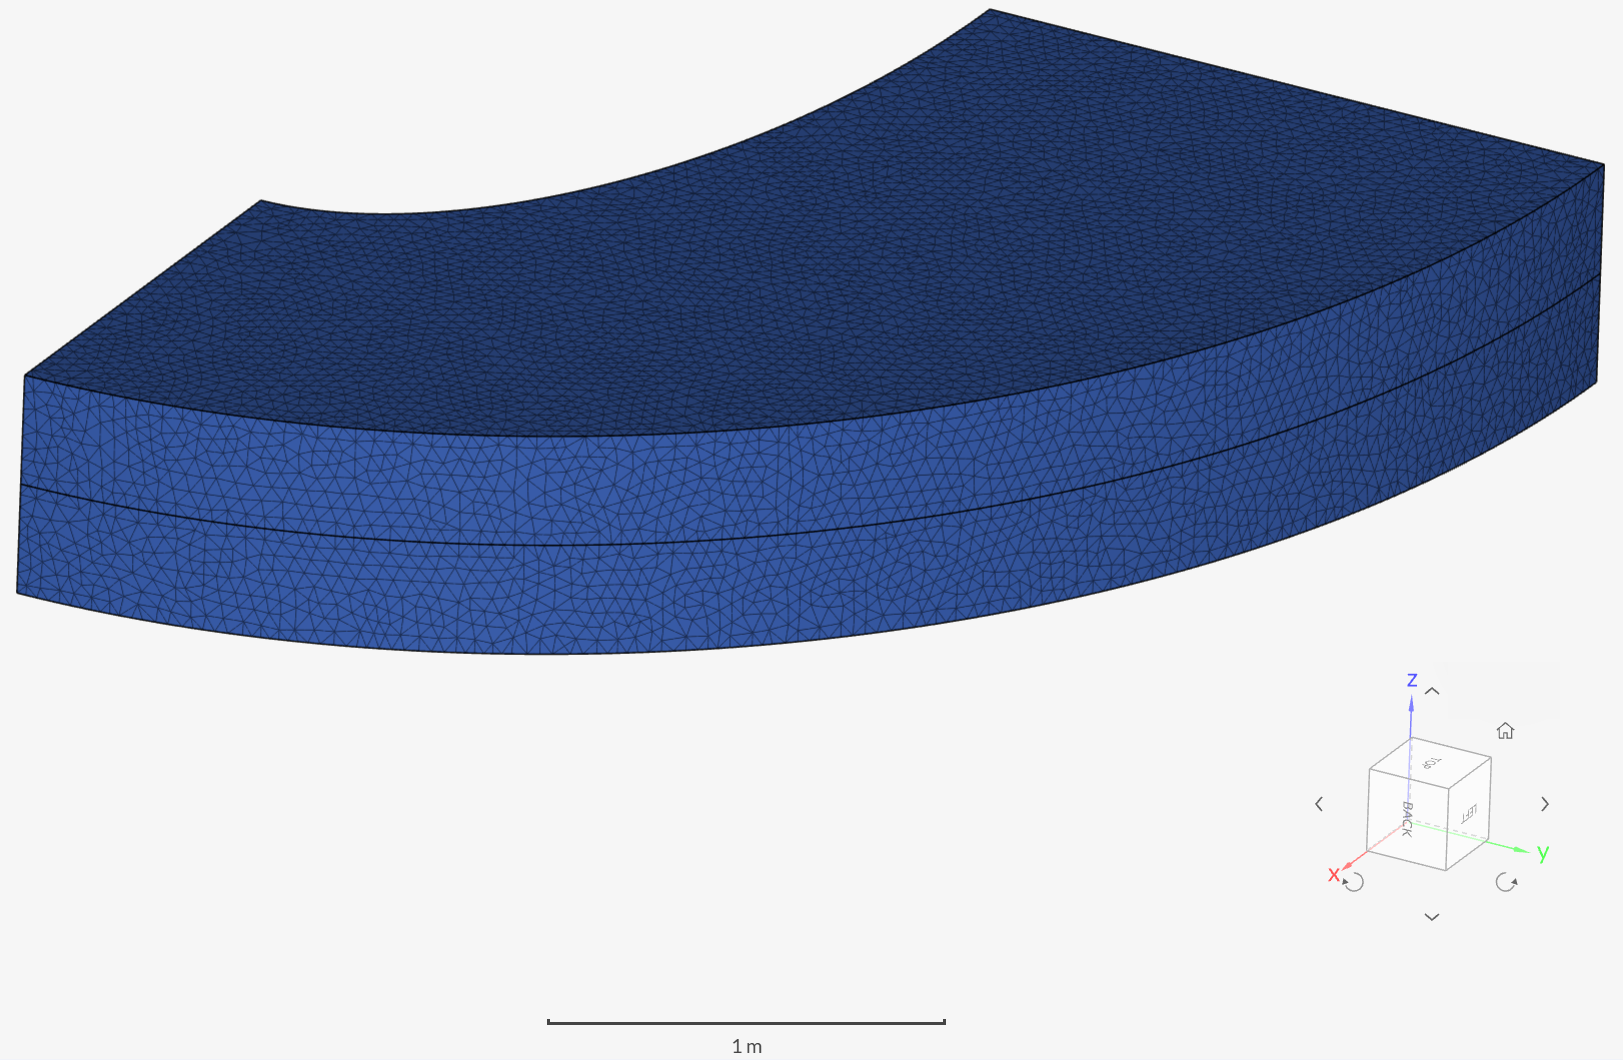
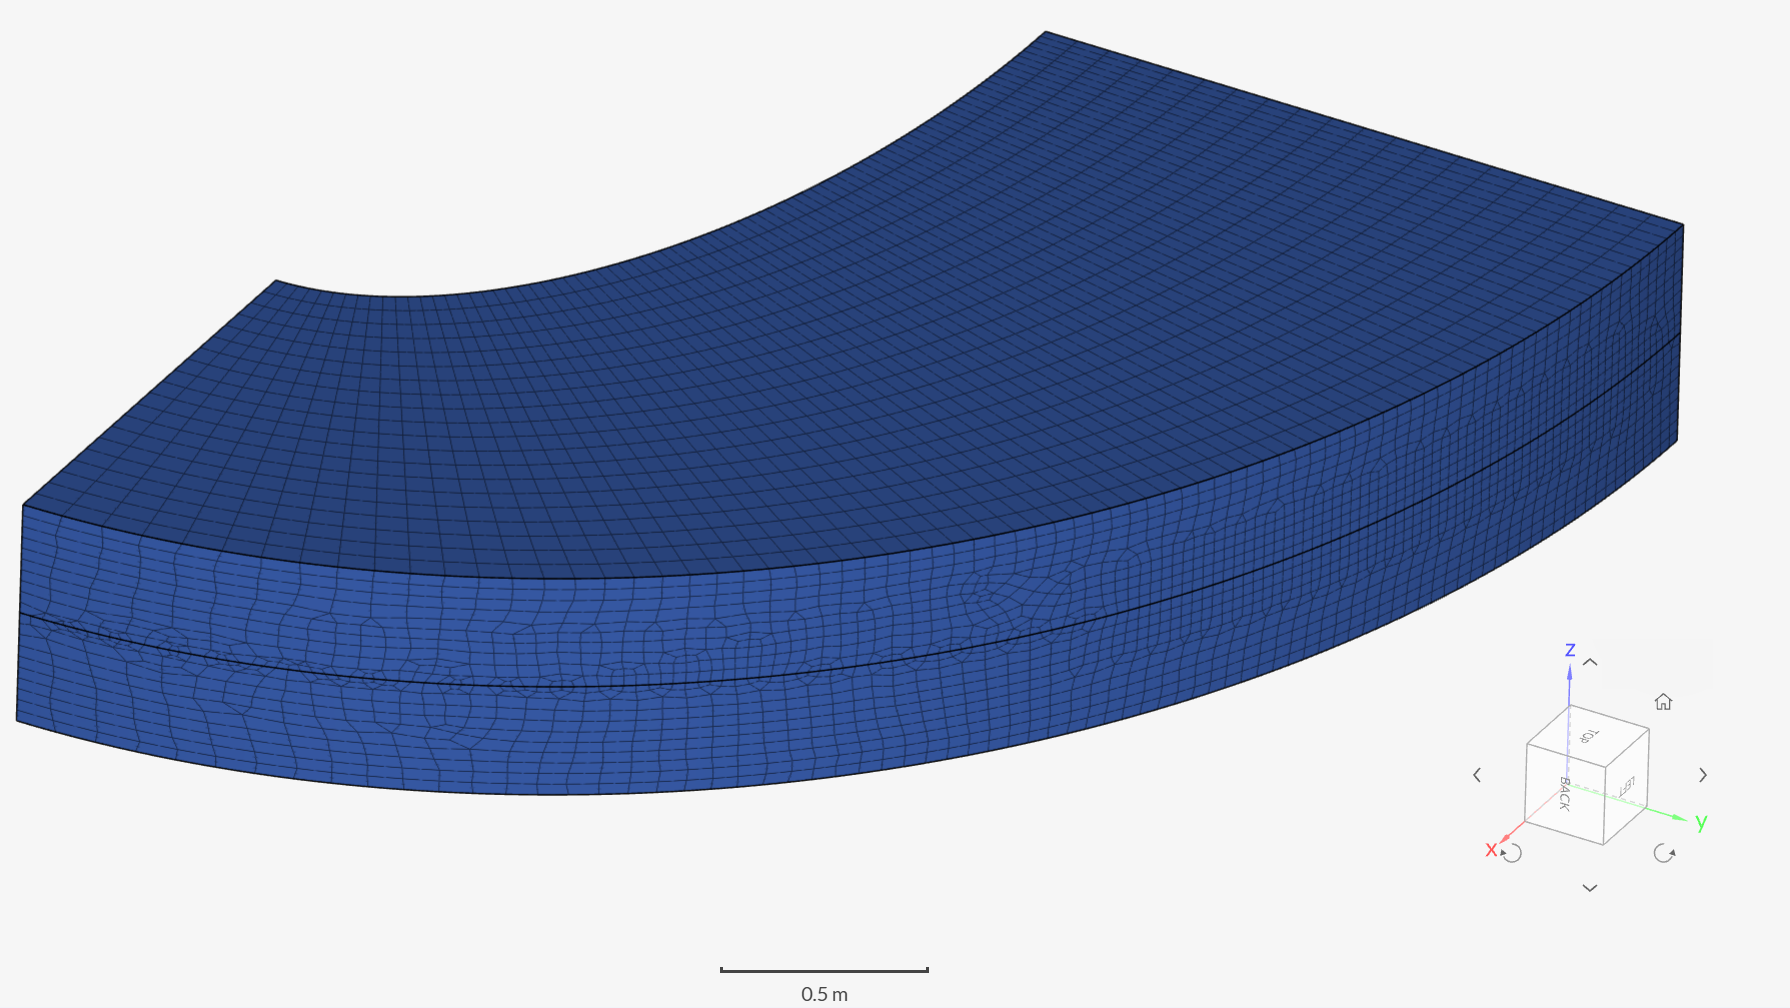
Mesh and Element Types:
All meshes were computed locally and uploaded to the platform. Table 2 presents the details of the meshes used for each case:
| Case | Mesh Type | Number of Nodes | Element Type |
|---|---|---|---|
| A | 1st Order Tetrahedral | 63381 | Standard |
| B | 2nd Order Tetrahedral | 476858 | Standard |
| C | 1st Order Quad Dominant Extruded | 216 | Standard |
| D | 2nd Order Quad Dominant Extruded | 389 | Standard |
| E | 1st Order Quad Dominant Extruded | 360 | Standard |
| F | 2nd Order Quad Dominant Extruded | 673 | Standard |
| G | 2nd Order Quad Dominant Extruded | 184594 | Standard |
Simulation Setup
Material:
- Linear Elastic Isotropic:
- \( E = \) 210 \( GPa \)
- \( \nu = \) 0.3
Boundary Conditions:
- Constraints:
- Face DCD’C’ with zero y-displacement
- Face ABA’B’ with zero x-displacement
- Face BCB’C’ with zero y- and x-displacements
- Edge B”C” with zero z-displacement
- Loads:
- Pressure of 1 \(MPa\) applied on face ABCD
Reference Solution
The reference solution as presented in [NAFEMS]\(^1\) is of the numerical type. For the comparison purposes, the normal stress at point D in the direction of the Y axis is taken:
\( \sigma_{ref} = 5.38\ MPa \)
Result Comparison
Comparison of stress \(\sigma_{yy}\) magnitude computed at the location of point D (variable SIYY) from the simulation results is presented with respect to the reference solution \(\sigma_{ref}\):
| CASE | \( \sigma_{ref} \) [MPa] | \( \sigma_{YY} \) [MPa] | Error |
|---|---|---|---|
| A | 5.38 | 5.08010 | -5.57 % |
| B | 5.38 | 5.34163 | -0.71 % |
| C | 5.38 | 3.79913 | -29.38 % |
| D | 5.38 | 5.30337 | -1.42 % |
| E | 5.38 | 5.29324 | -1.61 % |
| F | 5.38 | 5.57852 | 3.67 % |
| G | 5.38 | 5.35033 | -0.55 % |
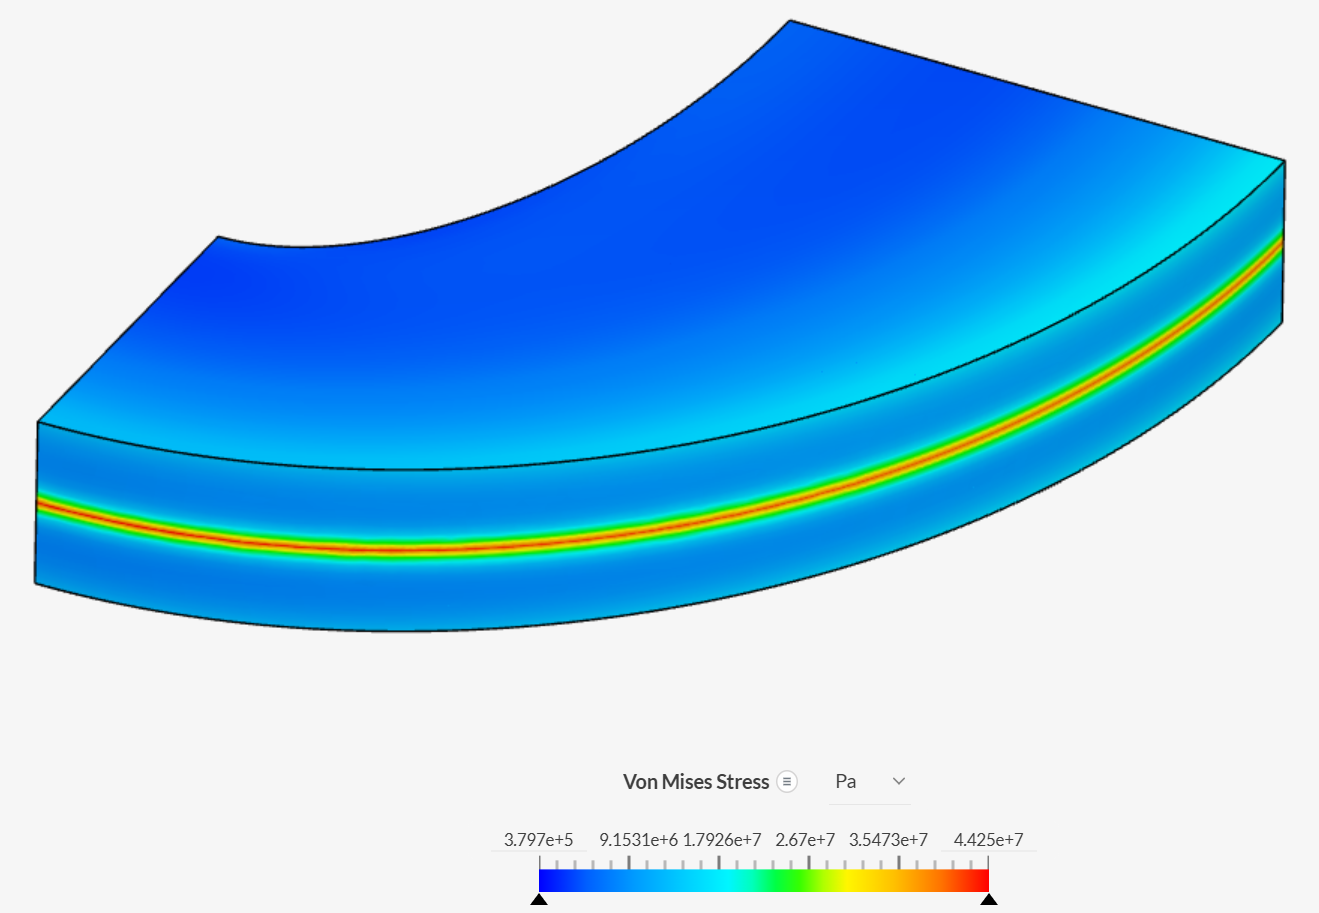
The von Mises stress color plot is presented for the results of case G:
Related Tutorials
References
- (1987) ”The Standard NAFEMS Benchmarks”, “The international association for the engineering analysis community”
Note
If you still encounter problems validating you simulation, then please post the issue on our forum or contact us.
Last updated: March 17th, 2026
Did this article solve your issue?
How can we do better?
We appreciate and value your feedback.


