Documentation
The aim of this validation is to compare the simulation results performed in SimScale using the compressible flow feature in its proprietary solver, Multi-purpose, with the simulation results in the study done by NASA titled, “Sajben Transonic Diffuser: Study #1\(^1\)”.
The objective is to test the Multi-purpose solver’s ability to compute supersonic inviscid flows and in particular to capture normal shock waves.
The geometry replicates a flow domain of the Sajben Diffuser. The geometry is inspired from the schematic\(^1\) as shown in Figure 1:
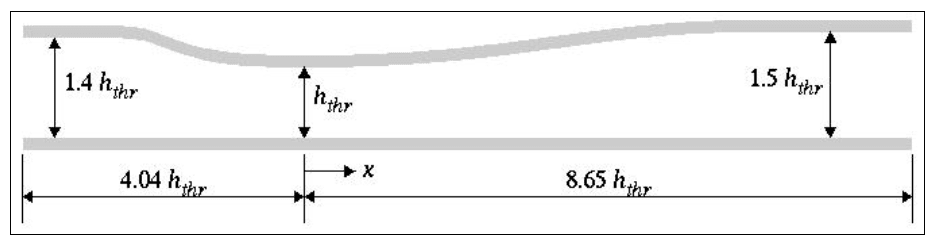
This configuration has an entrance to throat area ratio of 1.4, and an exit to throat area ratio of 1.5. From the entrance, the throat is located at 4.04 times the throat height (\(h_{thr}\)) of 0.044 \(m\).
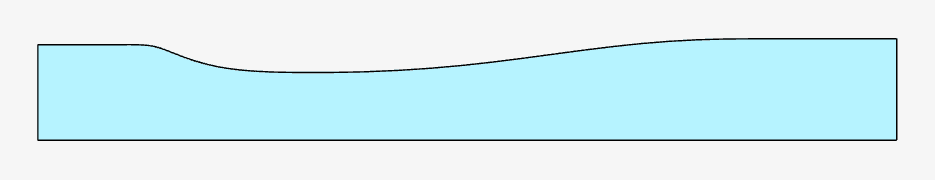
The exact geometry profile was used to create a Sajben Difusser CAD model and imported into SimScale. It has a tiny thickness to represent a two-dimensional flow.
Analysis Type: Steady-state, Multi-purpose with k-epsilon and Compressible model
Mesh and Element Types:
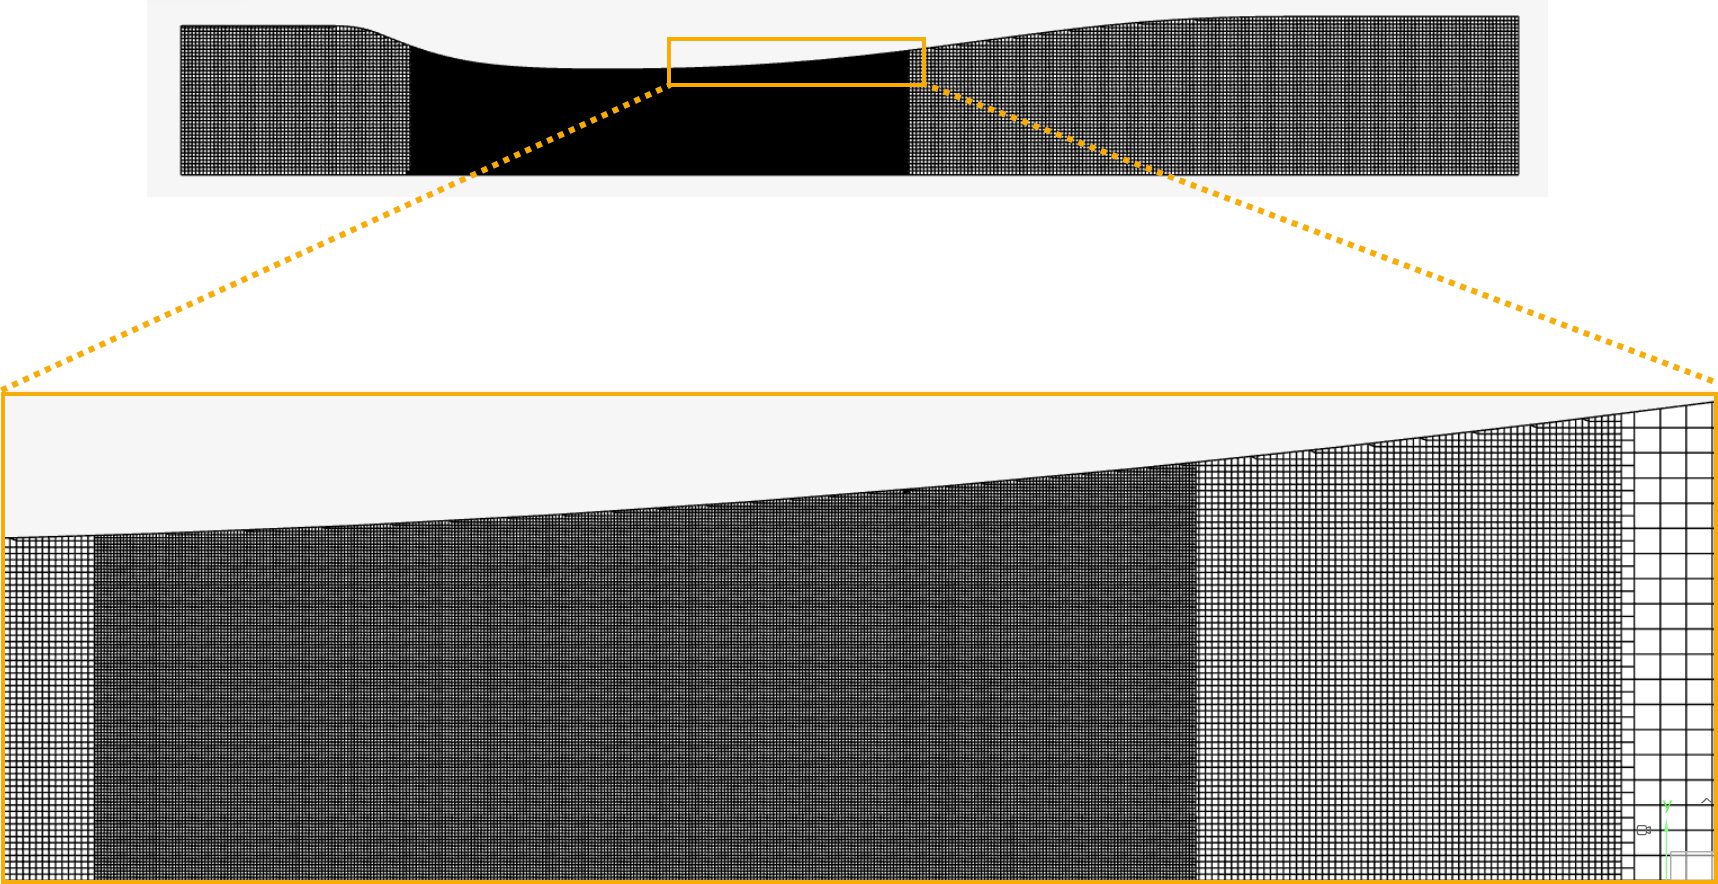
The mesh was created with SimScale’s Multi-purpose mesh type, which is a body-fitted structured mesh. An automatic sizing definition was defined with two additional region refinements near the normal shock location.
| Mesh Type | Fineness | Target Cell Size (refinement 1) \(m\) | Target Cell Size (refinement 2) \(m\) | Number of cells | Element Type |
| Automatic with region refinements | 5 | 5e-4 | 2.5e-4 | 3039245 | 3D Hexahedral |
The resulting mesh is as observed below:
Fluid:
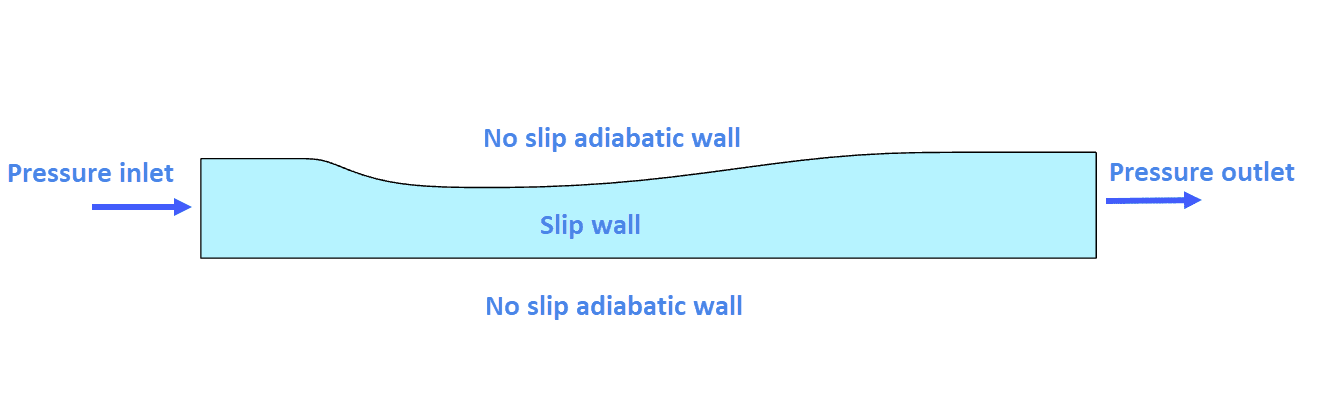
Figure 4 shows the schematic of the boundary conditions applied:
| Boundary Condition | Value |
| Pressure inlet \([kPa]\) | 134.4478 (Absolute total pressure with 4.628 \(C\) total temperature) |
| Pressure outlet \([kPa]\) | 110.66 (Fixed absolute static pressure) |
| No slip wall (adiabatic) | Top and bottom faces |
| Slip wall (adiabatic) | Front and back faces to replicate a 2D flow |
The result output from the SimScale simulation is compared with the experimental and CFD results obtained from the NASA study\(^1\).
SimScale results were compared against three plots from the NASA experimental study\(^1\): Pressure ratio along the top and bottom surface against the normalized x-coordinate of the profile, and the flow velocity profile at an axial location within the diffuser.
The normalization in the x- and y-direction can be understood using the figure below:
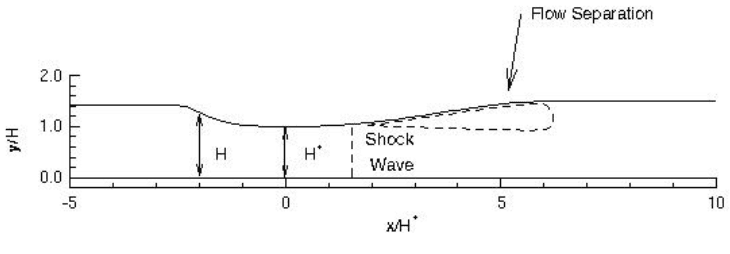
The x-coordinate is normalized using the throat height \(h_{thr}\) (or \(H^+\)) and the y-coordinate is normalized using the height at any axial location.
Using the probe point feature in SimScale, the static pressure was measured at the top and bottom surface profile of the diffuser and compared against the study\(^1\). The static pressure values are normalized using the total absolute pressure at the inlet.
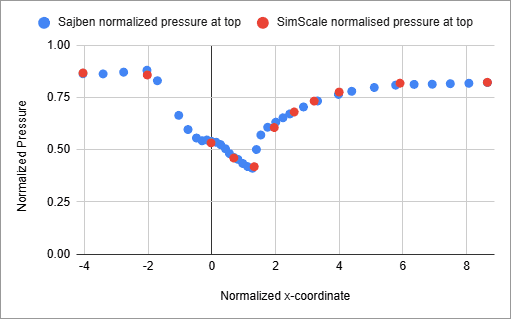
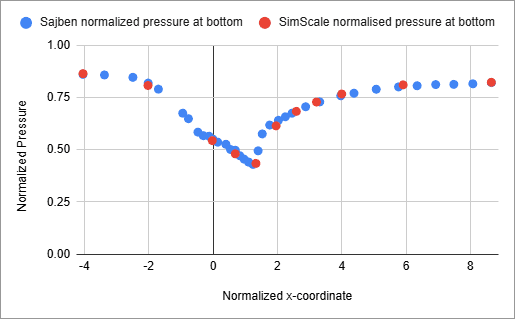
Figures 6 and 7 indicate that the shock location is precisely captured as the pressure drop and rise match for both sides of comparison.
The flow velocity profile was mapped at \(x\) = 0.1268 \(m\) or \(x/h_{thr}\) = 2.882 and compared against the study\(^1\).
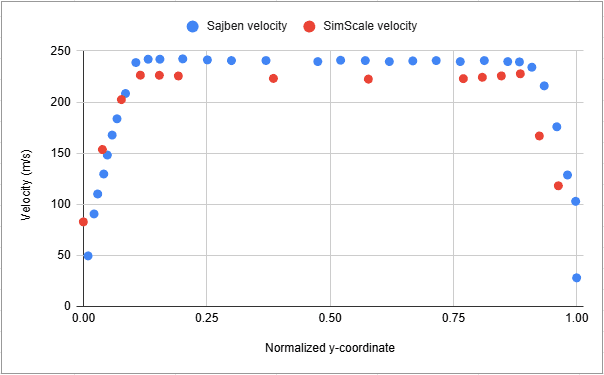
The SimScale result tends to agree with the NASA experimental study and more accurately near the top and bottom boundary surfaces.
Additionally, Mach number contours for three codes WIND, NPARC, and NXAIR are computed in the study\(^1\). The WIND and NXAIR results show a well-defined normal shock than the NPARC results. The NXAIR shock position is slightly downstream of the position predicted by the other two codes. WIND and NPARC predict similar boundary layer growth downstream of the normal shock, while NXAIR predicts a thinner boundary layer.
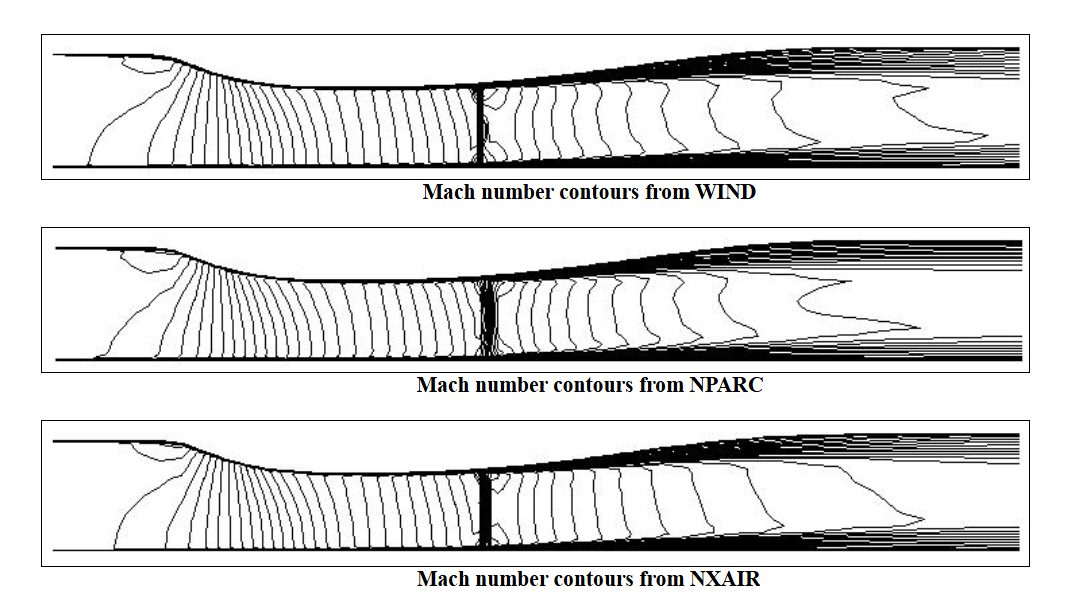
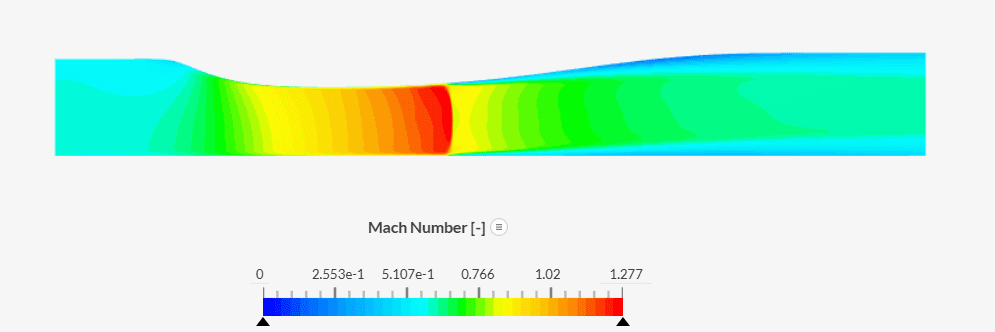
Mach number contours computed in SimScale show a similar behavior compared to the three codes. The normal shock is very well-defined at the same location as computed in the figure above as well as the plots. The sharp dip in pressures at the top and bottom surface is accurately reproduced as well.
Note
If you still encounter problems validating your simulation, then please post the issue on our forum or contact us.
Last updated: March 14th, 2025
We appreciate and value your feedback.
Sign up for SimScale
and start simulating now