Documentation
This validation case aims to assess the accuracy of the simulation results for the classical NACA 0012 airfoil operating at Mach 0.15, by comparing them with experimental and reference data provided in the extended NASA Technical Report [NAS-2016-0]\(^1\).
The NACA 0012 is a widely studied symmetric airfoil, with extensive experimental data available, particularly from the work of Charles Ladson [Ladson]\(^2\) in the report “Effects of Independent Variation of Mach and Reynolds Numbers on the Low-Speed Aerodynamic Characteristics of the NACA 0012 Airfoil Section.” This foundational study analyzed the low-speed aerodynamic behavior of the airfoil, making it a reliable benchmark for validating CFD simulations. By comparing numerical predictions of lift, drag, and pressure distribution with the experimental results, this case serves to evaluate the robustness and accuracy of the turbulence model and overall simulation setup.
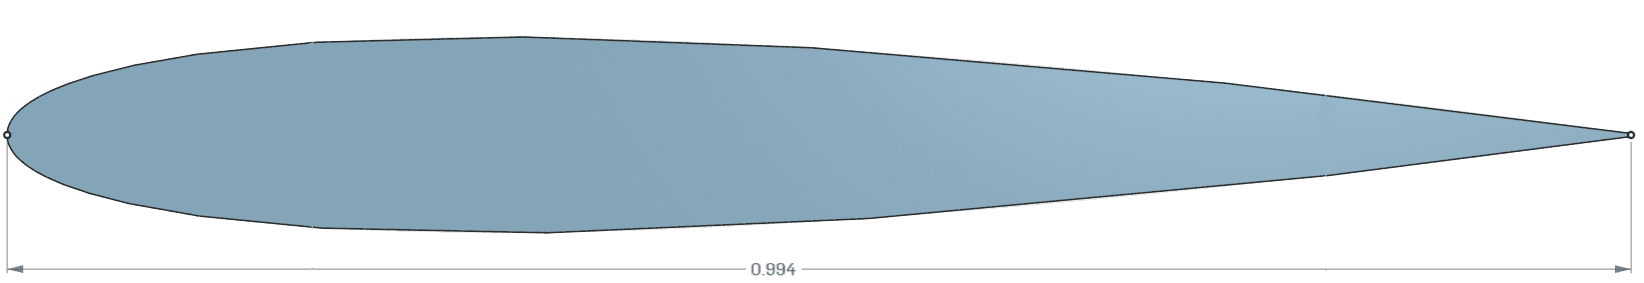
The NACA 0012 is a symmetric, 4-digit airfoil characterized by a maximum thickness of 12% of the chord, with no camber. The geometry is defined analytically, making it highly suitable for numerical studies due to its smooth and well-behaved surface profile\(^1\). In this case, the chord length is set to ≈1.0 \(m\), which is consistent with the reference.
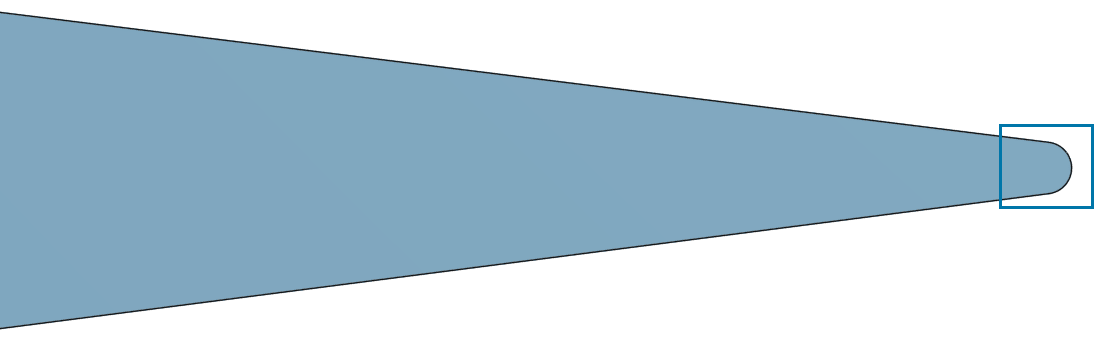
The trailing edge of the airfoil was simplified by adding a small chamfer to improve boundary layer meshing and avoid the formation of stair-step elements near the sharp edge.
Tool Type: OpenFOAM®
Analysis Type: Turbulent Incompressible fluid flow
Mesh and Element Types:
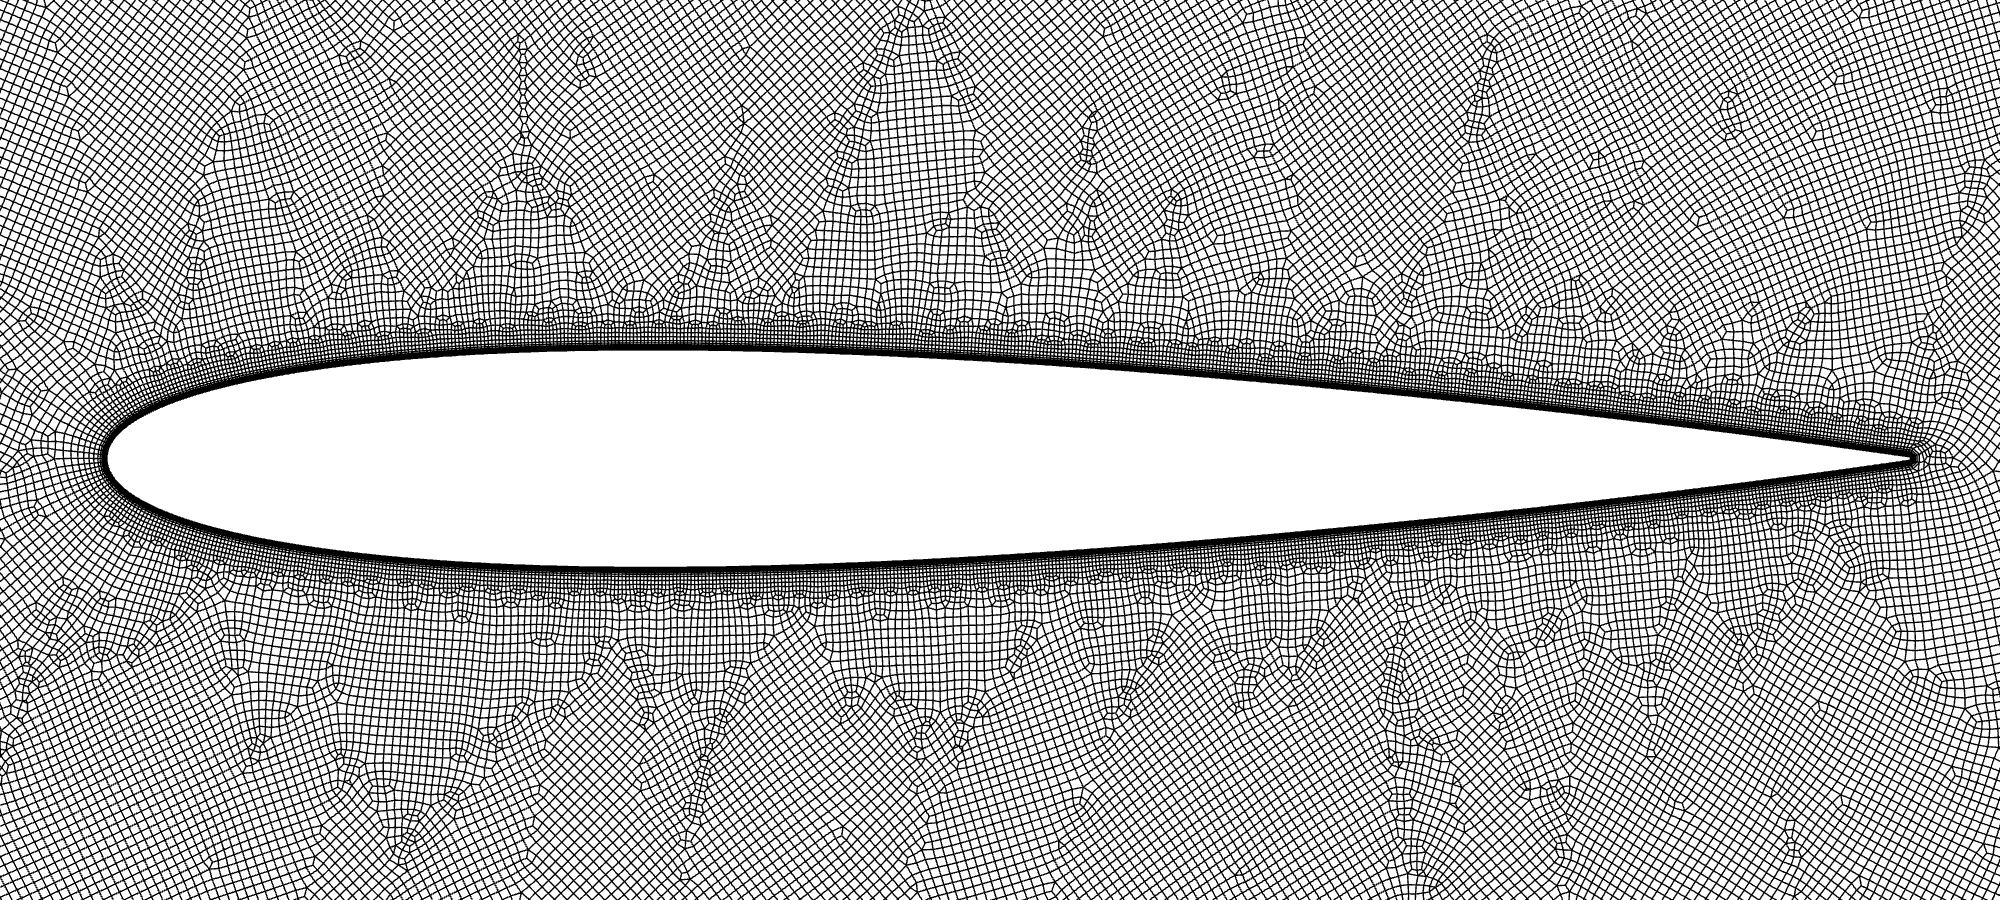
In this study, the mesh was generated using the Standard mesh algorithm with the Extrusion mesh refinement to extrude the mesh in the spanwise direction with a single cell, resulting in a pseudo-2D domain. This setup maintains only one element across the domain’s thickness, ensuring the flow remains predominantly in the axial and vertical directions while minimizing spanwise effects. The computational domain measures 60 \(m\) x 40 \(m\).
Three different mesh densities were tested with the aim of evaluating the mesh sensitivity before running the cases. For this, an angle of attack (AoA) of 10° was used to compare the lift and drag coefficients with the reference results\(^2\) — CL ≈1.066 and CD ≈ 0.012, respectively. Using the results from Table 1, the moderate mesh was selected for further simulations because of its high accuracy to simulation time ratio. The mesh resolution ensures \(y^+\) ~1 for all the configurations, allowing for accurate resolution of the near-wall region.
| Mesh | Grid Size | CL | CD | CL (Error %) | CD (Error %) |
| Coarse | 103434 | 1.064 | 0.013 | 0.2 | 7.4 |
| Moderate | 218499 | 1.074 | 0.012 | 0.5 | 0.0 |
| Fine | 444101 | 1.074 | 0.012 | 0.7 | 0.0 |
A typical property of the generated mesh is the \(y^+\) (“y-plus“) value, which is defined as the non-dimensionalized distance to the wall, learn more. A \(y^+\) value of 1 would correspond to the upper limit of the laminar sub-layer.
Wall treatment
An average \(y^+\) value of 1 was used for the inflation layer around the airfoil. The \(k-\omega\) SST turbulence model was chosen, with full resolution for near-wall treatment of the flow around the airfoil.
Fluid
Air with a kinematic viscosity of 8.6 x 10⁻⁶ \(m^{-2}/s\)is assigned to the fluid domain. The viscosity was assumed with respect to the Reynolds number of 6 million. The boundary conditions for the simulation are shown in Table 2.
Boundary Conditions
| Parameter | Inlet | Airfoil Faces | Lateral Faces | Outlet |
| Velocity \([m/s]\) | 52.08 | Full Resolution | Empty2D | Zero Gradient |
| Turb. kinetic energy \((k)\) \([m^2/s^2]\) | 1.627 | Full Resolution | Empty2D | Zero Gradient |
| Specific dissipate rate \((\omega)\) \([1/s]\) | 128 | Full Resolution | Empty2D | Zero Gradient |
| Pressure \([Pa]\) | Zero Gradient | Full Resolution | Empty2D | 0 |
The free stream velocity of the simulation is 52.08 \(m/s\), however, the angle of attack is taken to account during the simulations and the values are considered as \(52.08⋅(cos(\alpha), sin(\alpha))\) for each angle simulated (0, 2.5, 5, 10, and 15°). Those are the same values presented in the original experiment of Ladson\(^2\) for Mach 0.15.
In order to improve the convergence and stability of the simulation, the Interpolation schemes for the velocity and pressure gradient schemes were changed from Least Squares to Gauss-Linear.
SimScale provides a built-in result control feature for calculating force and moment coefficients, allowing users to define the directions of lift and drag, as well as specify the reference length and reference area. For this validation case, the experimental lift and drag coefficient data were obtained from Ladson\(^2\), while the pressure coefficient data were taken from Gregory\(^3\).
Figure 4 presents the lift coefficient values obtained from SimScale in comparison with the corresponding experimental results.
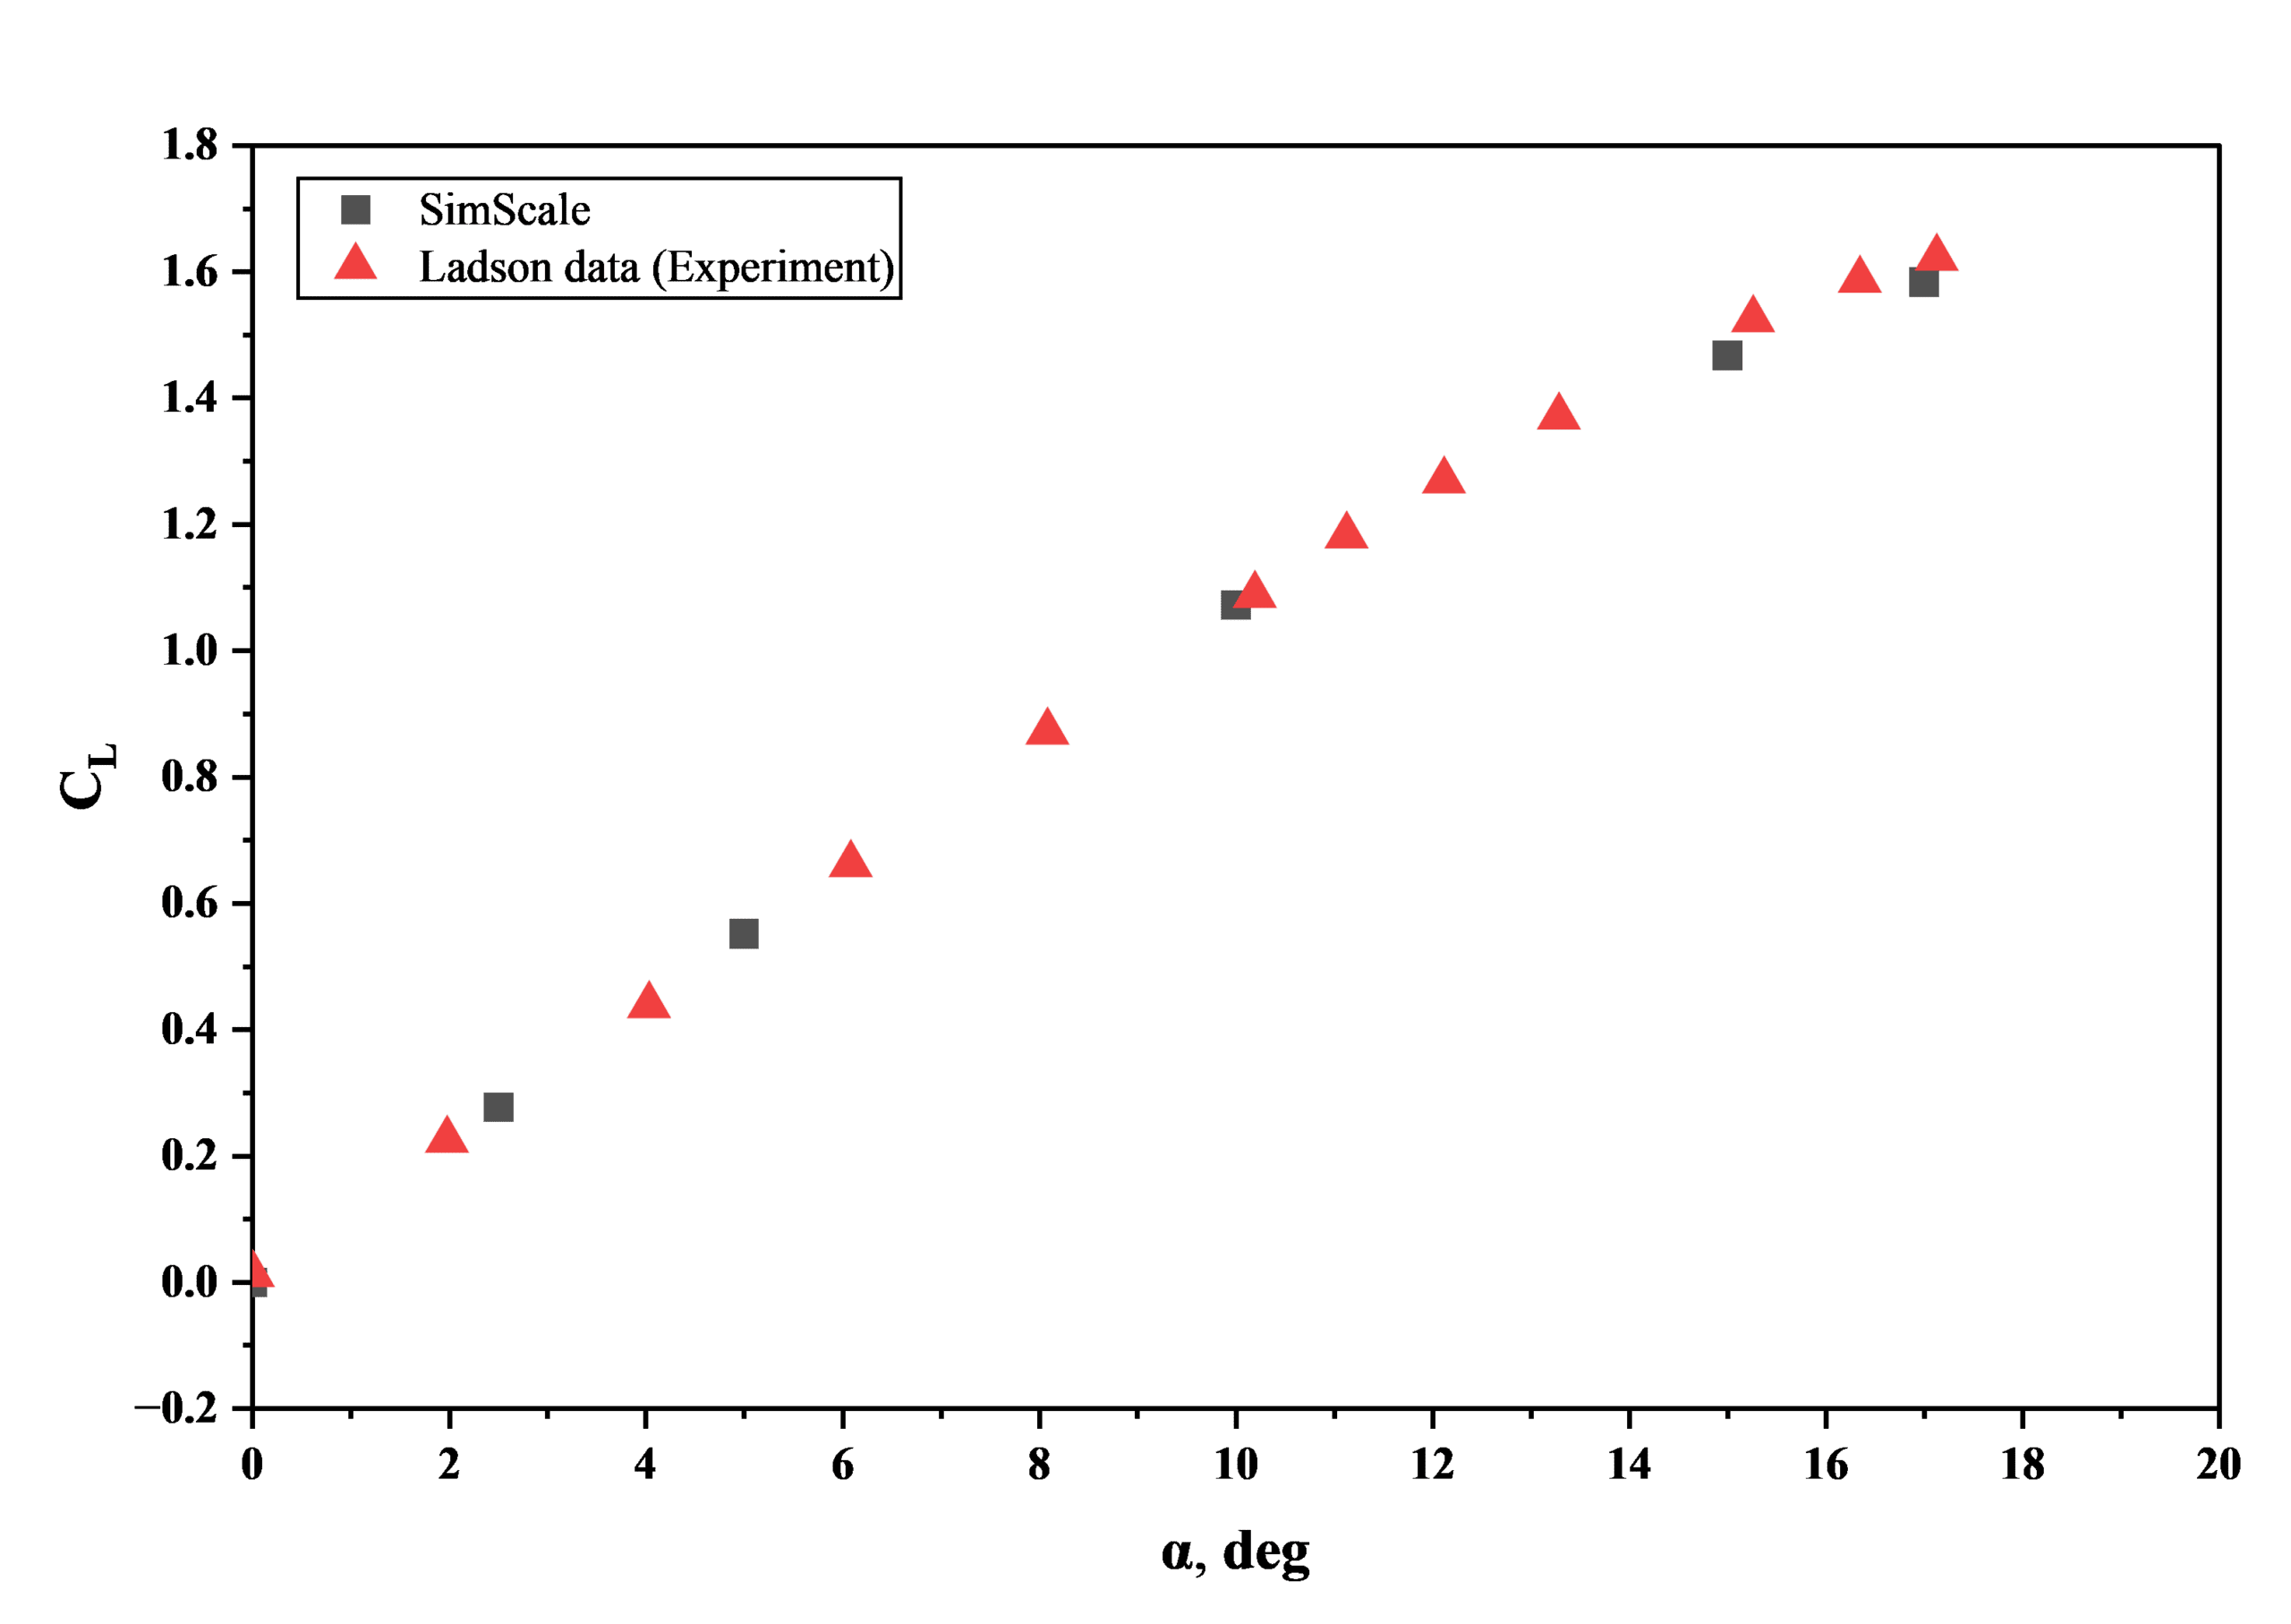
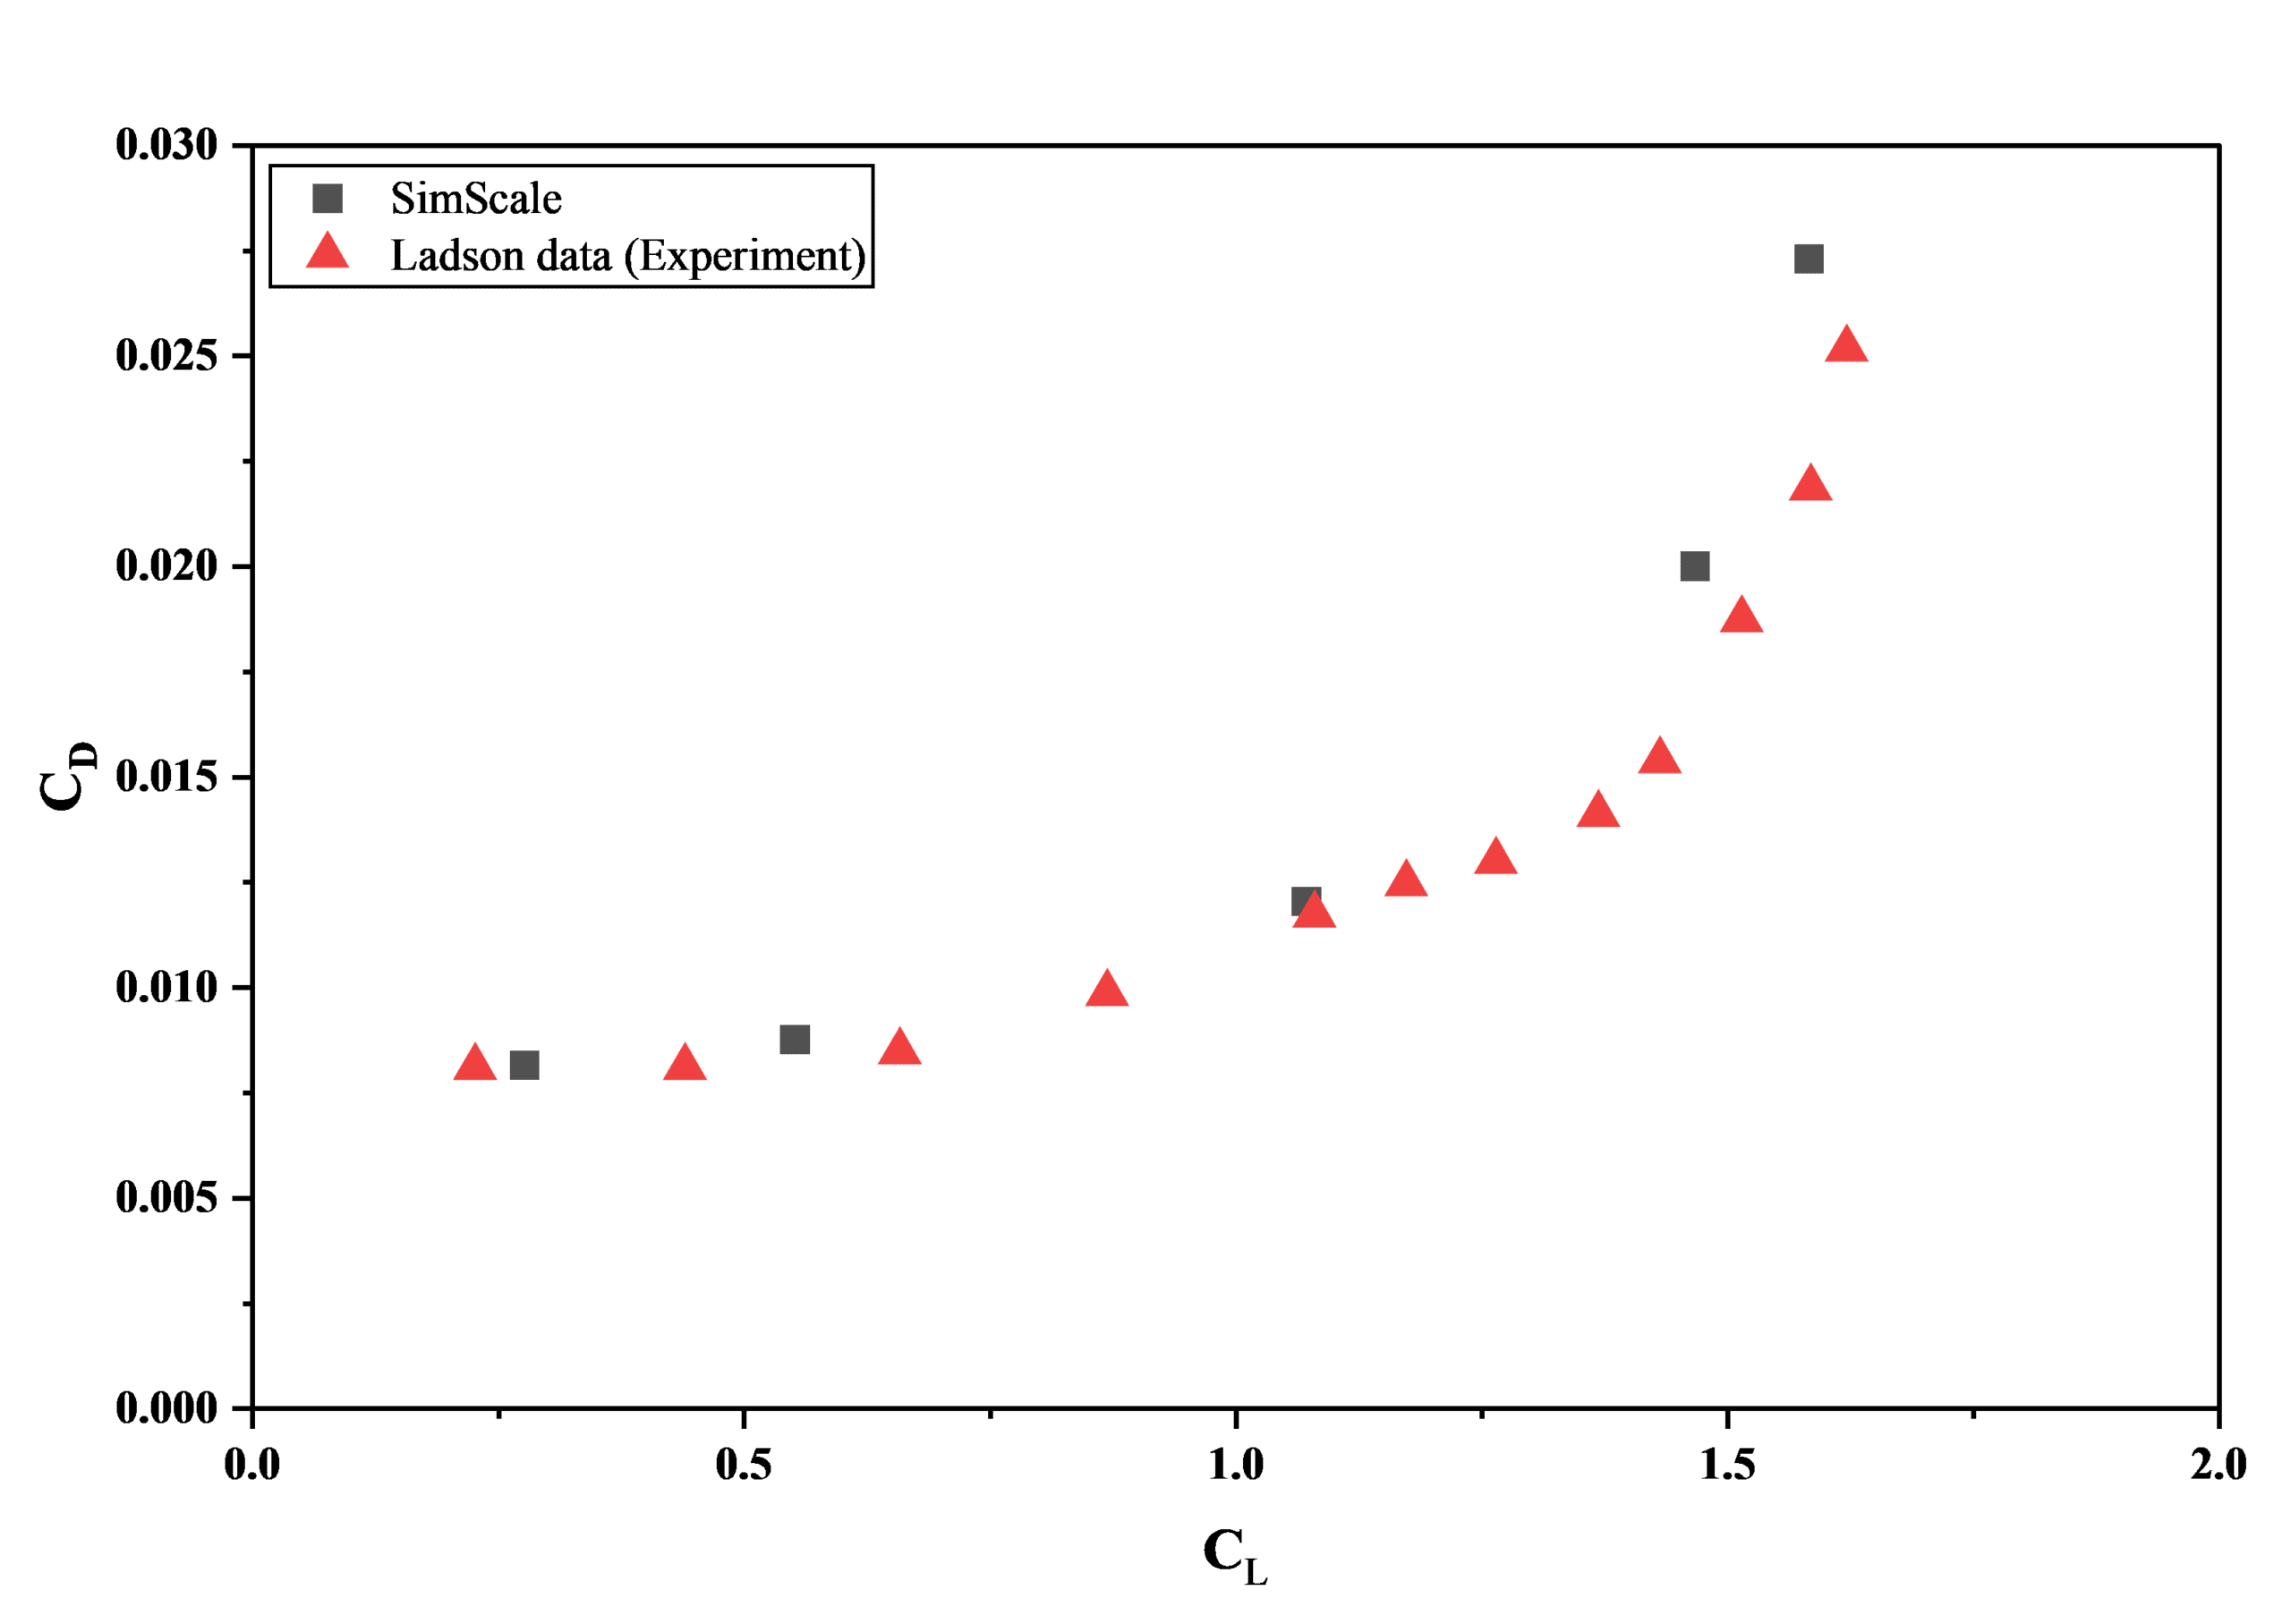
Figure 5 presents a comparison between the drag coefficients from SimScale and experimental results, plotted against the corresponding lift coefficients.
The pressure coefficient is a key parameter in evaluating aerodynamic behavior and airfoil performance. The figures below demonstrate good agreement between the simulation and experimental results for the pressure coefficient on the top surface of the airfoil, indicating that SimScale performs well in accurately predicting the pressure distribution over the model. The results are plotted using the x coordinate divided by the chord length.
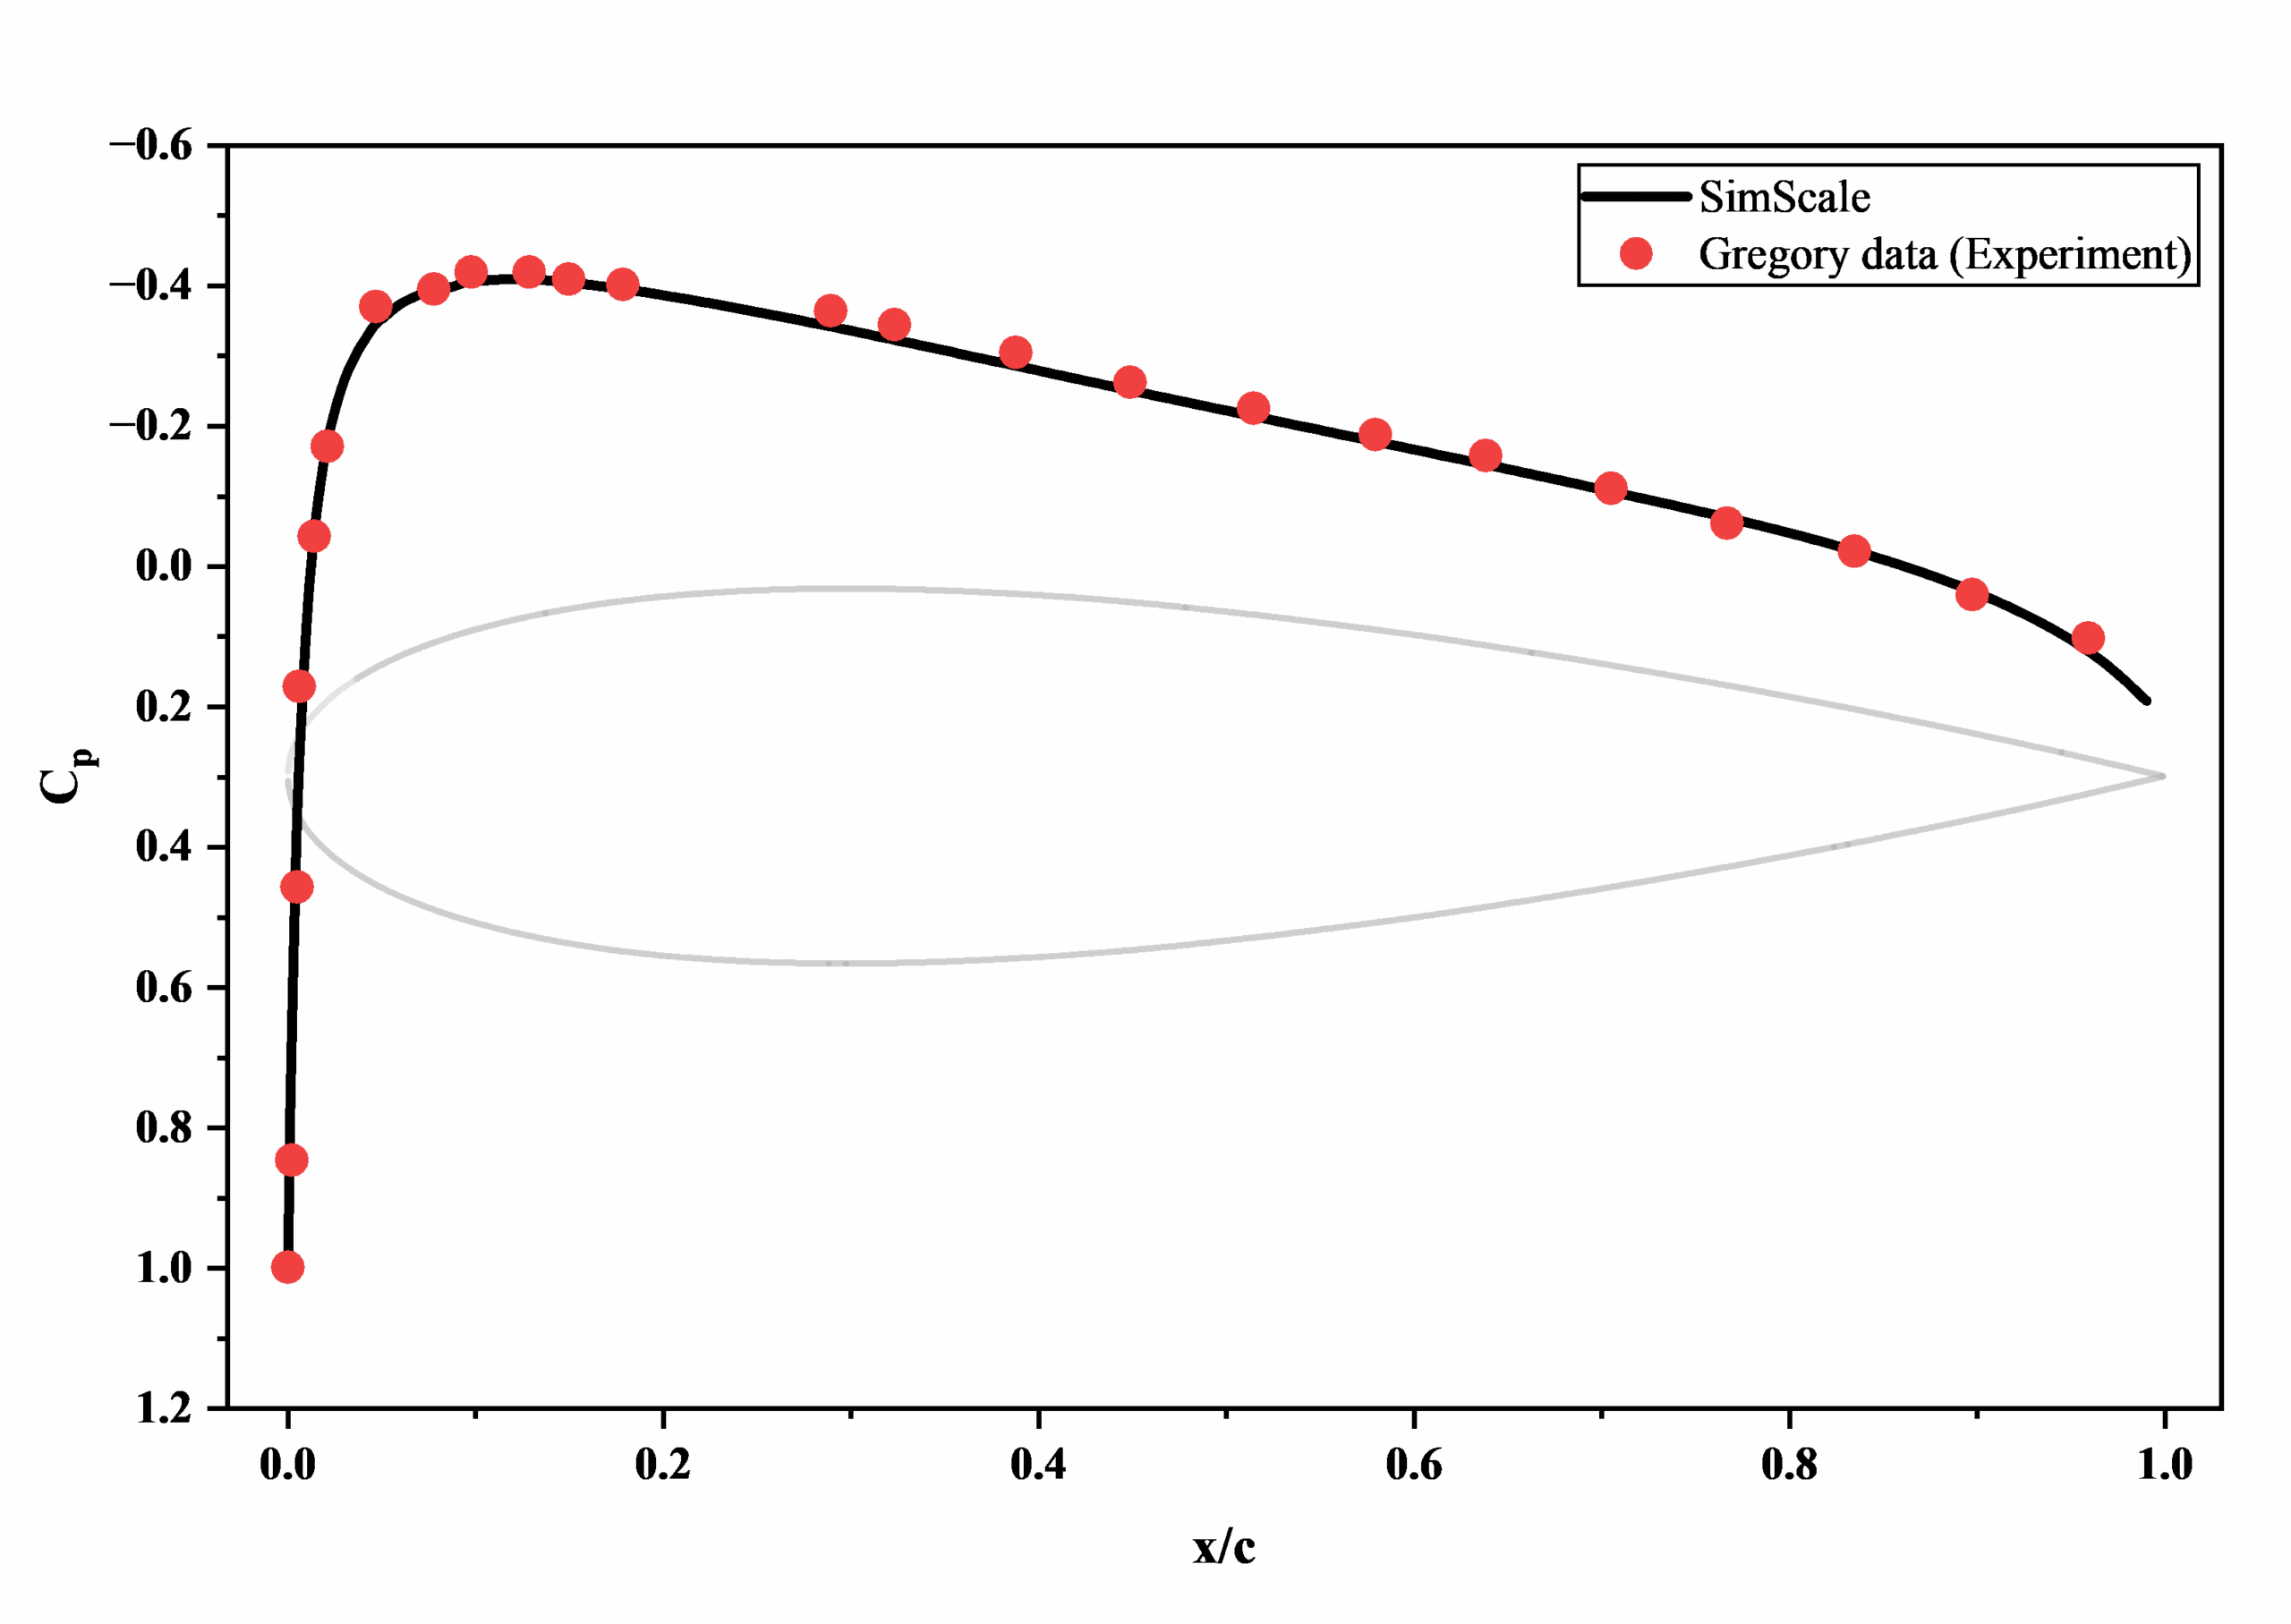
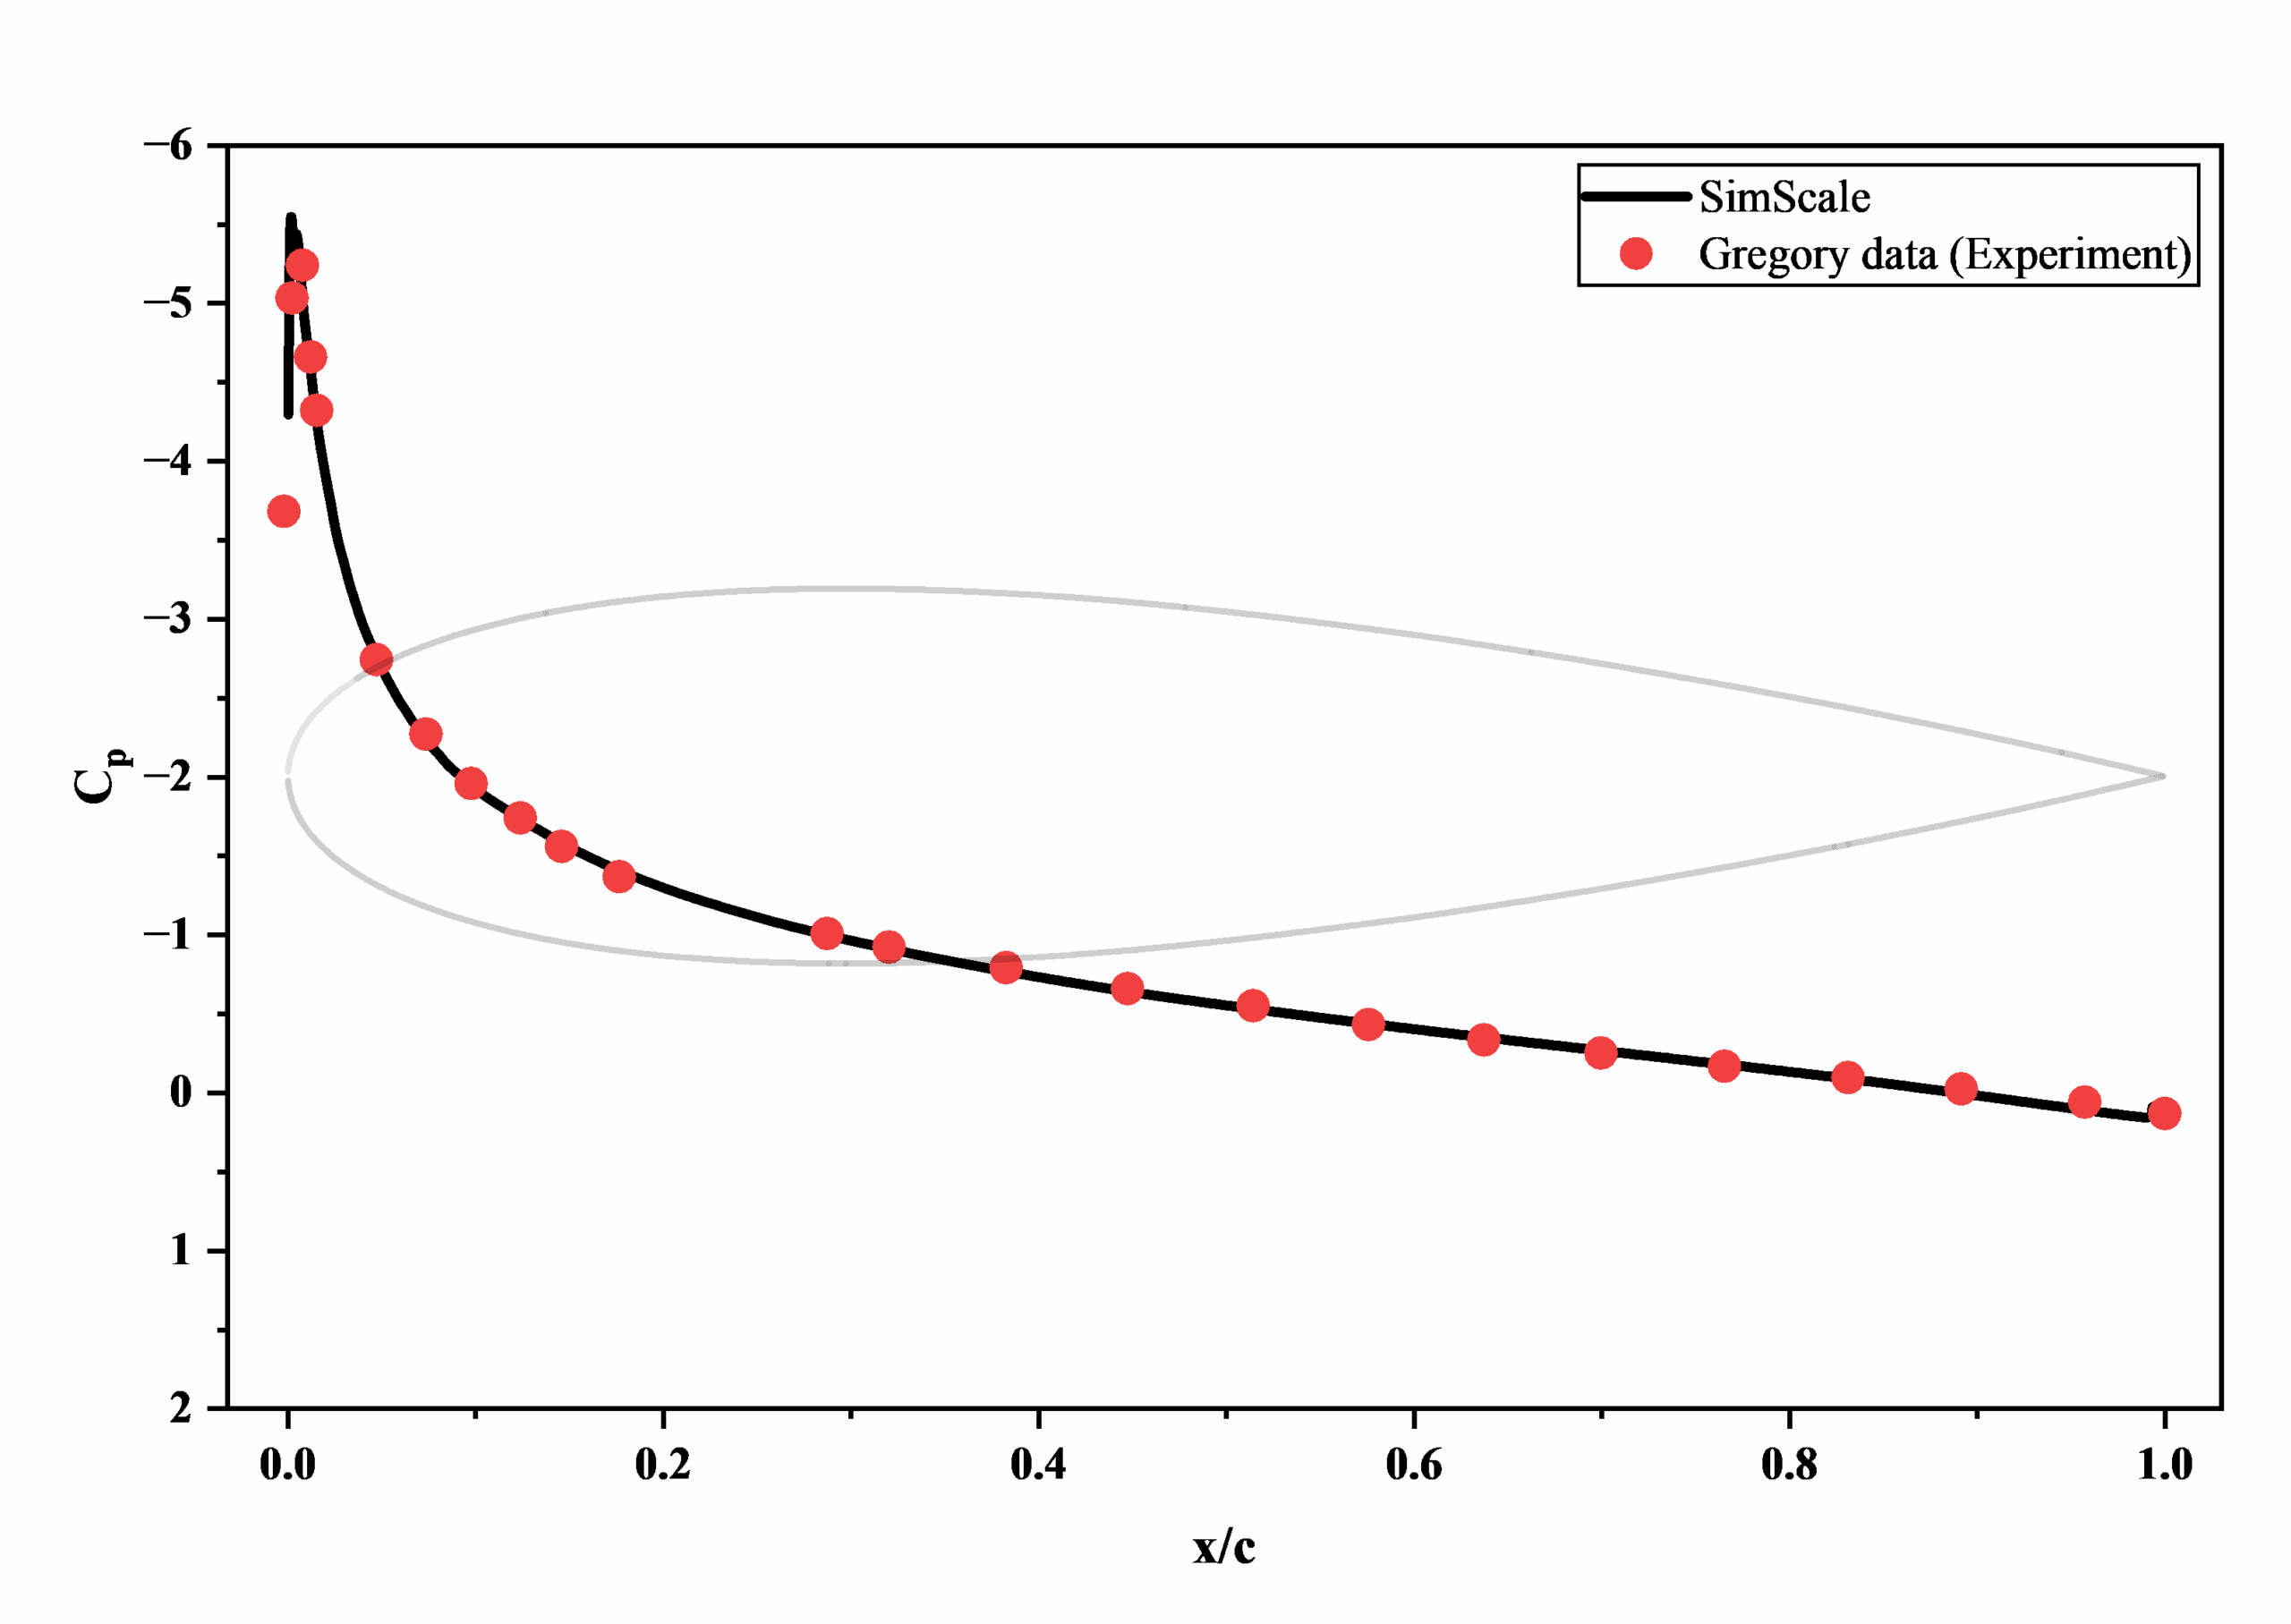
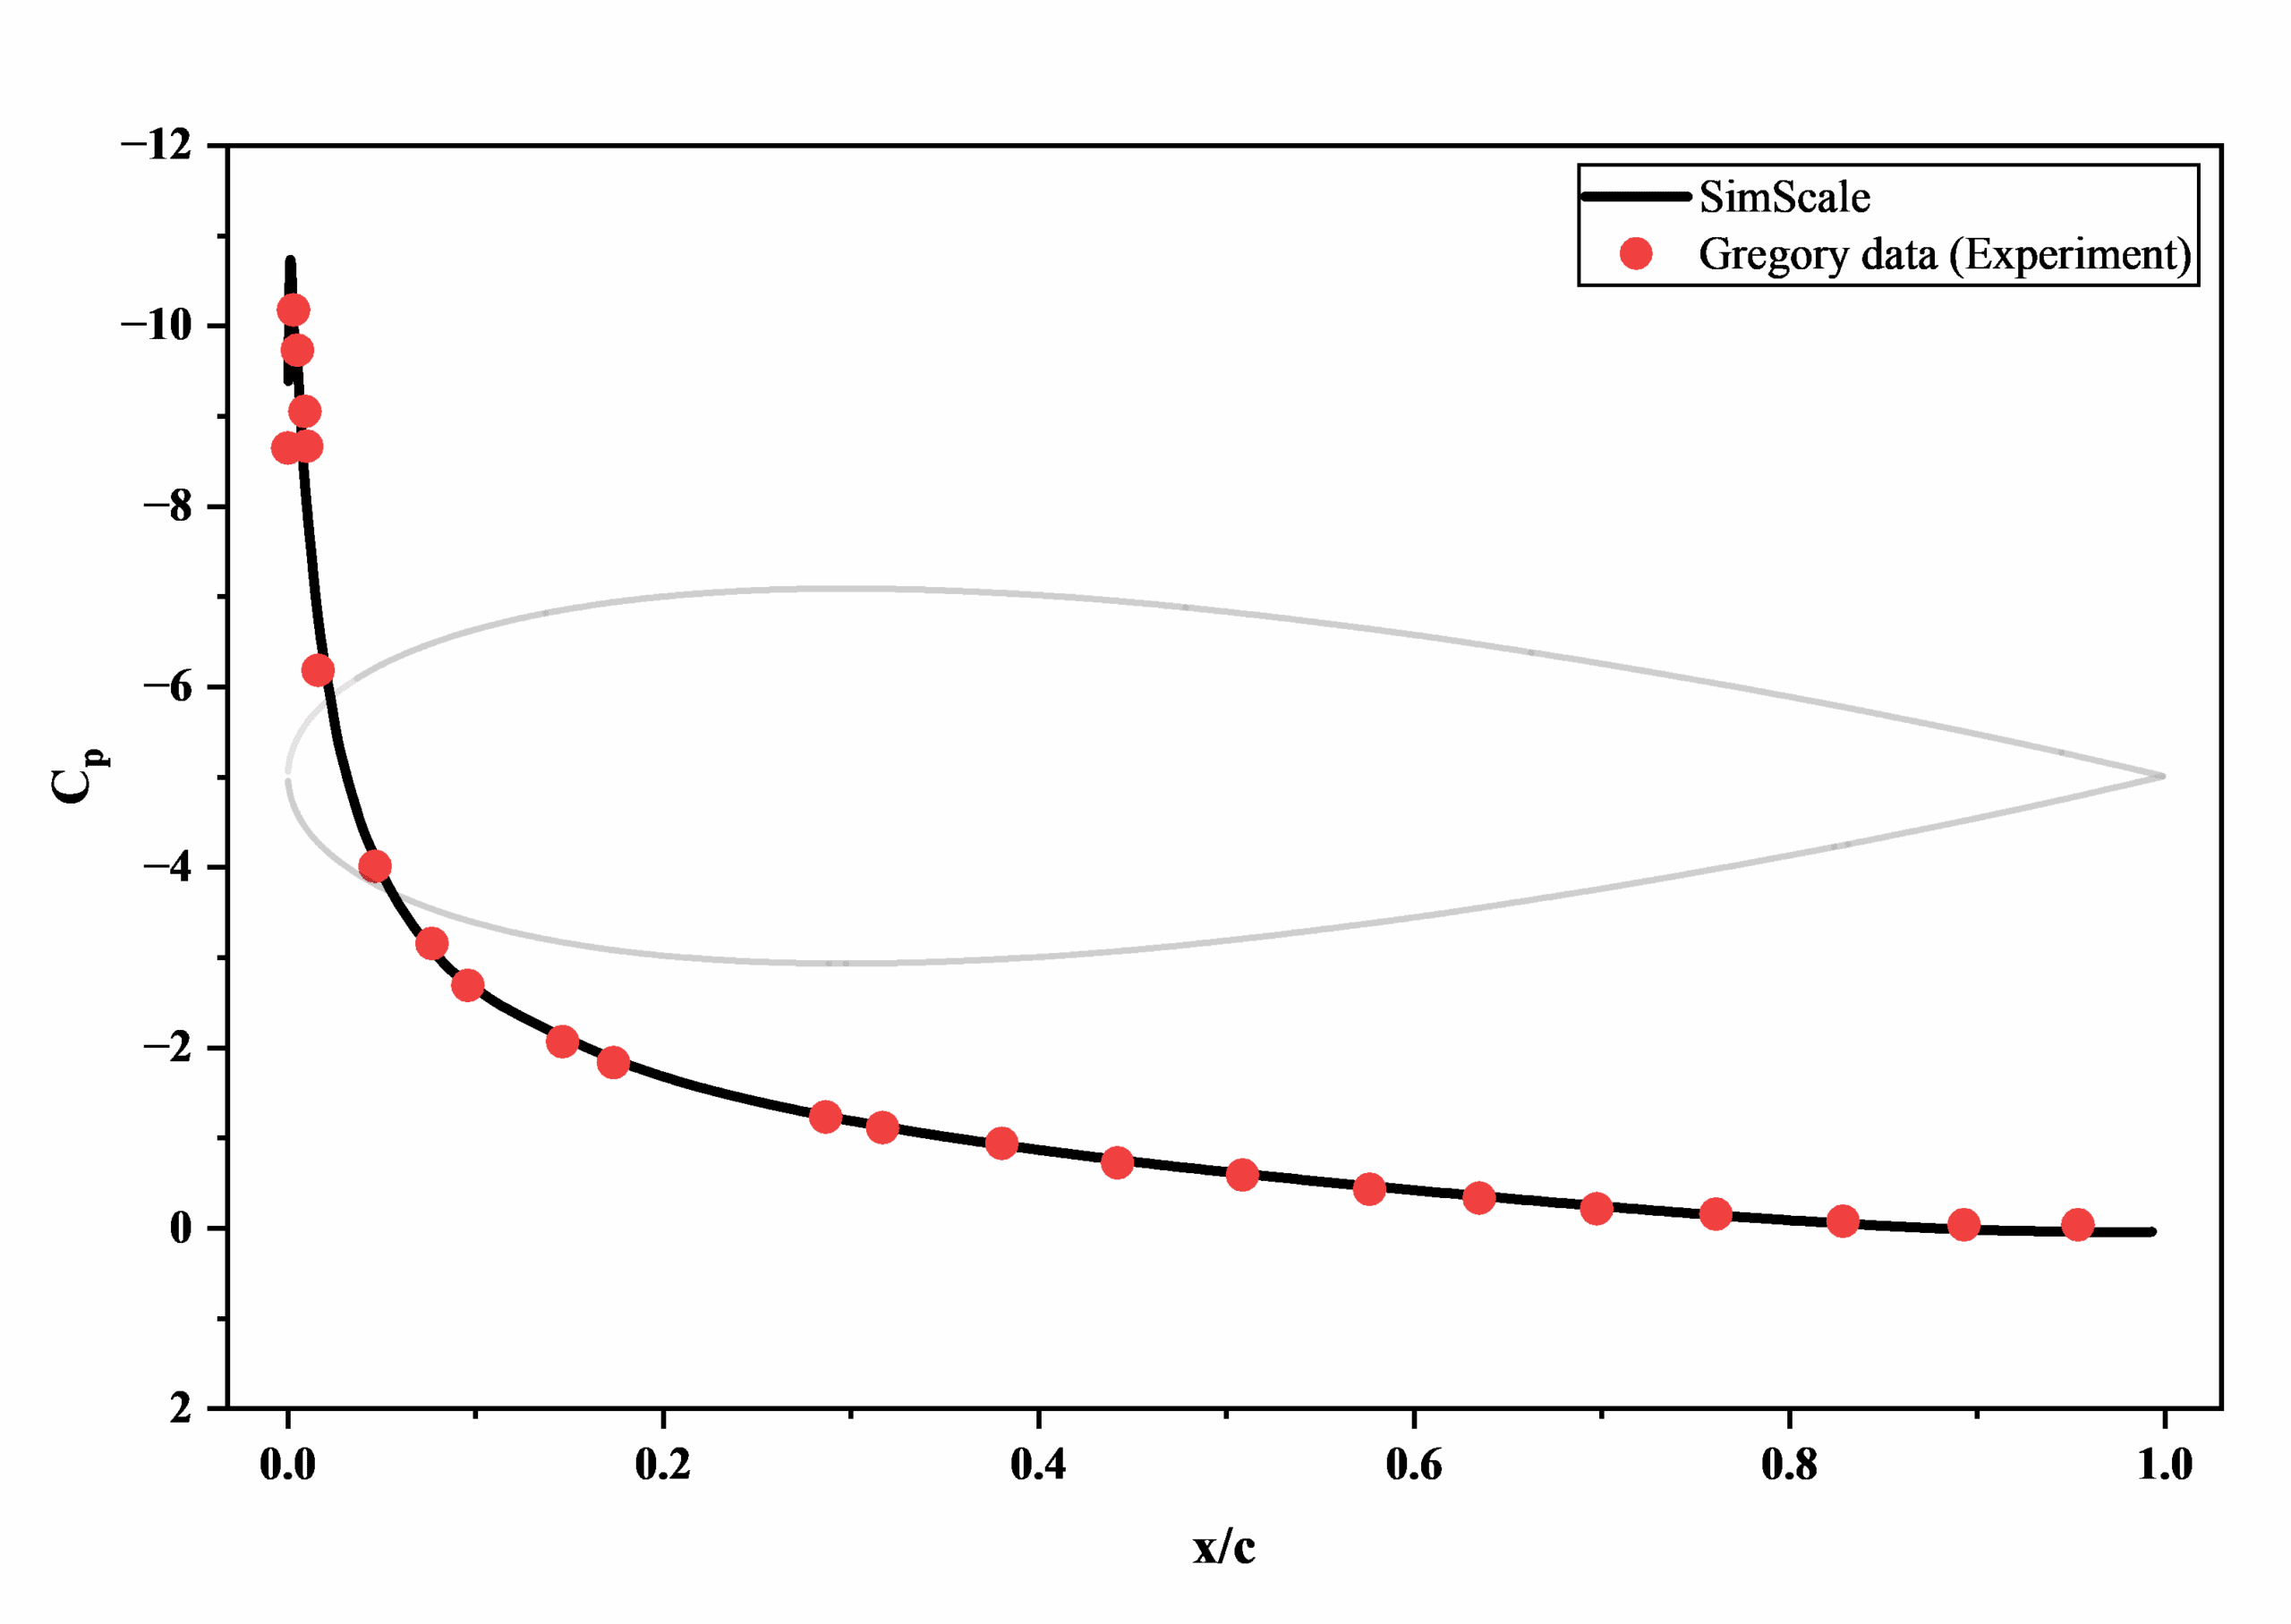
Figure 8 shows the velocity contours for the NACA 0012, considering an AoA of 15°. The contour shows the flow pattern, where we can see the boundary layer near the airfoil wall.
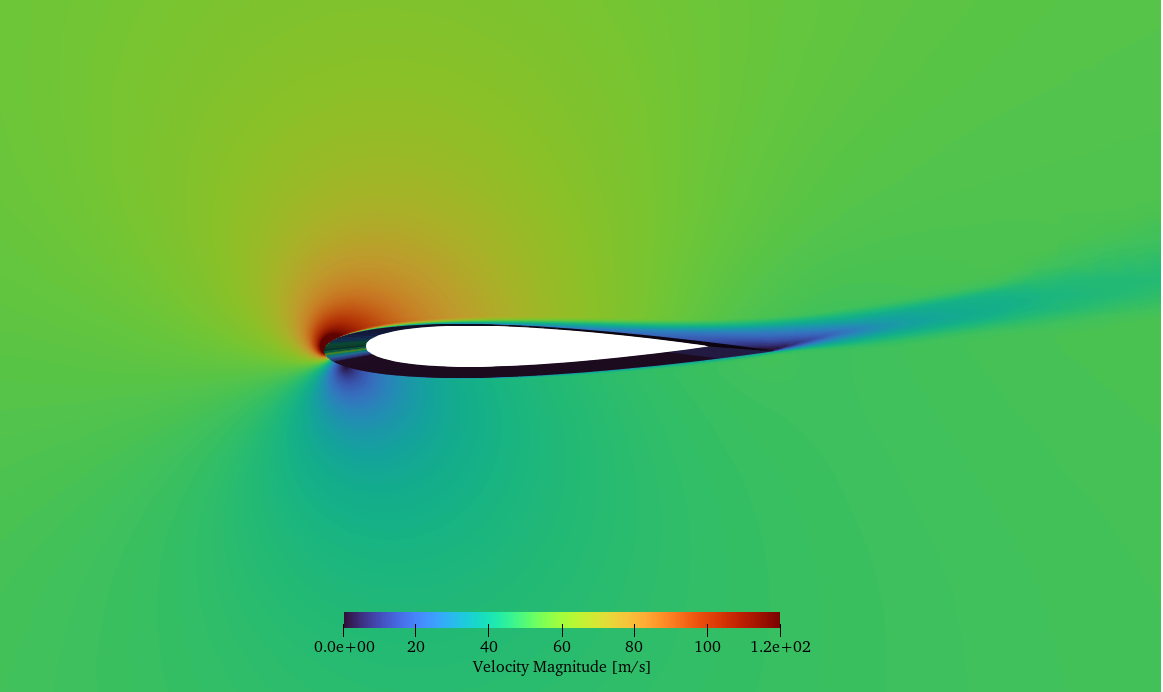
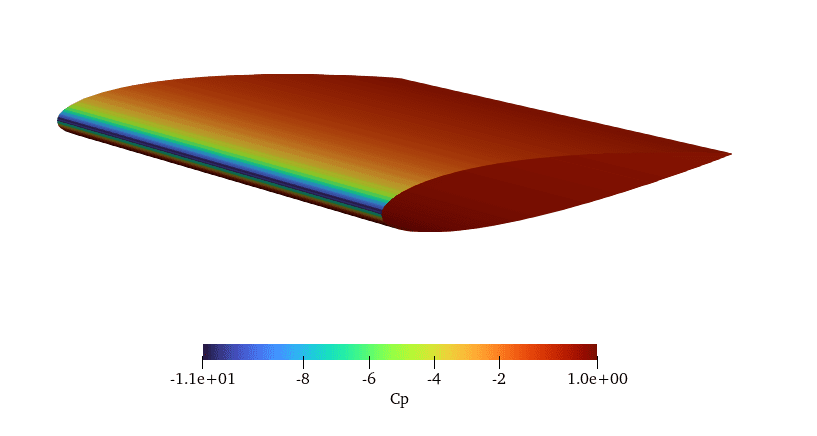
Figure 10 presents the pressure coefficient distribution for the NACA 0012 airfoil at an angle of attack of 15º. The figure highlights regions of higher pressure coefficient, which significantly influence the lift generation and overall aerodynamic performance of the airfoil, particularly in the context of its intended application.
Additional results can be explored by checking the simulations within the project.
References
Note
If you still encounter problems validating you simulation, then please post the issue on our forum or contact us.
Last updated: September 16th, 2025
We appreciate and value your feedback.
Sign up for SimScale
and start simulating now