Validation Case: Battery Pack Cooling
This validation case belongs to conjugate heat transfer, with the case of a battery pack cooling test. The aim of this project is to demonstrate the validity of SimScale’s CHT solver by performing a conjugate heat transfer analysis of an air-cooled battery pack by comparing the following parameters:
- Temperature of solid bodies
- Temperature of fluid
- Flow velocity profiles
The simulation results from SimScale were compared to the results presented in the reference paper [JILTE]\(^1\).
Geometry
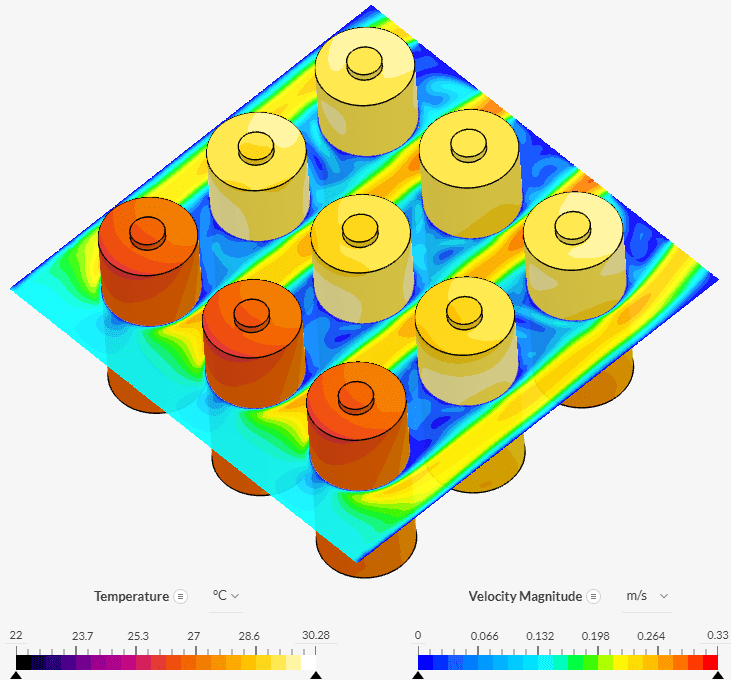
The battery pack consists of a 3×3 cell configuration, as illustrated in Figure 1:
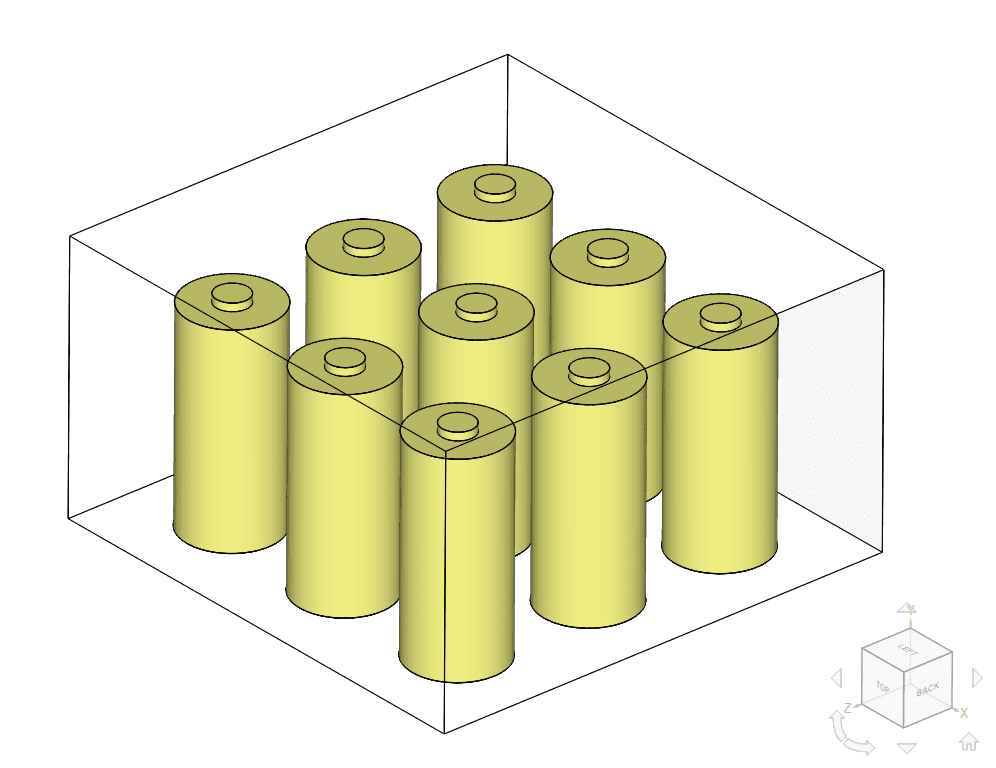
The cell geometry dimensions are taken from the parameters given in the reference paper\(^1\), except for the cell’s top tab, whose proportions are approximated from the pictures. The value for the number of cells \((N)\) is 9. The dimension values are given in Table 1:
| Parameter | Variable | Value \([mm]\) |
|---|---|---|
| Cell diameter | \(D\) | 42.4 |
| Cell height | \(H\) | 97.7 |
| Tab diameter | \(d\) | 15 |
| Tab height | \(h\) | 3.7 |
| Cell spacing | \(S_L\) | 63.6 |
| Enclosure width | \(W_E\) | 212 |
| Enclosure height | \(H_E\) | 140.1 |
Analysis Type and Mesh
Tool Type: OpenFOAM®
Analysis Type: Conjugate Heat Transfer (CHT)
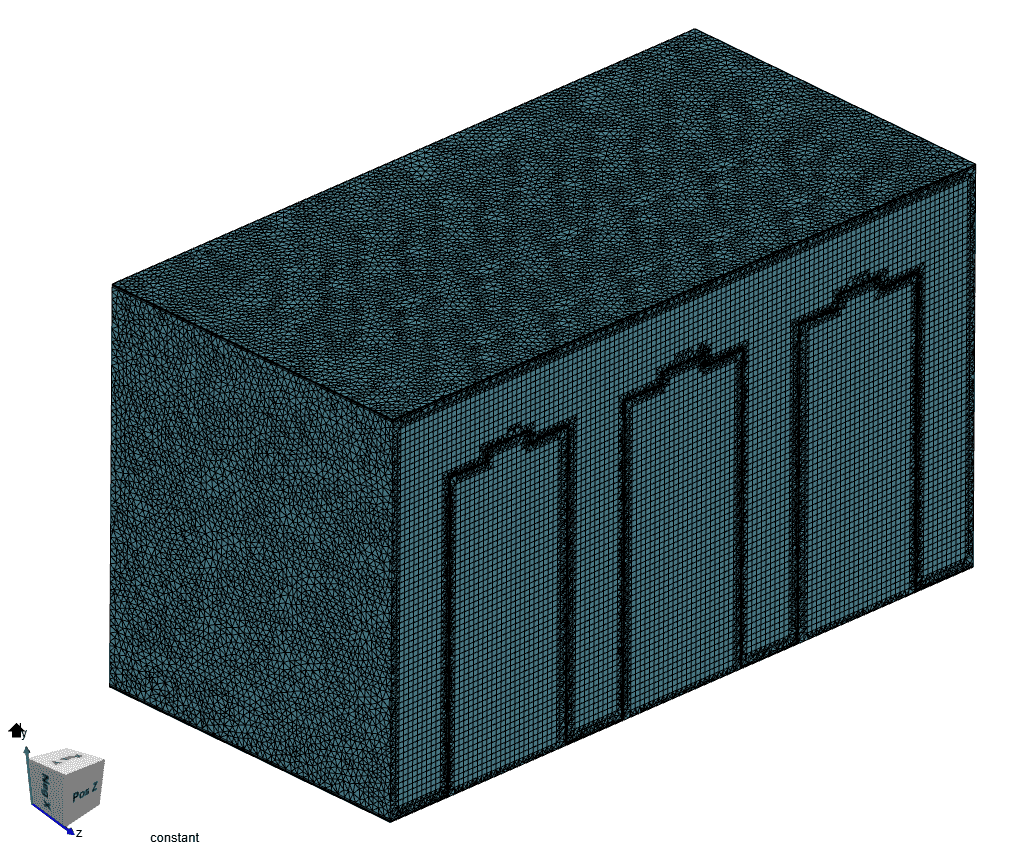
Mesh and Element Types:
The meshes were computed using SimScale’s Standard meshing algorithm:
| Mesh # | Mesh Type | Number of Cells | Setup |
|---|---|---|---|
| 1 | Standard | 2829369 | Fineness 7 |
| 2 | Standard | 2986029 | Fineness 5, manual refinement 0.002 \(m\) and boundary layers |
| 3 | Standard | 13405081 | Fineness 5, manual refinement 0.001 \(m\) and boundary layers |
| 4 | Standard | 3973759 | Fineness 5, manual refinement 0.0015 \(m\) and boundary layers |
Simulation Setup
Model:
- Flow compressibility: Incompressible/Compressible
- Time dependency: Steady state
- Turbulence model: Laminar
- Incompressible Working Fluid (Air):
- (\(\nu\)) Kinematic viscosity: 1.529e-5 \(m^2/s\)
- (\(\rho\)) Density: 1.196 \(kg/m^3\)
- Thermal expansion coefficient: 3.43e-3 \(1/K\)
- (\(T_0\)) Reference temperature: 273.1 \(K\)
- (\(Pr_{lam}\)) Laminar Prandtl number: 0.713
- (\(Pr_{t}\)) Turbulent Prandtl number: 0.85
- Specific heat: 1004 \(J/(kg.K)\)
- Compressible Working Fluid (Air):
- (\(M_m\)) Molar mass: 28.97 \(kg/kml\)
- Transport: Const
- (\(\mu\)) Dynamic viscosity: 1.83e-5 \(kg/s.m\)
- (\(Pr\)) Prandtl number: 0.713
- (\(Pr_{t}\)) Turbulent Prandtl number: 0.85
- Thermal model: hConst (Constant entalphy)
- Specific heat: 1004 \(J/(kg.K)\)
- Equation of state: Perfect gas
- Solid Material (Cells):
- Conductivity type: Isotropic
- (\(\kappa\)) Thermal conductivity: 1 \(W/(m.K)\)
- Specific heat: 837.4 \(J/(kg.K)\)
- Equation of state: Constant density
- (\(\rho\)) Density: 2008 \(kg/m^2\)
Two simulations were run using the compressible fluid model, in order to test the accuracy of the Boussinesq approximation in the incompressible solver.
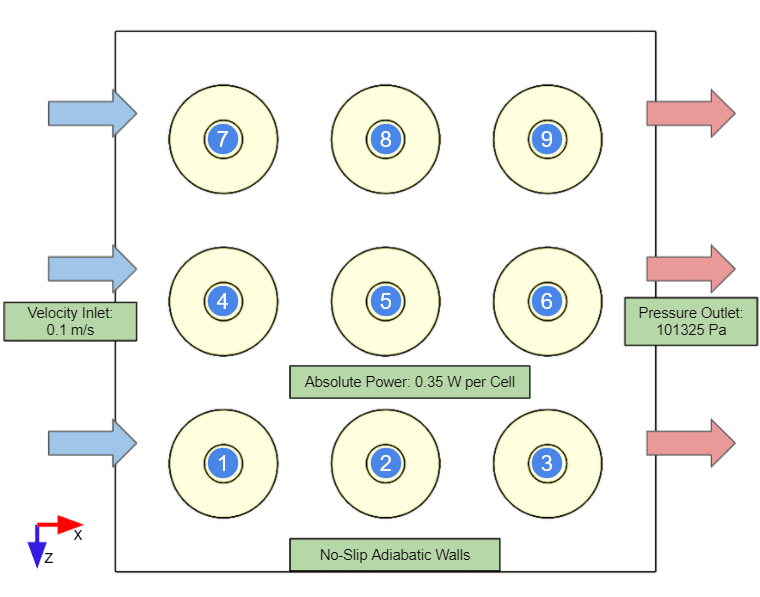
Boundary Conditions:
- Velocity Inlet: 0.1 \(m/s\)
- Pressure Outlet: 101 325 \(Pa\) – Fixed value
- Absolute power source on cells: 0.35 \(W\)
- External walls: No slip flow, adiabatic.
Reference Solution
The reference solution for the battery pack cooling is of the numerical type, as developed in [JILTE]\(^1\). It was computed using the Ansys FLUENT 6.3 CFD package. The reference simulation is transient, thus approximations were required to compare the results to SimScale’s steady-state CHT solver.
The reference solutions are the temperature and velocity fields, measured at different locations:
- Area average temperatures at cells 4, 5 and 6 (refer to Figure 3).
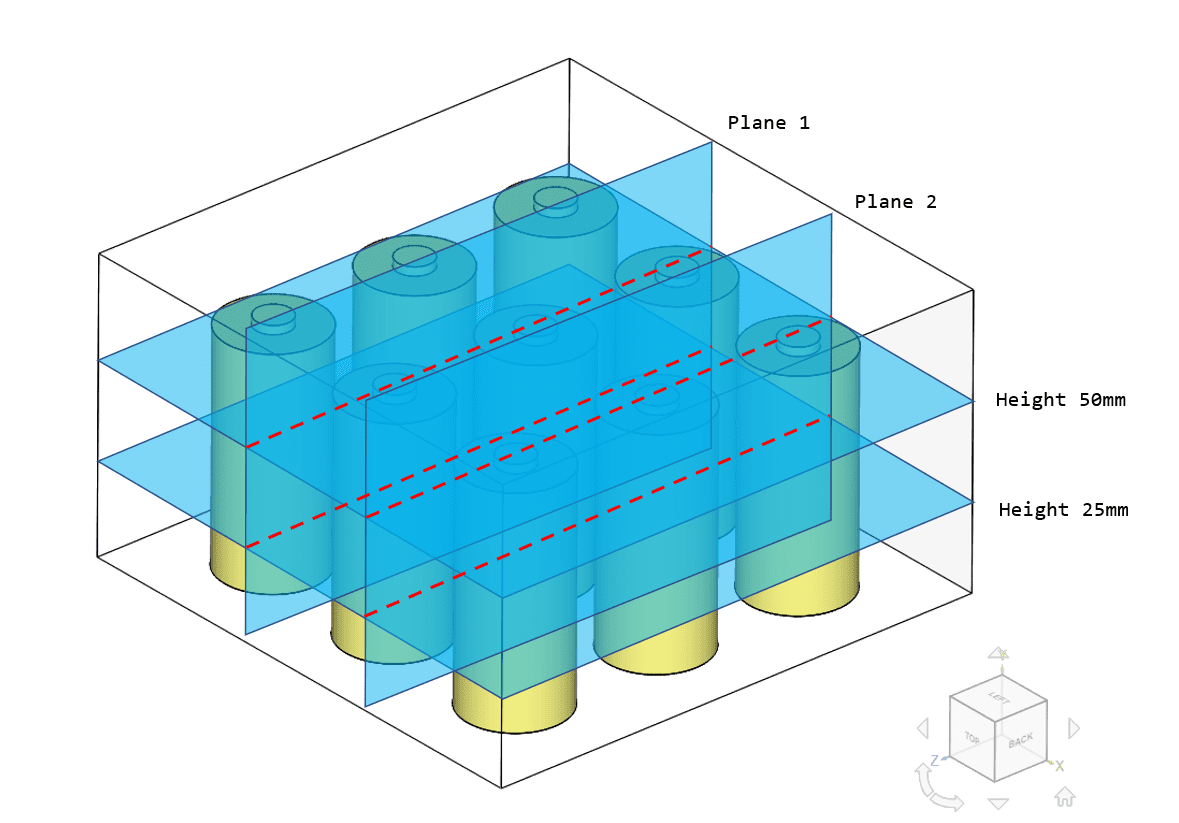
- Converged temperature profile in two planes perpendicular to the flow direction, between rows 1 and 2 (Plane 1) and between rows 2 and 3 (Plane 2) of the cells. The profile is reported along lines at two different heights in the planes, 25 and 50 \(mm\).
- Flow velocity magnitude profile for Plane 1 at heights as described above.
Results Comparison
For the average temperature across cells, the comparison of the different meshes shows the convergence behavior:
| Temperature Location | Mesh 1 \([°C]\) | Mesh 2 \([°C]\) | Mesh 3 \([°C]\) | Mesh 4 \([°C]\) | Final Deviation |
|---|---|---|---|---|---|
| Cell 4 Average | 25.40 | 25.50 | 26.90 | 26.90 | 0.00% |
| Cell 5 Average | 26.90 | 27.10 | 29.10 | 29.00 | -0.34 % |
| Cell 6 Average | 27.30 | 27.30 | 28.90 | 29.00 | 0.34% |
It was found that Mesh 4 is optimal because it captures the converged results while using a smaller cell count than Mesh 3.
Comparison of the computed values in SimScale with Mesh 3 (finest) and the reference solution is shown below:
| Temperature Location | SimScale Result (Mesh 3) | Reference Result | Deviation |
|---|---|---|---|
| Cell 4 Average | 26.90 | 27.17 | -0.99 % |
| Cell 5 Average | 29.10 | 27.32 | 6.52 % |
| Cell 6 Average | 28.90 | 27.18 | 6.33 % |
A maximum temperature deviation of 1.7 \(°C\) is observed at Cell 6, between SimScale and the reference results. This corresponds to an error of 6.33% in the battery pack cooling strategy.
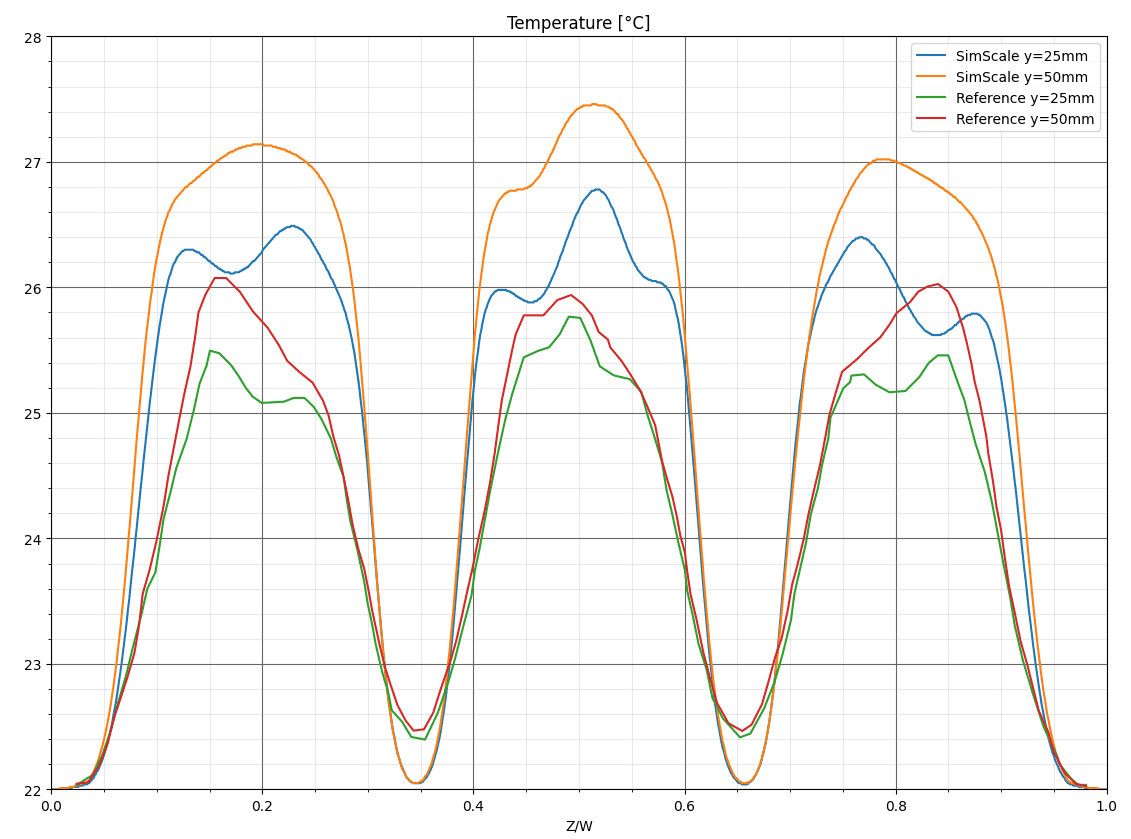
The temperature profiles comparison in Plane 1 is presented at two heights, 25 and 50 \(mm\). ‘Reference’ curves correspond to the paper results, and ‘SimScale’ curves correspond to the Mesh 3 results.
The same comparison is performed for Plane 2:
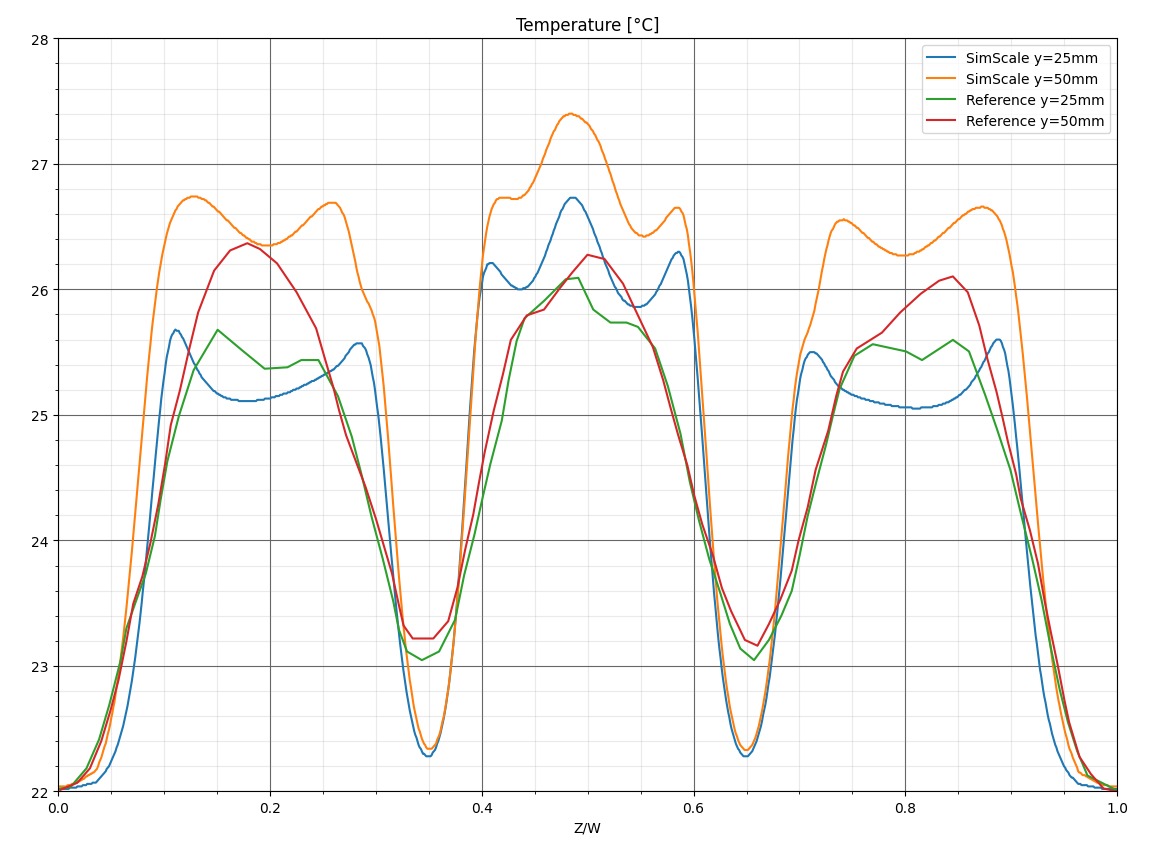
The deviation of air temperature with respect to reference values is within 2 \(°C\). Similar to cell temperatures, air temperature values are mostly over predicted.
The comparison of flow velocity magnitude profiles for Plane 1 is presented below:
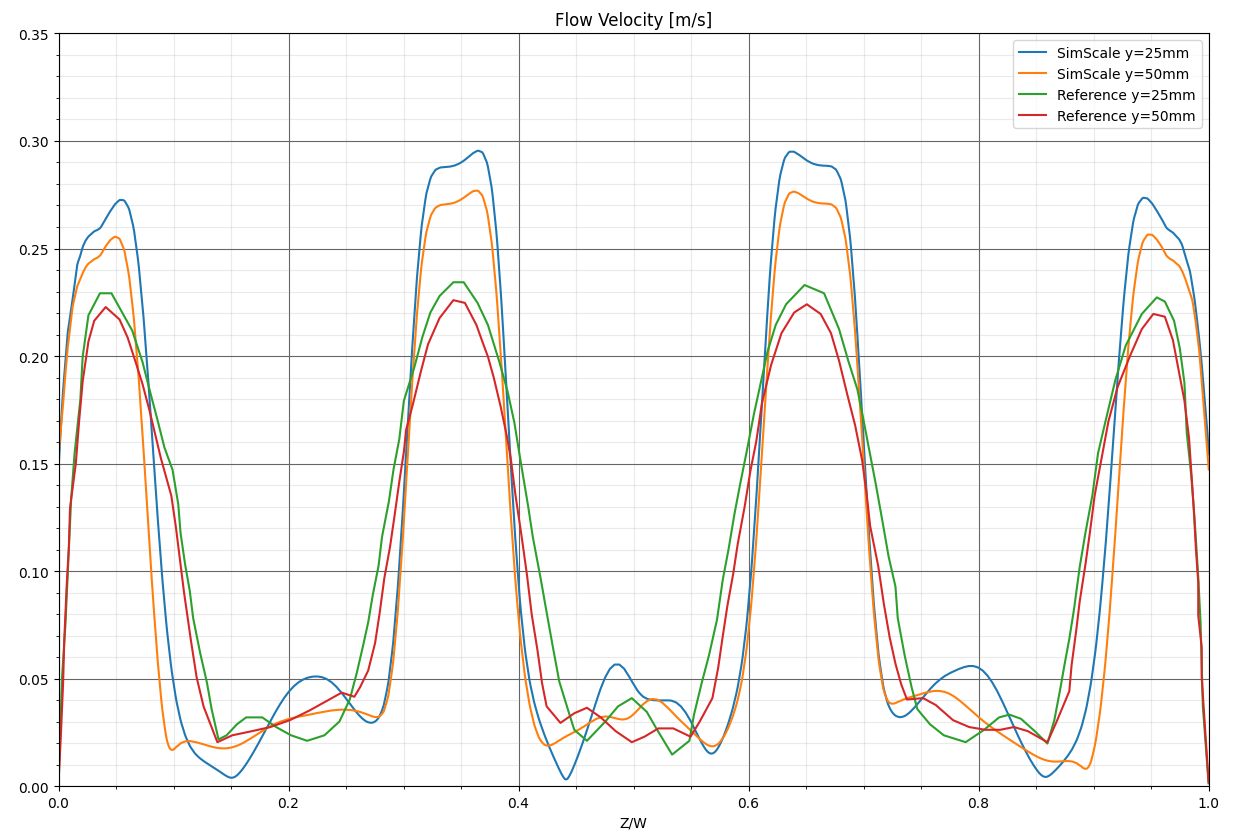
The maximum velocity values are over-predicted by SimScale by a maximum of around 0.06 \(m/s\). This error can be attributed to the comparison of steady-state to transient results.
Finally, for the verification of the Boussinesq approximation, the temperature and velocity profiles are compared for results of runs using compressible and incompressible flow models. The velocity magnitude and temperature profiles are presented for Plane 1:
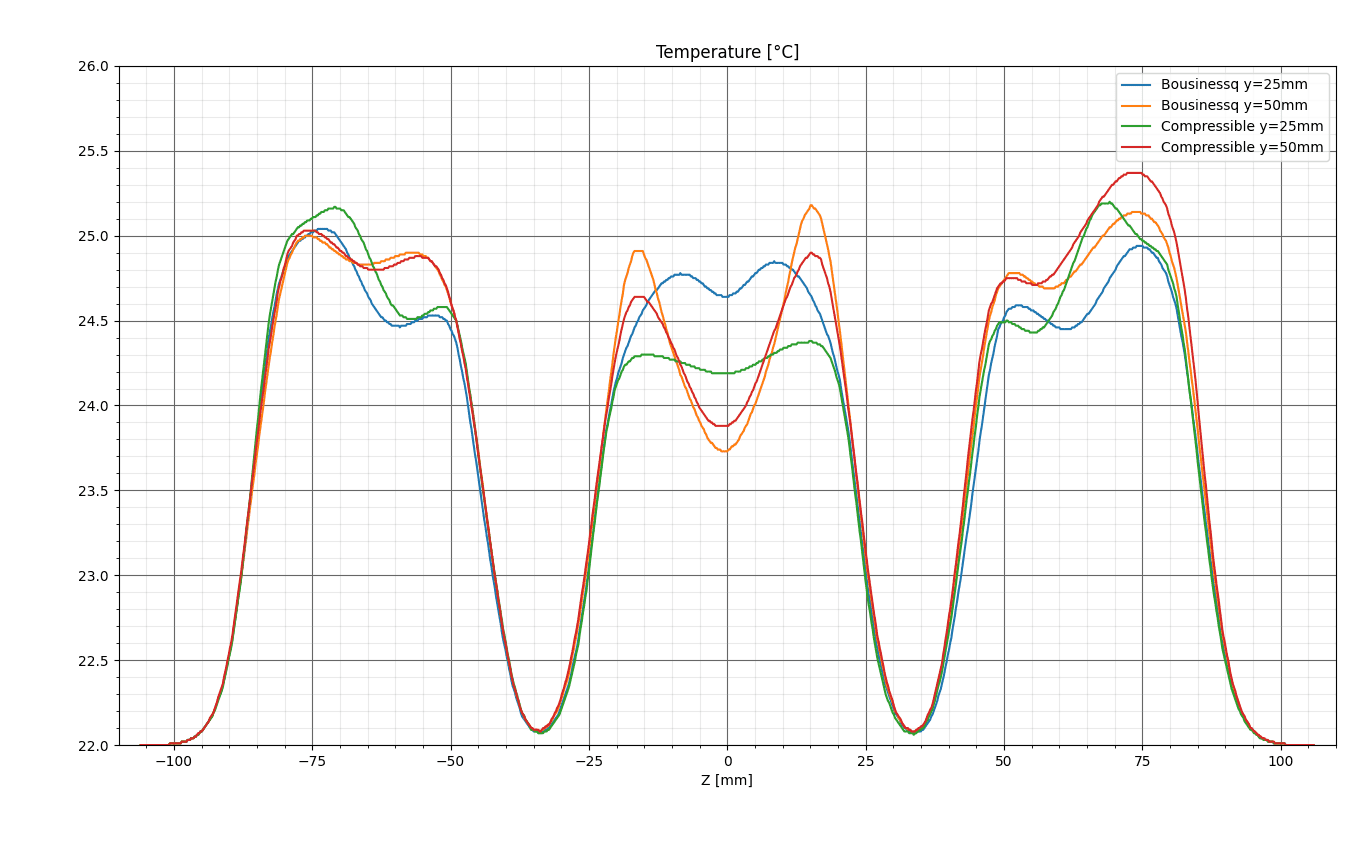
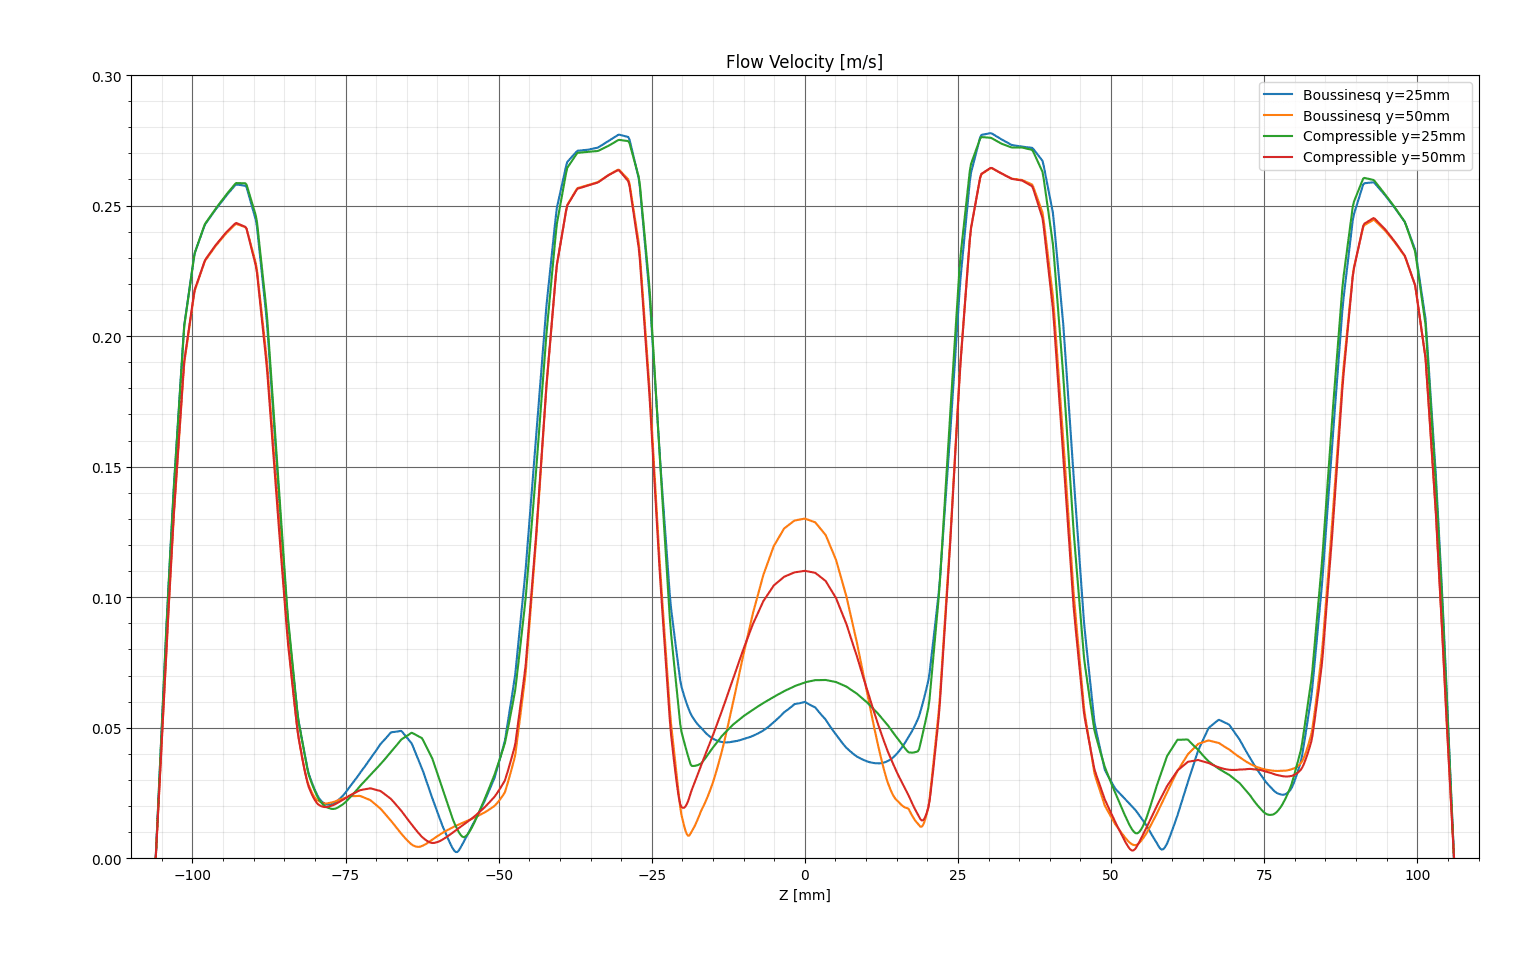
Good correlation is achieved between profiles using Boussinesq approximation and compressible flow, thus it is determined that the air velocity profile is independent of the approximation.
References
- R.D. Jilte, Raviden Kumar – Numerical investigation on cooling performance of Li-ion battery thermal management system at high galvanostatic discharge – Engineering Science and Technology, an International Journal – Elsevier – Octuber 2018
Note
If you still encounter problems validating you simulation, then please post the issue on our forum or contact us.
Last updated: December 16th, 2025
Did this article solve your issue?
How can we do better?
We appreciate and value your feedback.


