What is Fatigue Analysis?
Fatigue analysis is a critical step in designing and optimizing products that require high durability and reliability. Fatigue failure analysis helps identify the points of failure and prevent product malfunctions, recalls, or even catastrophic events. By simulating the expected part loading, engineers can optimize their designs for fatigue resistance, reliability, and performance.
What is Fatigue?
Fatigue is a failure mechanism in materials that occurs when a material is subjected to cyclic loading. In fatigue failure, cracks form in the material under repeated loadings even though the applied stress is lower than the yield stress or stress required to damage the material with a single application of the load.
Types of Fatigue
There are two main types of fatigue:
- Low cycle fatigue – When the material cracks and fails due to stress amplitudes that are slightly less than the material’s yield stress and the number of cycles is fairly low (less than 10,000 cycles)
- High cycle fatigue – When the material cracks and fails due to stress amplitudes much less than the material’s yield stress and the number of cycles is fairly high (greater than 10,000 cycles)
The Three Stages of Fatigue Failure
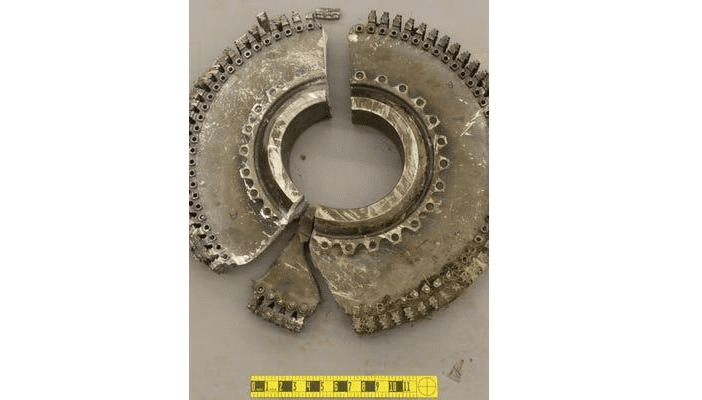
Fatigue failure is a progressive process that takes place due to the load’s cyclic nature. This causes microscopic flaws in the material that can gradually grow into macroscopic cracks. From there on, fatigue follows three successive stages that end up in fracture:
- Crack Initiation (Crack Formation): A crack develops under dynamic loading at a stress concentration point on a material’s surface due to an embedded particle, structural discontinuity, high temperature, or even weld defects. The crack initiation area is extremely small, not exceeding 5 grains around its origin. As the crack forms, the stress concentration increases significantly, which leads the crack to propagate deeper into the material under repeated loading.
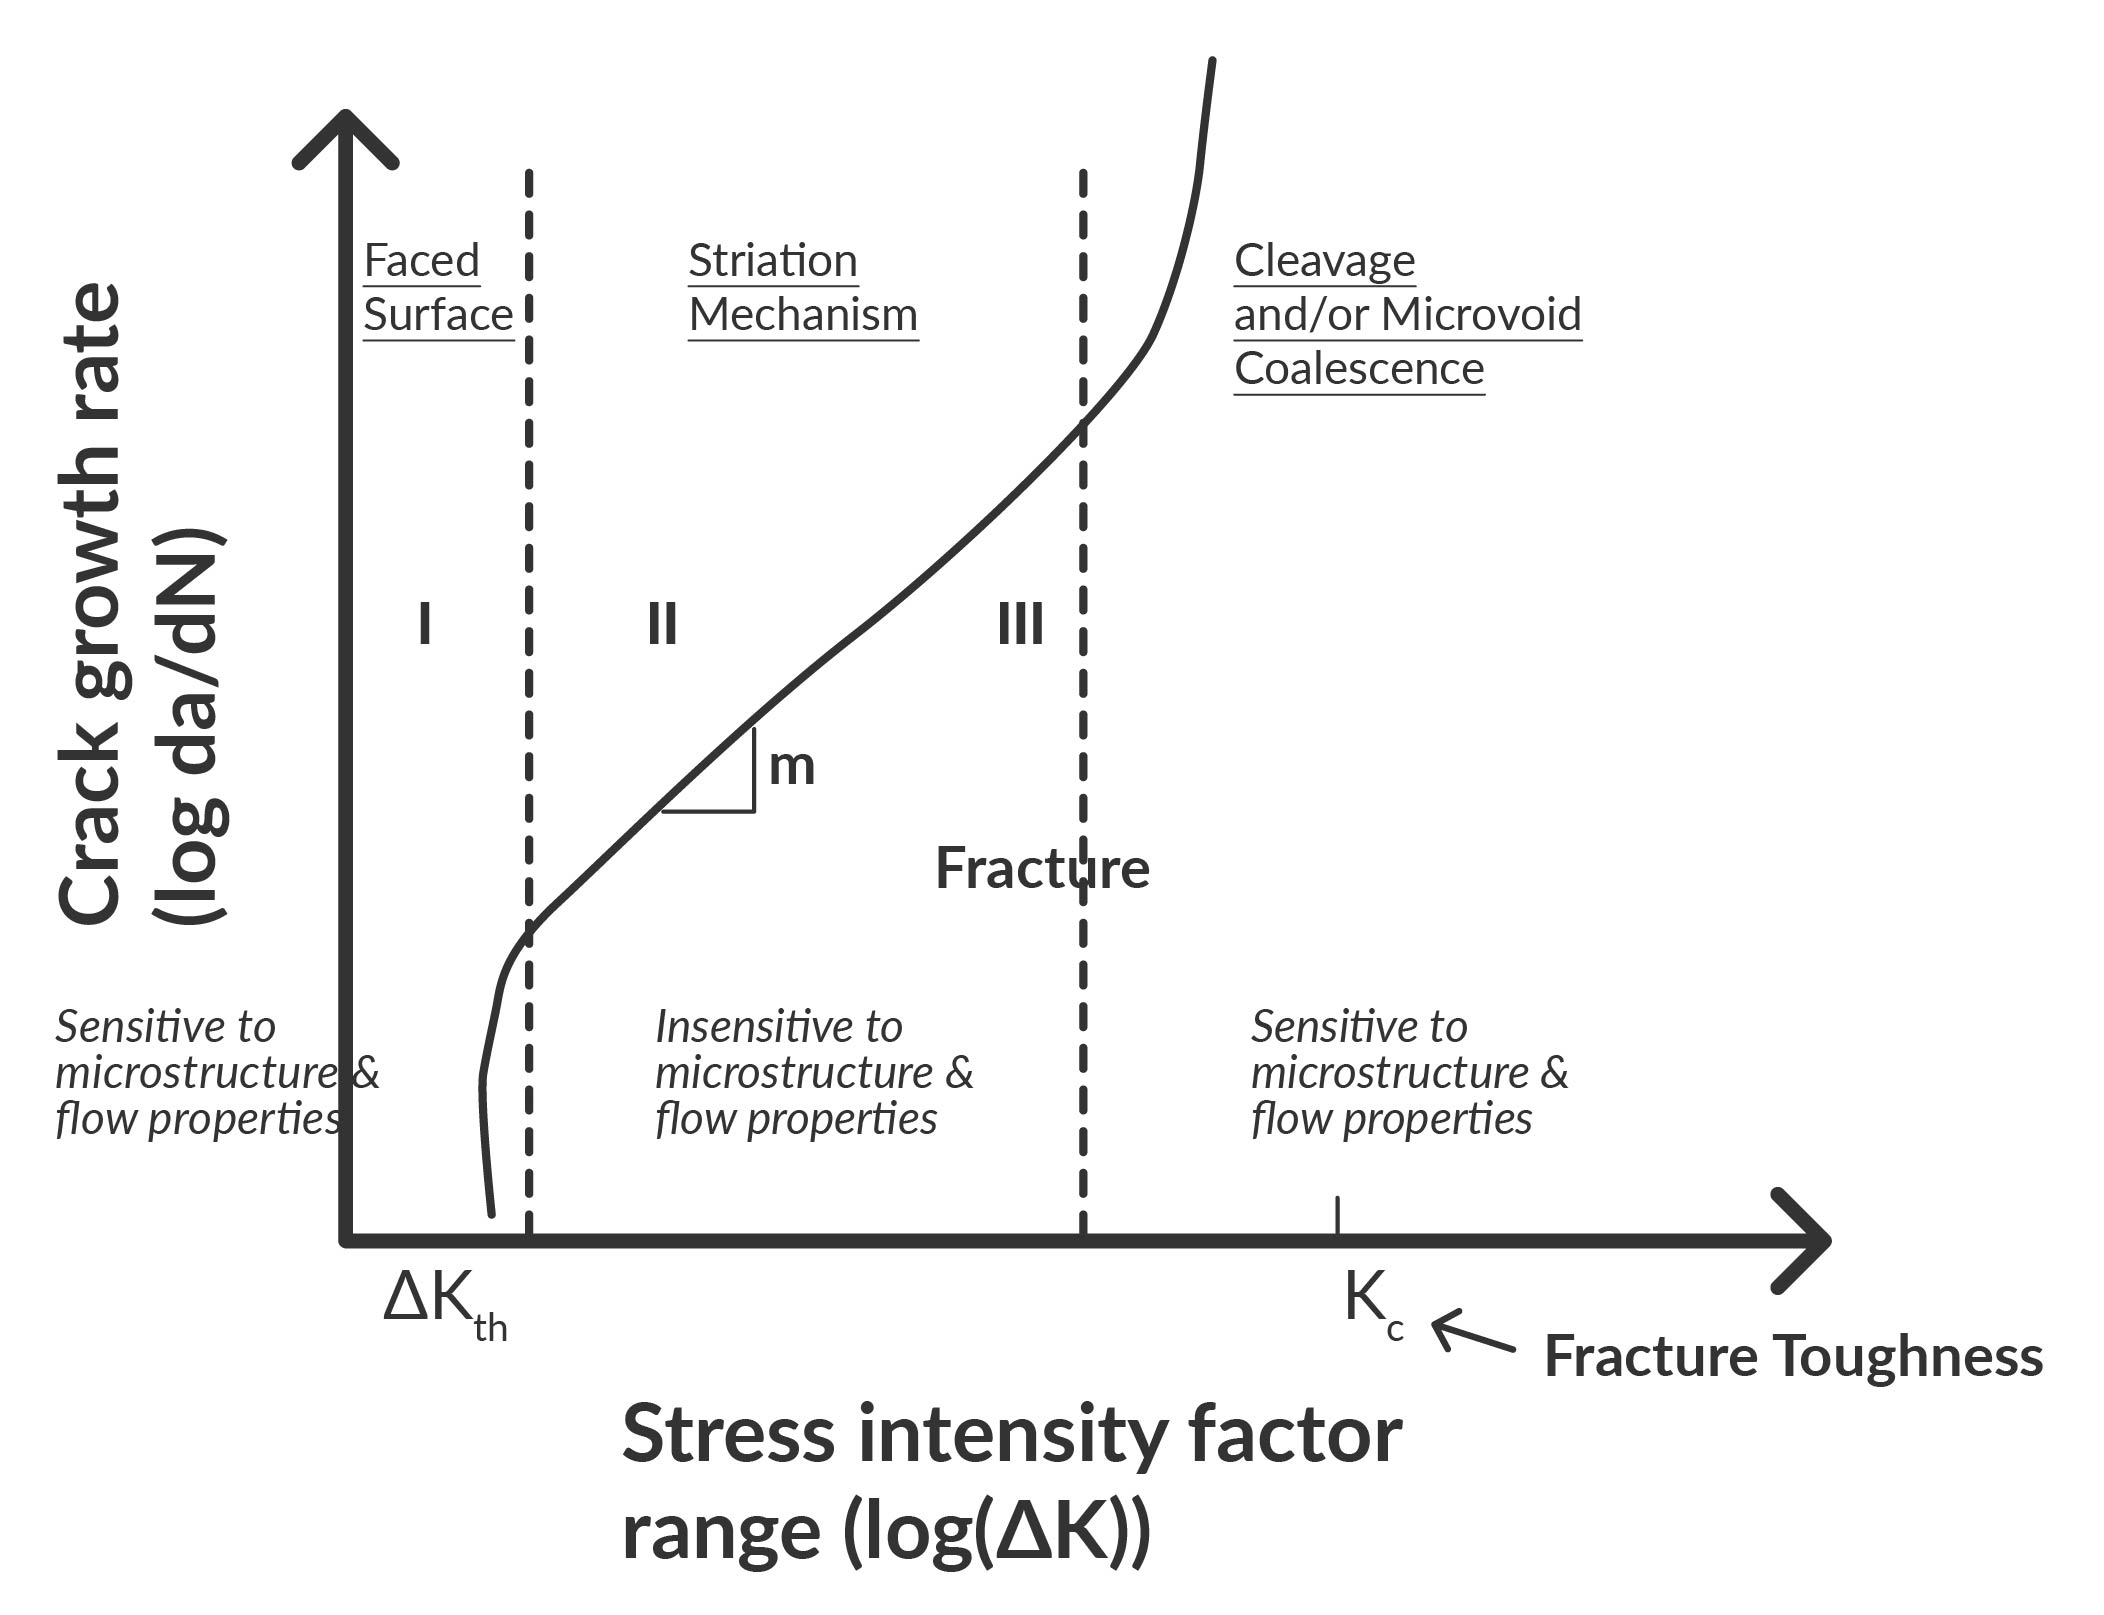
- Crack Propagation: The crack begins to grow and propagate through the material. Crack propagation can be divided into three substages based on the measurement of the stress intensity factor (K), which is used to determine the stress at the crack notch:
- Small K values: The propagation of the crack is hard to predict as it depends on the material’s microstructure. Here, the crack may not grow at all.
- K increases in value: The rate of propagation becomes more dependent on the material rather than the microstructure. This is when most of the crack propagation takes place.
- High K values: The propagation rate accelerates quickly until the material fails to hold on together, and fracture takes place.
- Rapid Fracture: At this stage, the material completely fails under cyclic loading and fractures sharply.
Methods of Fatigue Analysis
There are several methods involved in fatigue analysis, most prominently are:
- The stress-life method
- The strain-life method
- Linear Elastic Fracture Mechanics (LEFM) method
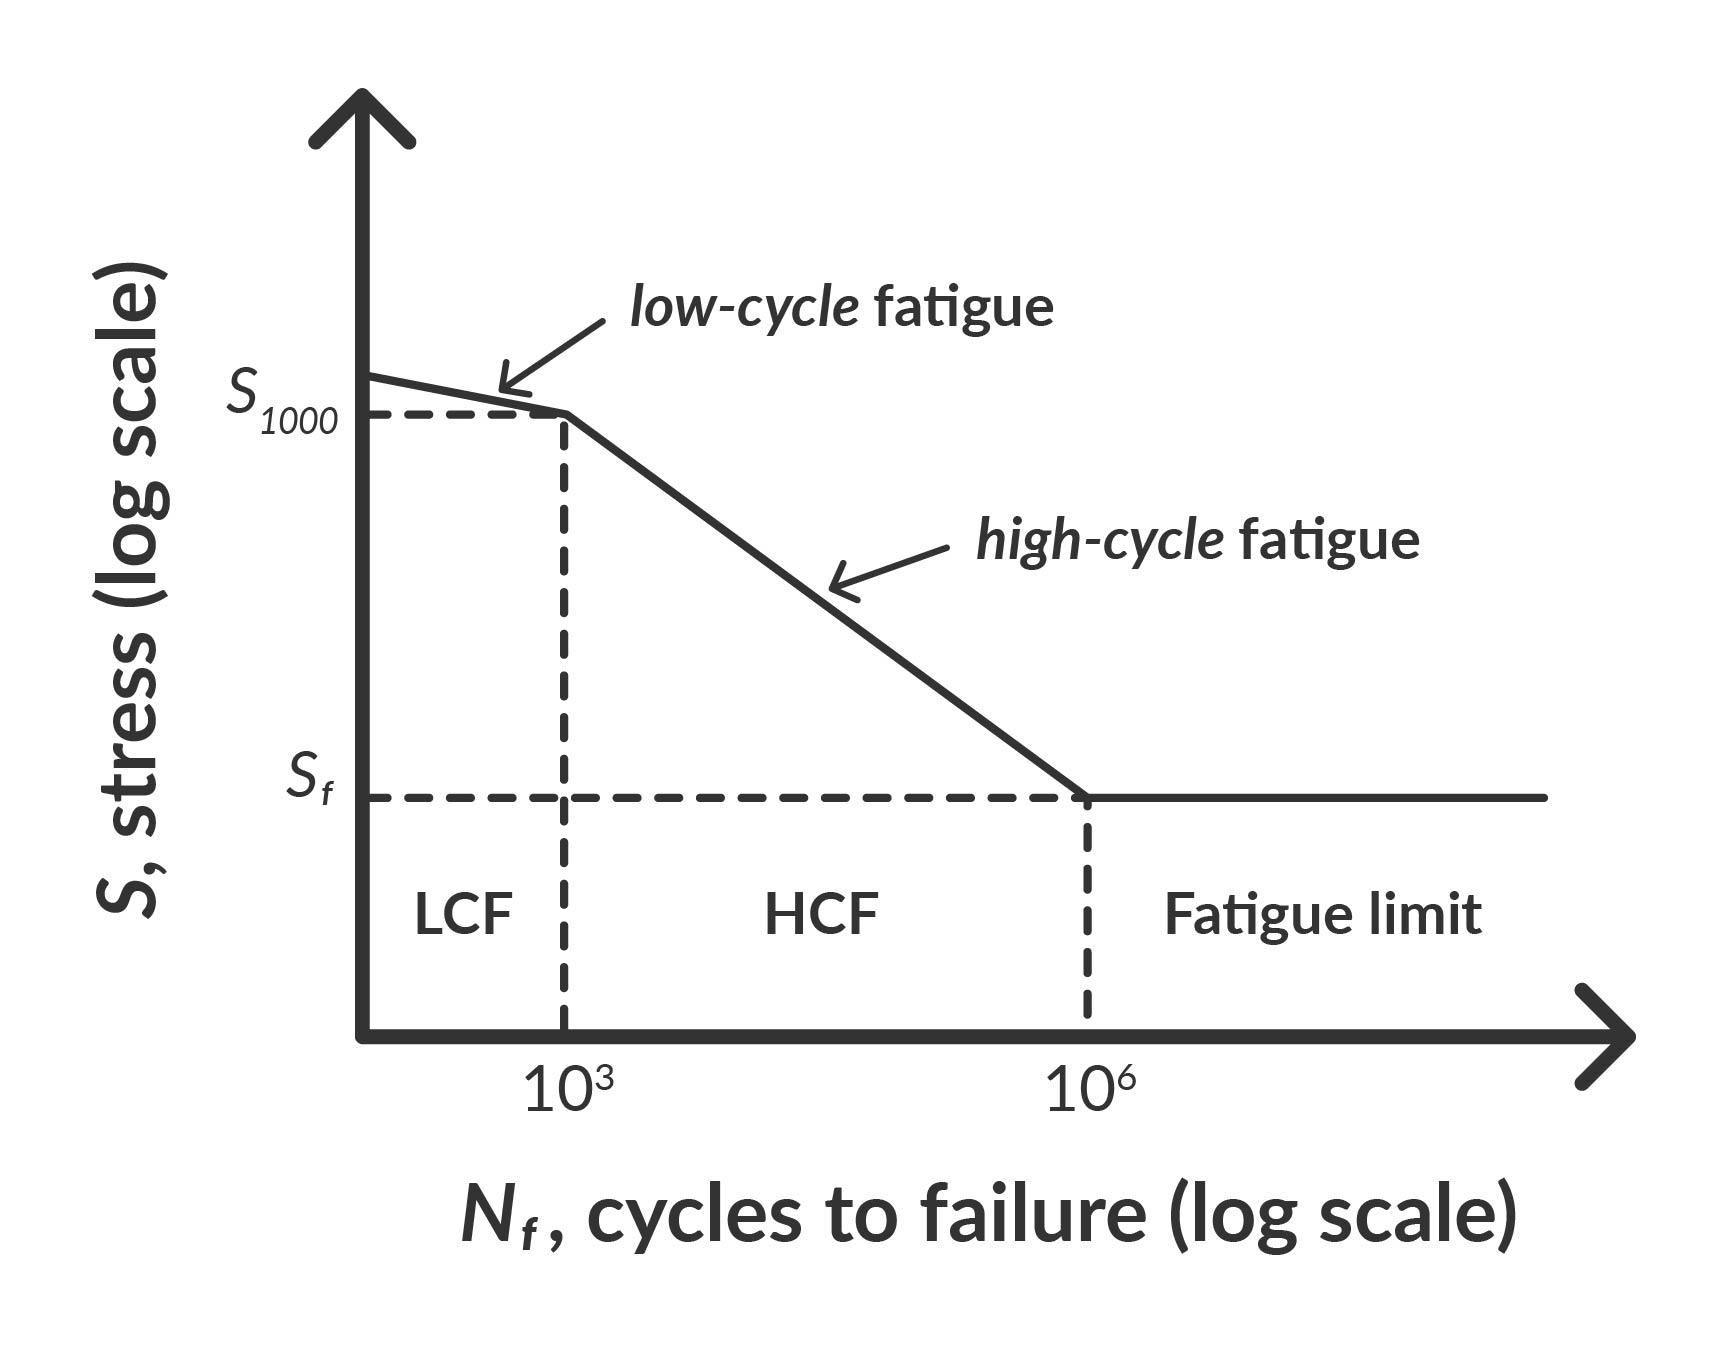
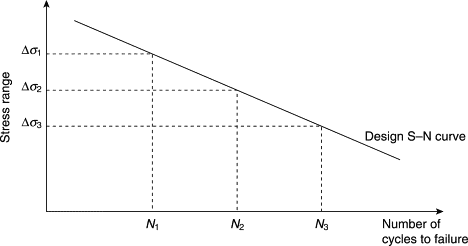
The Stress-Life Method
The stress-life method involves plotting the applied stress level against the number of cycles to failure. The stress-life method is used for high cycle fatigue when the expected stresses do not exceed the elastic limit of the material (yield point).
The-stress life method can, therefore, be supported with linear material model FEA simulations to predict the expected stresses.
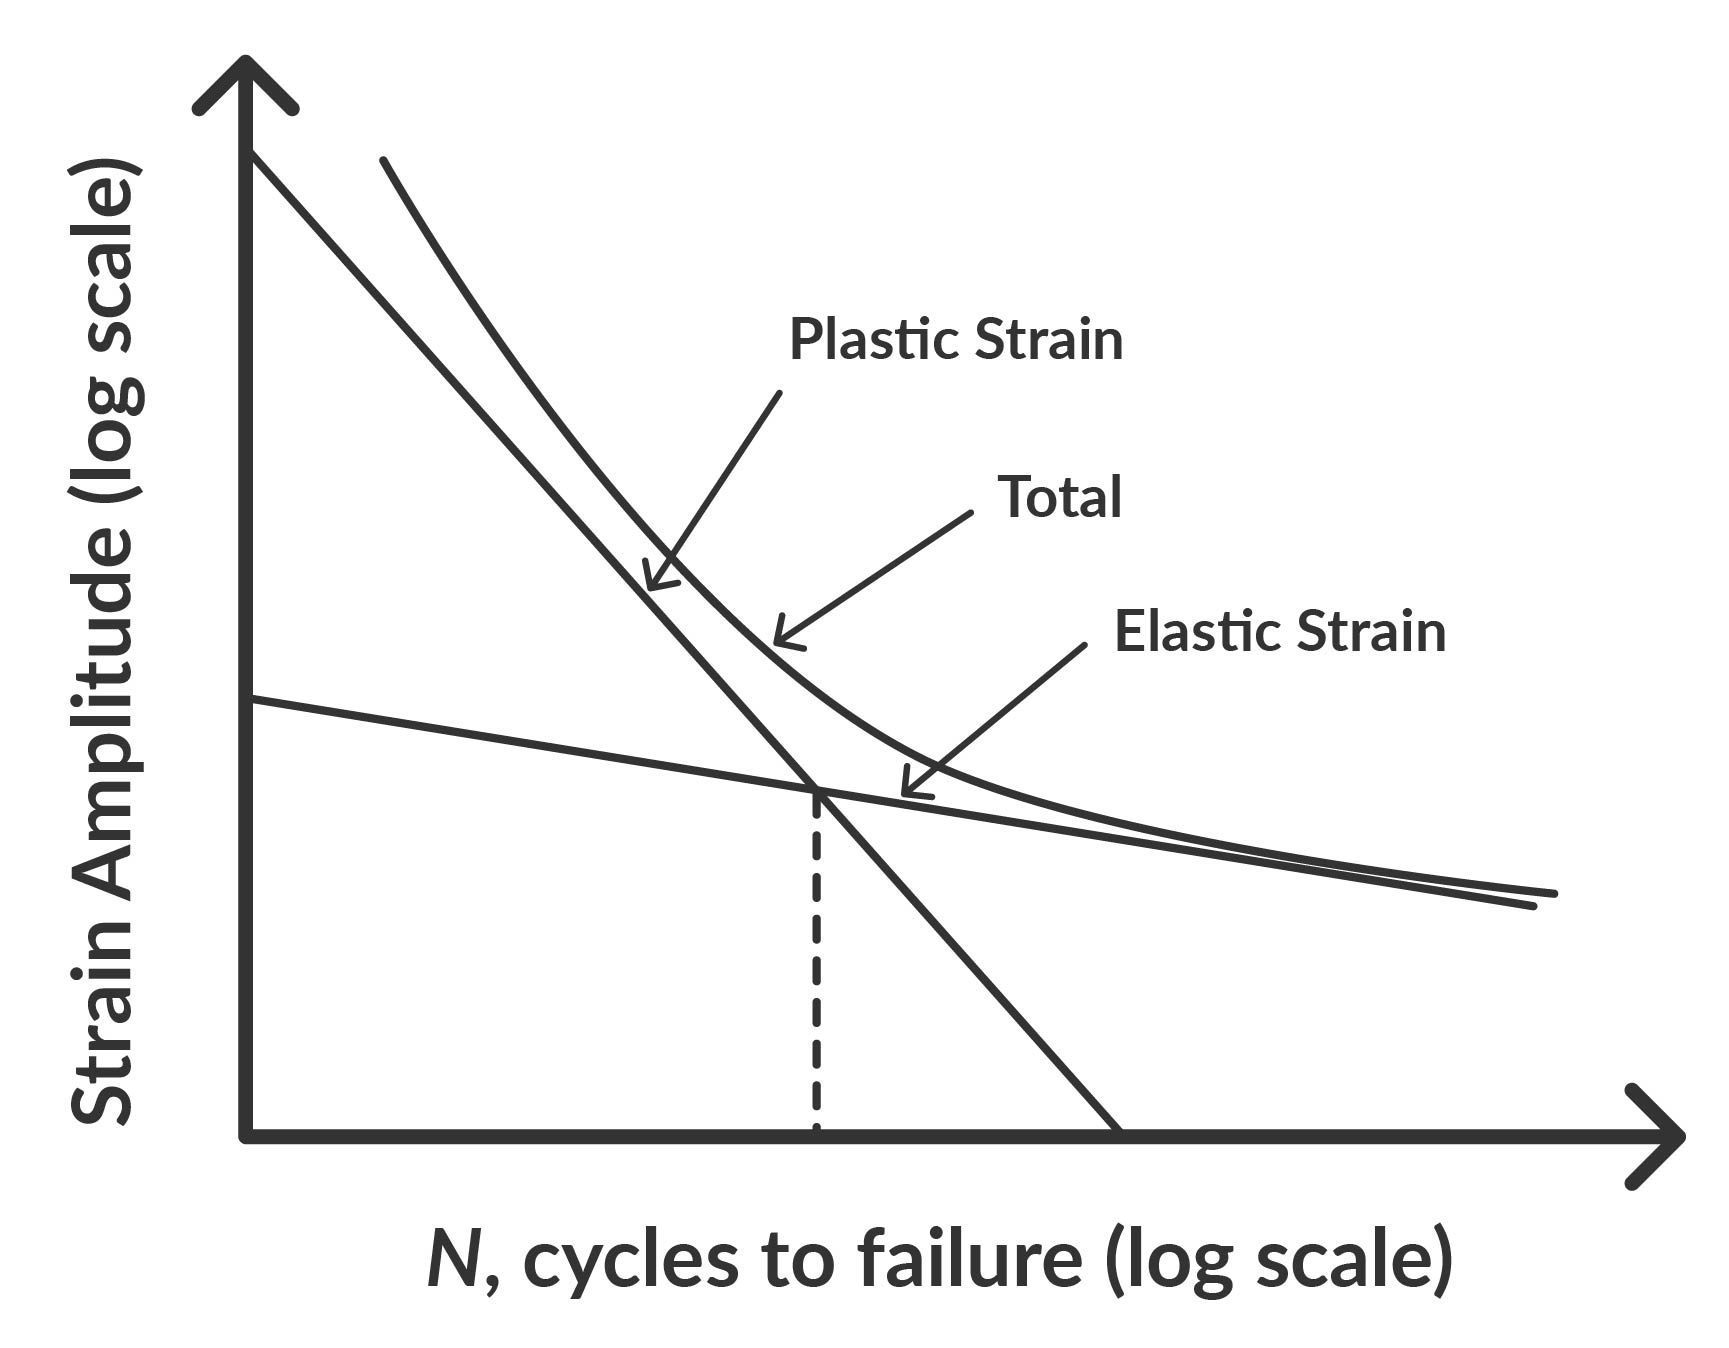
The Strain-Life Method
The strain-life method plots the strain amplitude against the number of cycles to failure. It is used for low cycle fatigue when some stresses exceed the elastic limit of the material (yield point).
The strain-life method, therefore, requires non-linear elastoplastic material model FEA simulations to predict the expected stresses.
Linear Elastic Fracture Mechanics (LEFM) Method
The LEFM method is used to predict the fatigue crack propagation length. It accurately calculates the fracture stress of brittle materials where the stress field at the crack notch is elastic. However, it does not take into account the plastic flow that happens in ductile materials at the notch. It would require further modification to account for the plastic zone fracture. This is referred to as Irwin’s theory of fracture, adapted from the Griffith criterion and said to be the basis of elastoplastic fracture mechanics.
Mean Stress Correction in Fatigue Analysis
Mean stress correction is another factor that affects fatigue analysis. It accounts for the effects of variable loading conditions on material fatigue. Mean stress correction factors are used to adjust the driving force or the S-N curve, which relates stress amplitude to the number of cycles to failure.
The accuracy of mean stress correction factors can significantly impact the fatigue life prediction of designs, so it is important to use reliable and accurate simulation and fatigue analysis software. In many cases, the S-N curve used for design assumes a worst-case scenario of fatigue life, eliminating the need to use a mean stress correction factor.
Fatigue Testing
Fatigue testing is an important part of fatigue analysis. It involves subjecting a material or structure to cyclic loading and measuring the resulting fatigue damage. Understanding the material and structural fatigue properties and behavior is essential for residual life assessment and fracture mechanics analysis.
In order to accurately predict the fatigue life of a component using any of these methods, you first need to predict the expected minimum stress, mean stress, maximum stress, stress amplitudes, stress ranges, and correlations. This is where simulation, specifically FEA structural simulation, can help.
Simulating the expected loading of the components with the correct material properties makes it possible to assume what the stresses for a fatigue analysis should be. You can take the von Mises equivalent stress or the principle stresses as inputs to the fatigue analysis.
Fatigue Analysis in SimScale
One of the main advantages of SimScale’s analysis software is its ability to quickly and easily simulate your designs while accurately capturing the details of your designs. This enables you to simulate realistic loading and boundary conditions and accurately predict the behavior of your products under loading. With SimScale, you can easily iterate and optimize your product designs to improve their durability, reliability, and overall performance without the need for specialist hardware or expensive software.
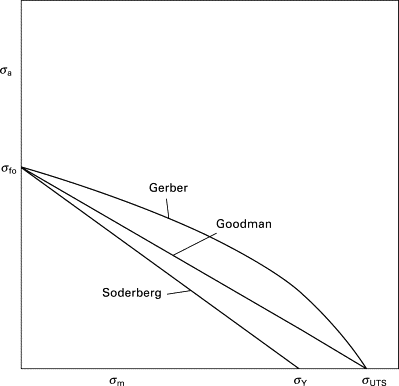
From mean stress values obtained by simulation, it is possible to use relationships such as the Gerber, Goodman, and Soderberg that relate mean stress amplitudes to fatigue life, also known as constant life diagrams. The figure below provides an example of the constant life diagrams.
In conclusion, fatigue analysis and simulation are critical steps in product design and engineering that can help you understand and predict material and structural failure due to cyclic loading. By using methods such as the stress-life and strain-life methods and accounting for factors such as mean stress correction, endurance limit, fatigue crack propagation, and probabilistic fatigue analysis, you can ensure the durability and reliability of your products. Contact SimScale today to learn more about how it can help you optimize your product designs.
References
- Aerospace Testing International
- Altair OptiStruct
- Linear Elastic Fracture Mechanics: Part Two, TotalMateria
- Philippa Moore, Geoff Booth, in The Welding Engineer’s Guide to Fracture and Fatigue, 2015
- Determination of mechanical properties, J.W. Martin, in Materials for Engineering (Third Edition), 2006
Last updated: June 22nd, 2023
Did this article solve your issue?
How can we do better?
We appreciate and value your feedback.
What's Next
What is Bending Stress?

