Documentation
When studying pedestrian wind comfort, the typical approach is to use the mean wind velocity for the comfort calculations. When reporting a wind comfort study, some authorities may require to take the Gust Equivalent Mean (GEM) into account.
Wind gusts often represent additional discomfort to the pedestrians when compared to the mean wind velocity. In this sense, the gust equivalent mean formulation is a way to account for sudden wind accelerations, which are common in external aerodynamics. For this reason, considering the GEM for pedestrian comfort studies is valuable.
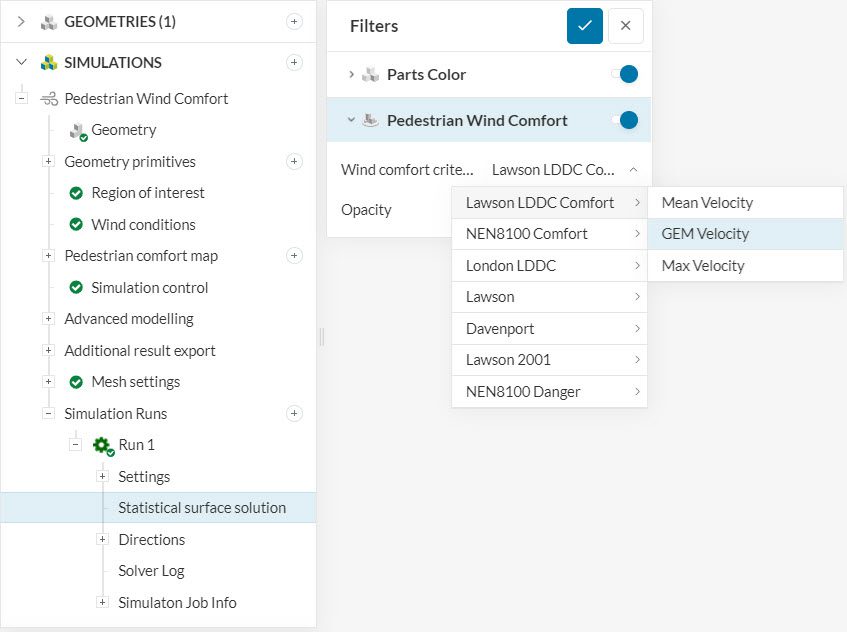
As far as simulation setup goes, there are no additional steps required to obtain wind comfort results based on GEM. The data is available for all new Pacefish®\(^1\) Pedestrian Wind Comfort (PWC) simulations by default. The image below shows the available options in the post-processing environment:
Find below more details on the gust equivalent mean implementation in the SimScale platform.
Before calculating the gust equivalent mean speed \(U_{GEM}\), first it’s necessary to understand the concept of gust speed \(U_{gust}\). In the literature\(^2\), the gust speed is taken as the highest sustained gust over a 3-second period.
To evaluate the gust speed in a certain region of the domain, it is common practice to apply statistical methods. SimScale uses the following formulation:
$$ U_{gust} = U_{mean}+k_{g}\sigma \tag{1} $$
Where \(U_{mean}\) is the mean velocity, \(k_{g}\) is the gust factor and is equal to 3.5 \(^3\), and \(\sigma\) is the standard deviation of velocity.
Since PWC simulations use the DDES turbulence model, the turbulence has two components, resolved and modeled. The total standard deviation \(\sigma\) takes into account:
Thus, the total standard deviation is given by
$$ \sigma = \sqrt{(\sigma_{DDES})^2 + (\sigma_k)^2} = \sqrt{(\sigma_{DDES})^2 + \frac{2k}{3}} \tag {2} $$
At last, equation 3 below correlates \(U_{GEM}\) and \(U_{gust}\):
$$ U_{GEM} = \frac{U_{gust}}{1.85} \tag {3} $$
When calculating the Max Velocity, SimScale adopts a conservative approach that differs from simply averaging the Mean and GEM scenarios across all directions and then selecting the worst result. Instead, it assesses each direction independently, selects the worst value for that specific direction from the two scenarios, and then combines these worst-case values. This method effectively blends the most severe results from both scenarios, yielding a more conservative overall result. While, $$ U_{\text{max}} = \max(U_{\text{mean}}, U_{\text{GEM}}\tag {4}) $$
is true at the velocity level, this relationship does not carry over to the probabilities: $$ PWC(U_{\text{Max}}) \neq \max(PWC(U_{\text{mean}}), PWC(U_{\text{GEM}})\tag {5}) $$
The reason is that PWC is a weighted statistical average over all wind directions. When computing \(PWC({U_{\text{max}}})\), the code first takes the per-direction maximums and then averages them. This blends the worst outcomes from different directions, creating a stricter, more conservative “worst-case envelope” than simply comparing the two overall averages.
In contrast, if the ‘not equal’ symbol is intended to be an ‘equal’ symbol, Equation 5 would only compare the two final averages, thereby overlooking the potential worst direction unique to each. While we do not have this final comparison readily available as a post-processable variable, if that is the result you want to see, it can be calculated using ParaView.
Based on Figure 1, the comfort criteria results are available in SimScale under three categories:
Find below a comparison between the comfort criteria on the rooftop of two buildings using different velocity configurations:
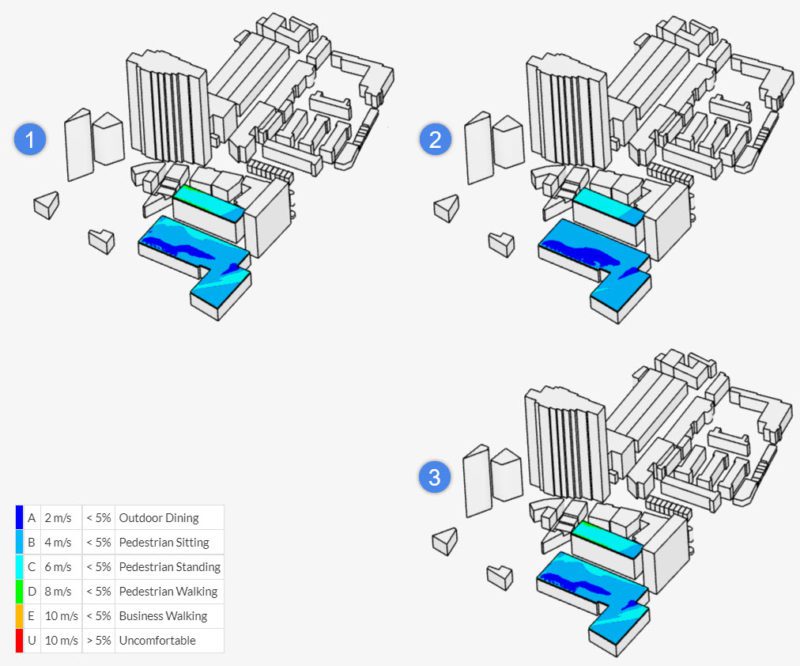
In the case above, the mean velocities are larger than the GEM on the rooftops, leading to configuration 1 showing less comfort than configuration 2. Naturally, the max velocity configuration shows the worst scenario.
References
Last updated: November 27th, 2025
We appreciate and value your feedback.
Sign up for SimScale
and start simulating now