In most of the CFD and FEA simulations, it is possible to identify improvement areas just by using a qualitative approach, however sometimes, it is important to post-process the simulation results using a more quantitative way.
In SimScale, before running the simulation it is possible to set up result control plots to check the simulation convergence, for example, we can work with an area average, forces and moments plots, and probe points with the Incompressible model. And if more information is required along a line through the geometry, you can use a third-party post-processing platform, such as ParaView to plot over line simulation results.
Using ParaView to Create a Plot Over Line
Before starting this tutorial, please make sure that you have uploaded the simulation results from SimScale to Paraview.
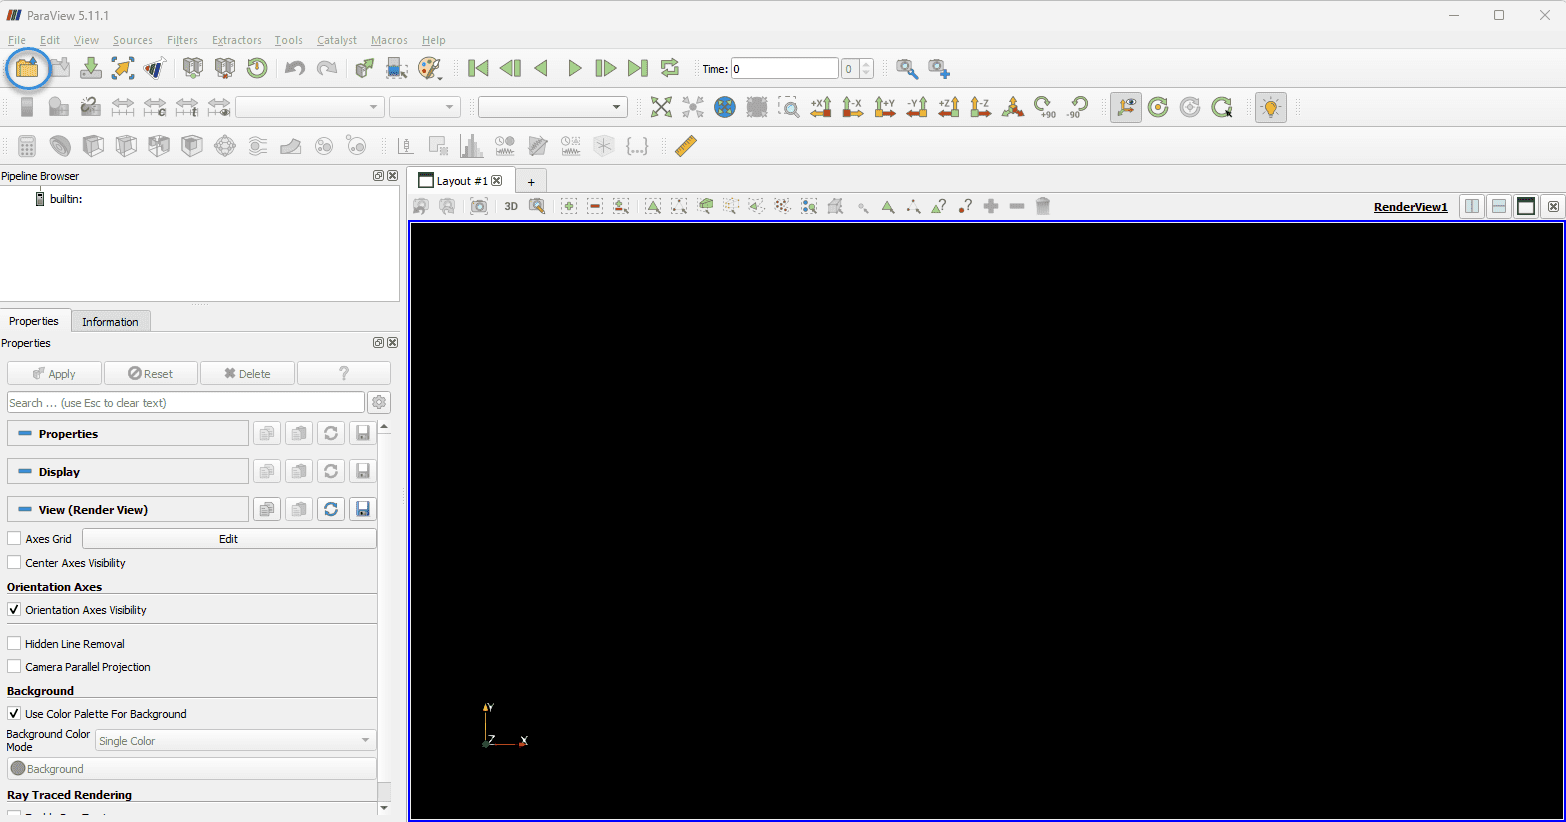
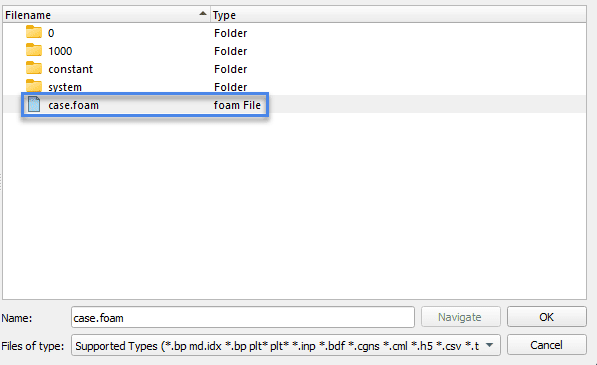
After downloading the simulation results, you can start ParaView and open the results by going to the Open option or File > Open and selecting the folder with the results and opening the file with the format .foam.
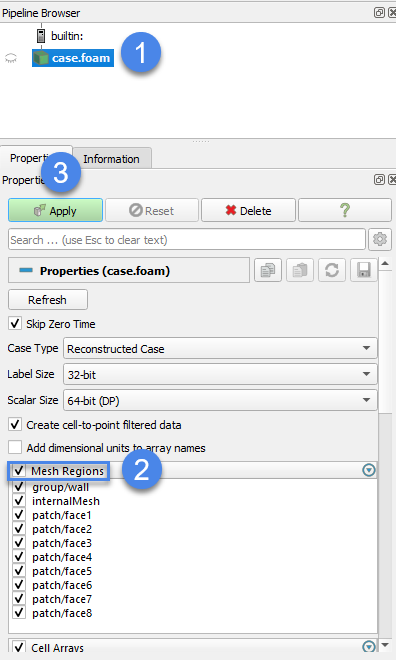
ParaView will open a new ribbon where you can select the faces and properties. You can keep the default settings, just click to select all the Mesh Regions and hit ‘Apply’.
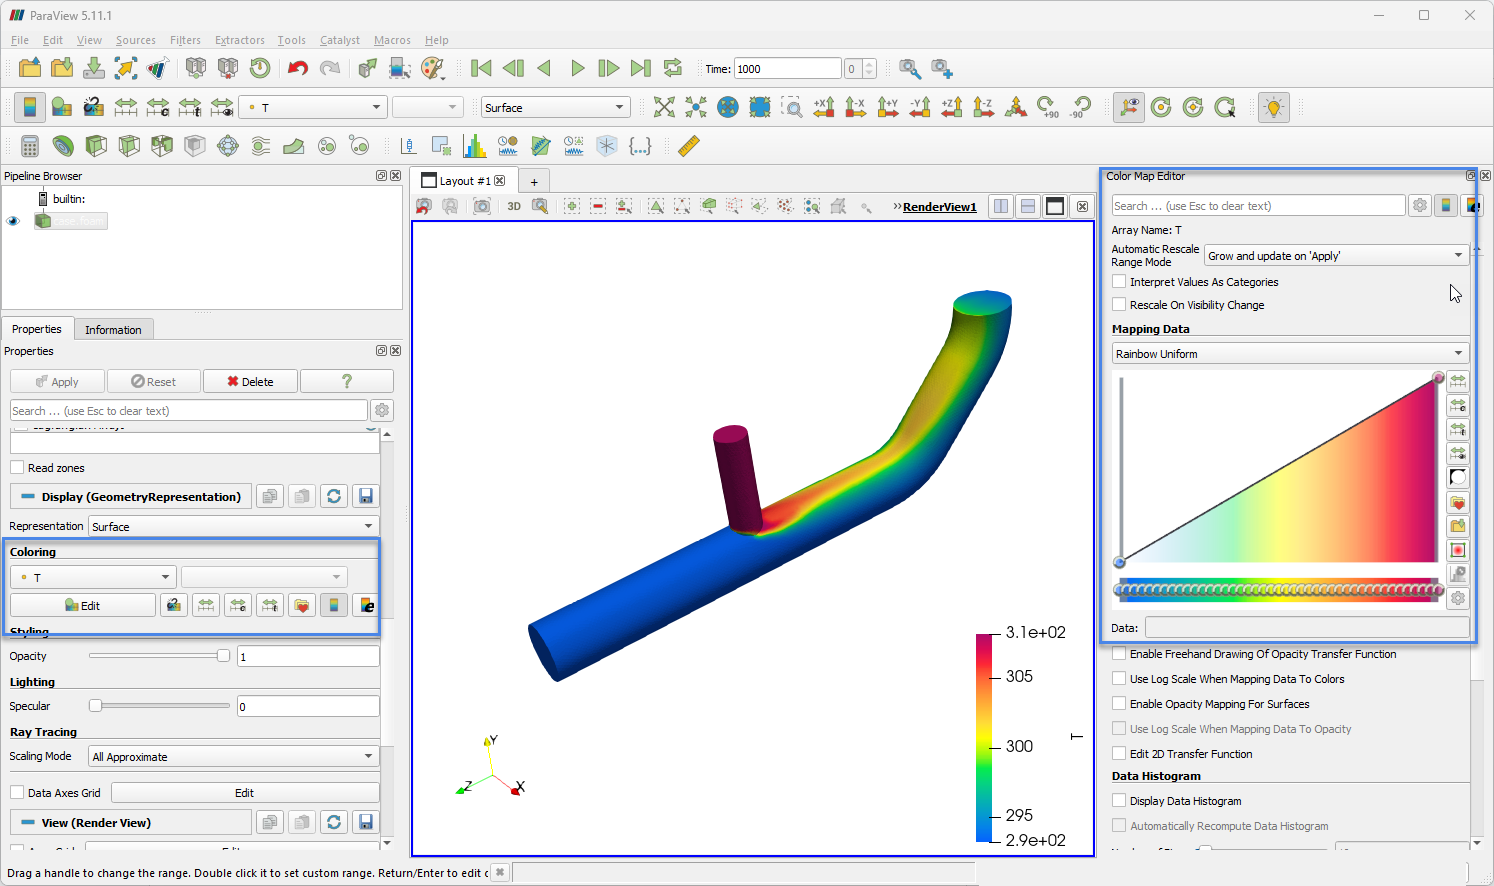
Now you should be able to see the domain inside the Pipeline Browser, where you can hide or show it. You have access to the Properties of this domain and with the Coloring option you can use the variables as contours, for example, you can use this option to see the pressure contours, temperature, velocity, etc. Using the Color Map Editor, you can change the legend and work with different presets to analyze the results.
Creating a Plot
The first step to create a plot consists of selecting the domain, for this case, we are using the default name called “Case.foam”. Next, select the ‘Plot Over Line’ option from the top ribbon.

Now, ParaView will open an arrow to help you with positioning the line and it is possible to move the arrow and select the line just by moving it. Still, if you want to be more accurate, you can use the Line Parameters feature to input the line coordinates and the line will respect the values you have set.
Units
ParaView works with the units of your simulation results, so the units will be the same as the ones you were using to run the simulation.

For this particular case, a line along one of the inlet zones is plotted. Click ‘Apply’ to generate the plot.

ParaView will generate the plot of the results along the plotted line. All variables will be plotted, but you can use the Series Parameters feature to filter out unwanted variables within the plot.
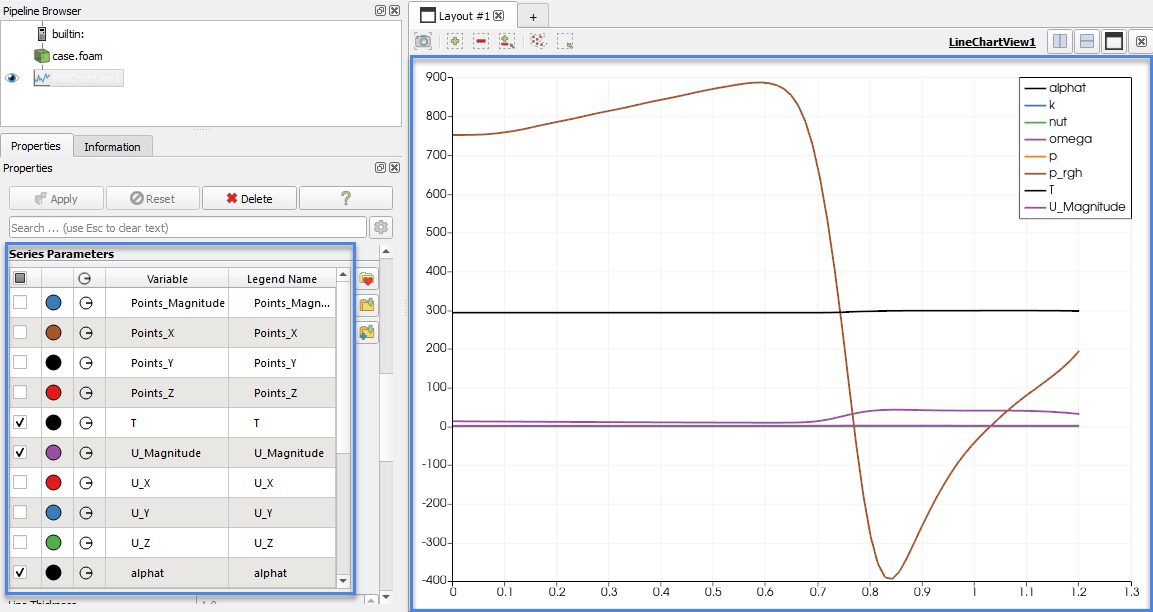
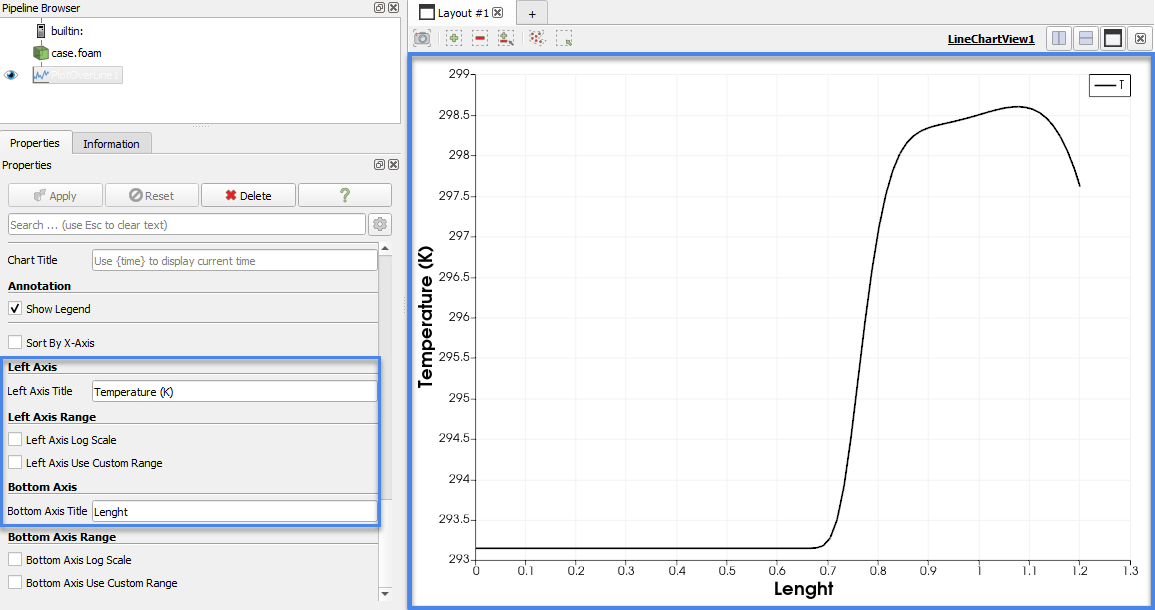
For example, if you want to check the temperature behavior, you can select the Temperature variable and use the Title option to change the axis names.
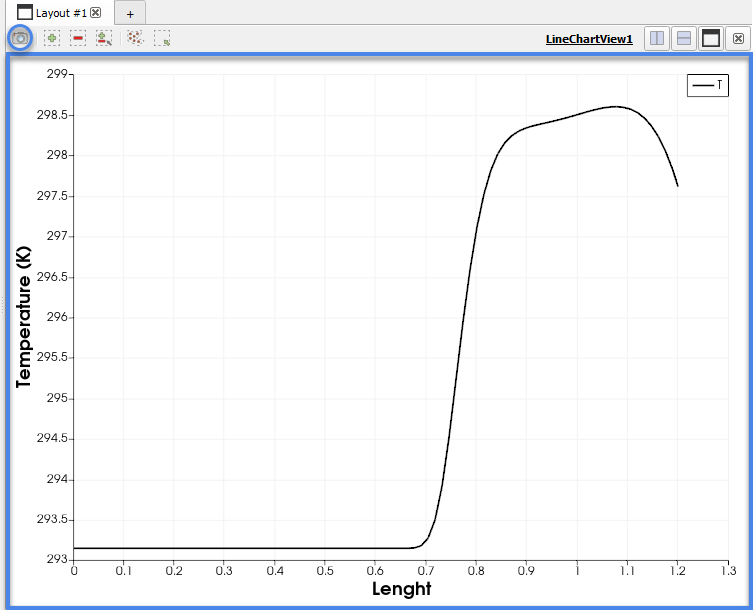
If you want to create a figure, it is possible to save a print with the Cam feature.
Spreadsheet view
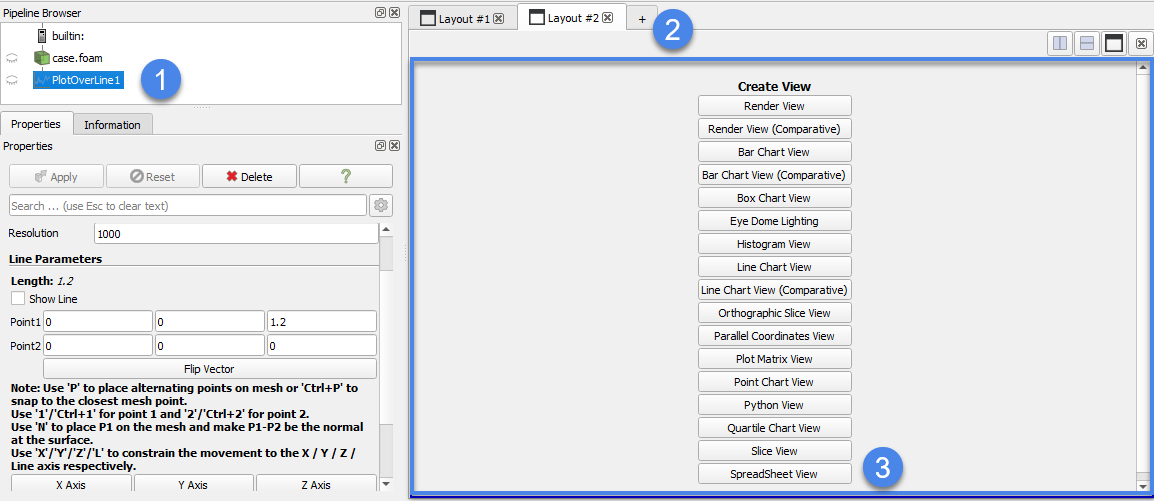
It is also possible to see the results using a spreadsheet view which is very useful to see the quantitative results generated along the line. To use this function you can go to the Pipeline browser, and click on ‘PlotOverLine’ to create a new layout, so the interface will open a new window where you can select the option SpreadSheet View.

You can also export the data to post-process it using a different tool using the Export Spreadsheet tool shown above.


