This article explains the steps required to visualize the mesh in PWC analysis (Pedestrian Wind Comfort).

Solution
To be able to visualize the mesh in PWC analysis, it is necessary to select an individual wind direction result.
Please visit the documentation page to learn more about the PWC analysis type. Additionally, this page explains the mesh settings in PWC analysis in more detail.
Note
Additional refinements are added in the leeward side of the buildings to accurately resolve the wake region. This refinement is adapted for each wind direction individually according to the wind direction. Consequently, you will see an individual mesh result for each wind direction.
Best Practices
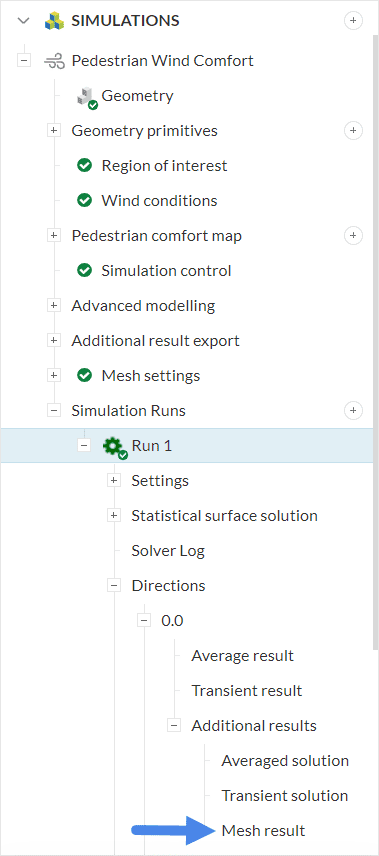
1. Select the Mesh Result for a Wind Direction
To see the mesh on the fluid domain for a given wind direction, first navigate to Mesh results, as seen in Figure 2:
This will open the post-processing environment, where we can create filters. Cutting planes are very useful since it’s possible to plot the mesh elements on them.
2. View the Mesh Resolution on Cutting Planes
Once the post-processor opens, first ensure that the fluid volume and the Floor parts are not visible. This will make the mesh visualization easier and cleaner.

The best way to inspect the mesh is by creating cutting planes, and plotting the mesh elements on them. To do so, please follow the steps below:
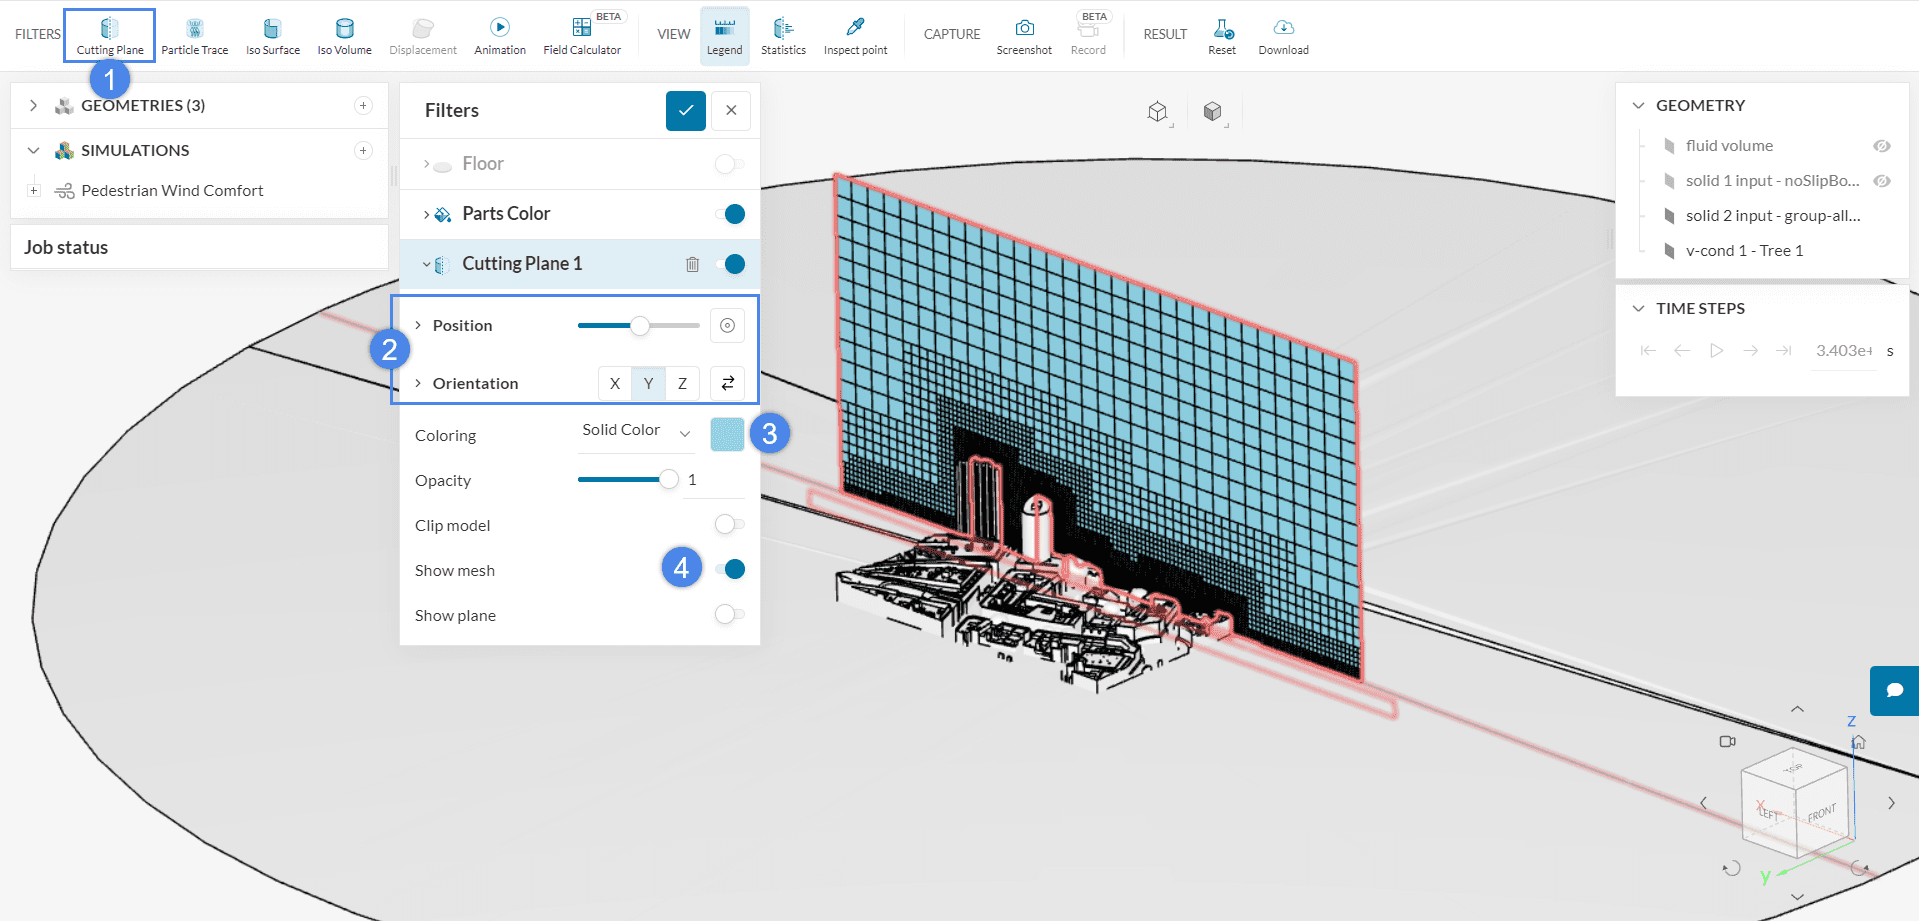
- Using the filters ribbon, create a ‘Cutting Plane’ filter
- Adjust the Position and the Orientation of the cutting plane as desired
- For the Coloring of the mesh cells, you can use a Solid Color or the Cell Size
- Finally, enable the ‘Show mesh’ option. This will make the mesh visible on the cutting plane
You can easily create a horizontal mesh clip too if desired. Simply duplicate the first cutting plane and change its Position and Orientation:

With these simple steps, we can further evaluate meshes from PWC simulations. Please note that the mesh visualization is available for each direction of a PWC simulation.
Did you know?
The sizing for the background mesh for the PWC analysis is highly automated. Often, the user does not need to do any mesh sizing other than adjusting the fineness from Moderate to Fine. Mesh sizing targets the specific use case, thus it works best for model sizes of 1 – 10 \(km^2\) and a region of interest radius of 200 \(m\) – 500 \(m\).
Note
If none of the above suggestions solved your problem, then please post the issue on our forum or contact us.


