In this article, we will explain how to utilize pressure data from CFD (fluid) simulations to conduct Finite element (structural) analyses — One-Way FSI.
Approach
When a component is immersed in a fluid—such as air, gas, or water—the pressure differentials generated by the fluid flow induce mechanical responses in the component. This interaction, known as Fluid-Structure Interaction (FSI), can be modeled using two primary approaches:
- One-Way FSI: This approach assumes that while the fluid flow exerts stresses on the component, the resulting deformations are minimal and do not significantly alter the fluid flow. It’s appropriate when structural deformations are negligible, allowing the feedback from the structure to the fluid to be disregarded.
- Two-Way FSI: This method involves a fully coupled analysis where the fluid flow affects the structure, causing deformations that, in turn, influence the fluid flow. Such an approach is essential for scenarios involving large deformations, such as simulations of highly flexible components.
With SimScale, One-Way FSI can be achieved with the help of a third-party post-processing tool.
Post-Processing via 3rd-Party Solution
You can post-process results using a third-party tool by following the steps outlined on this documentation page.
Example – Hydrofoil Study
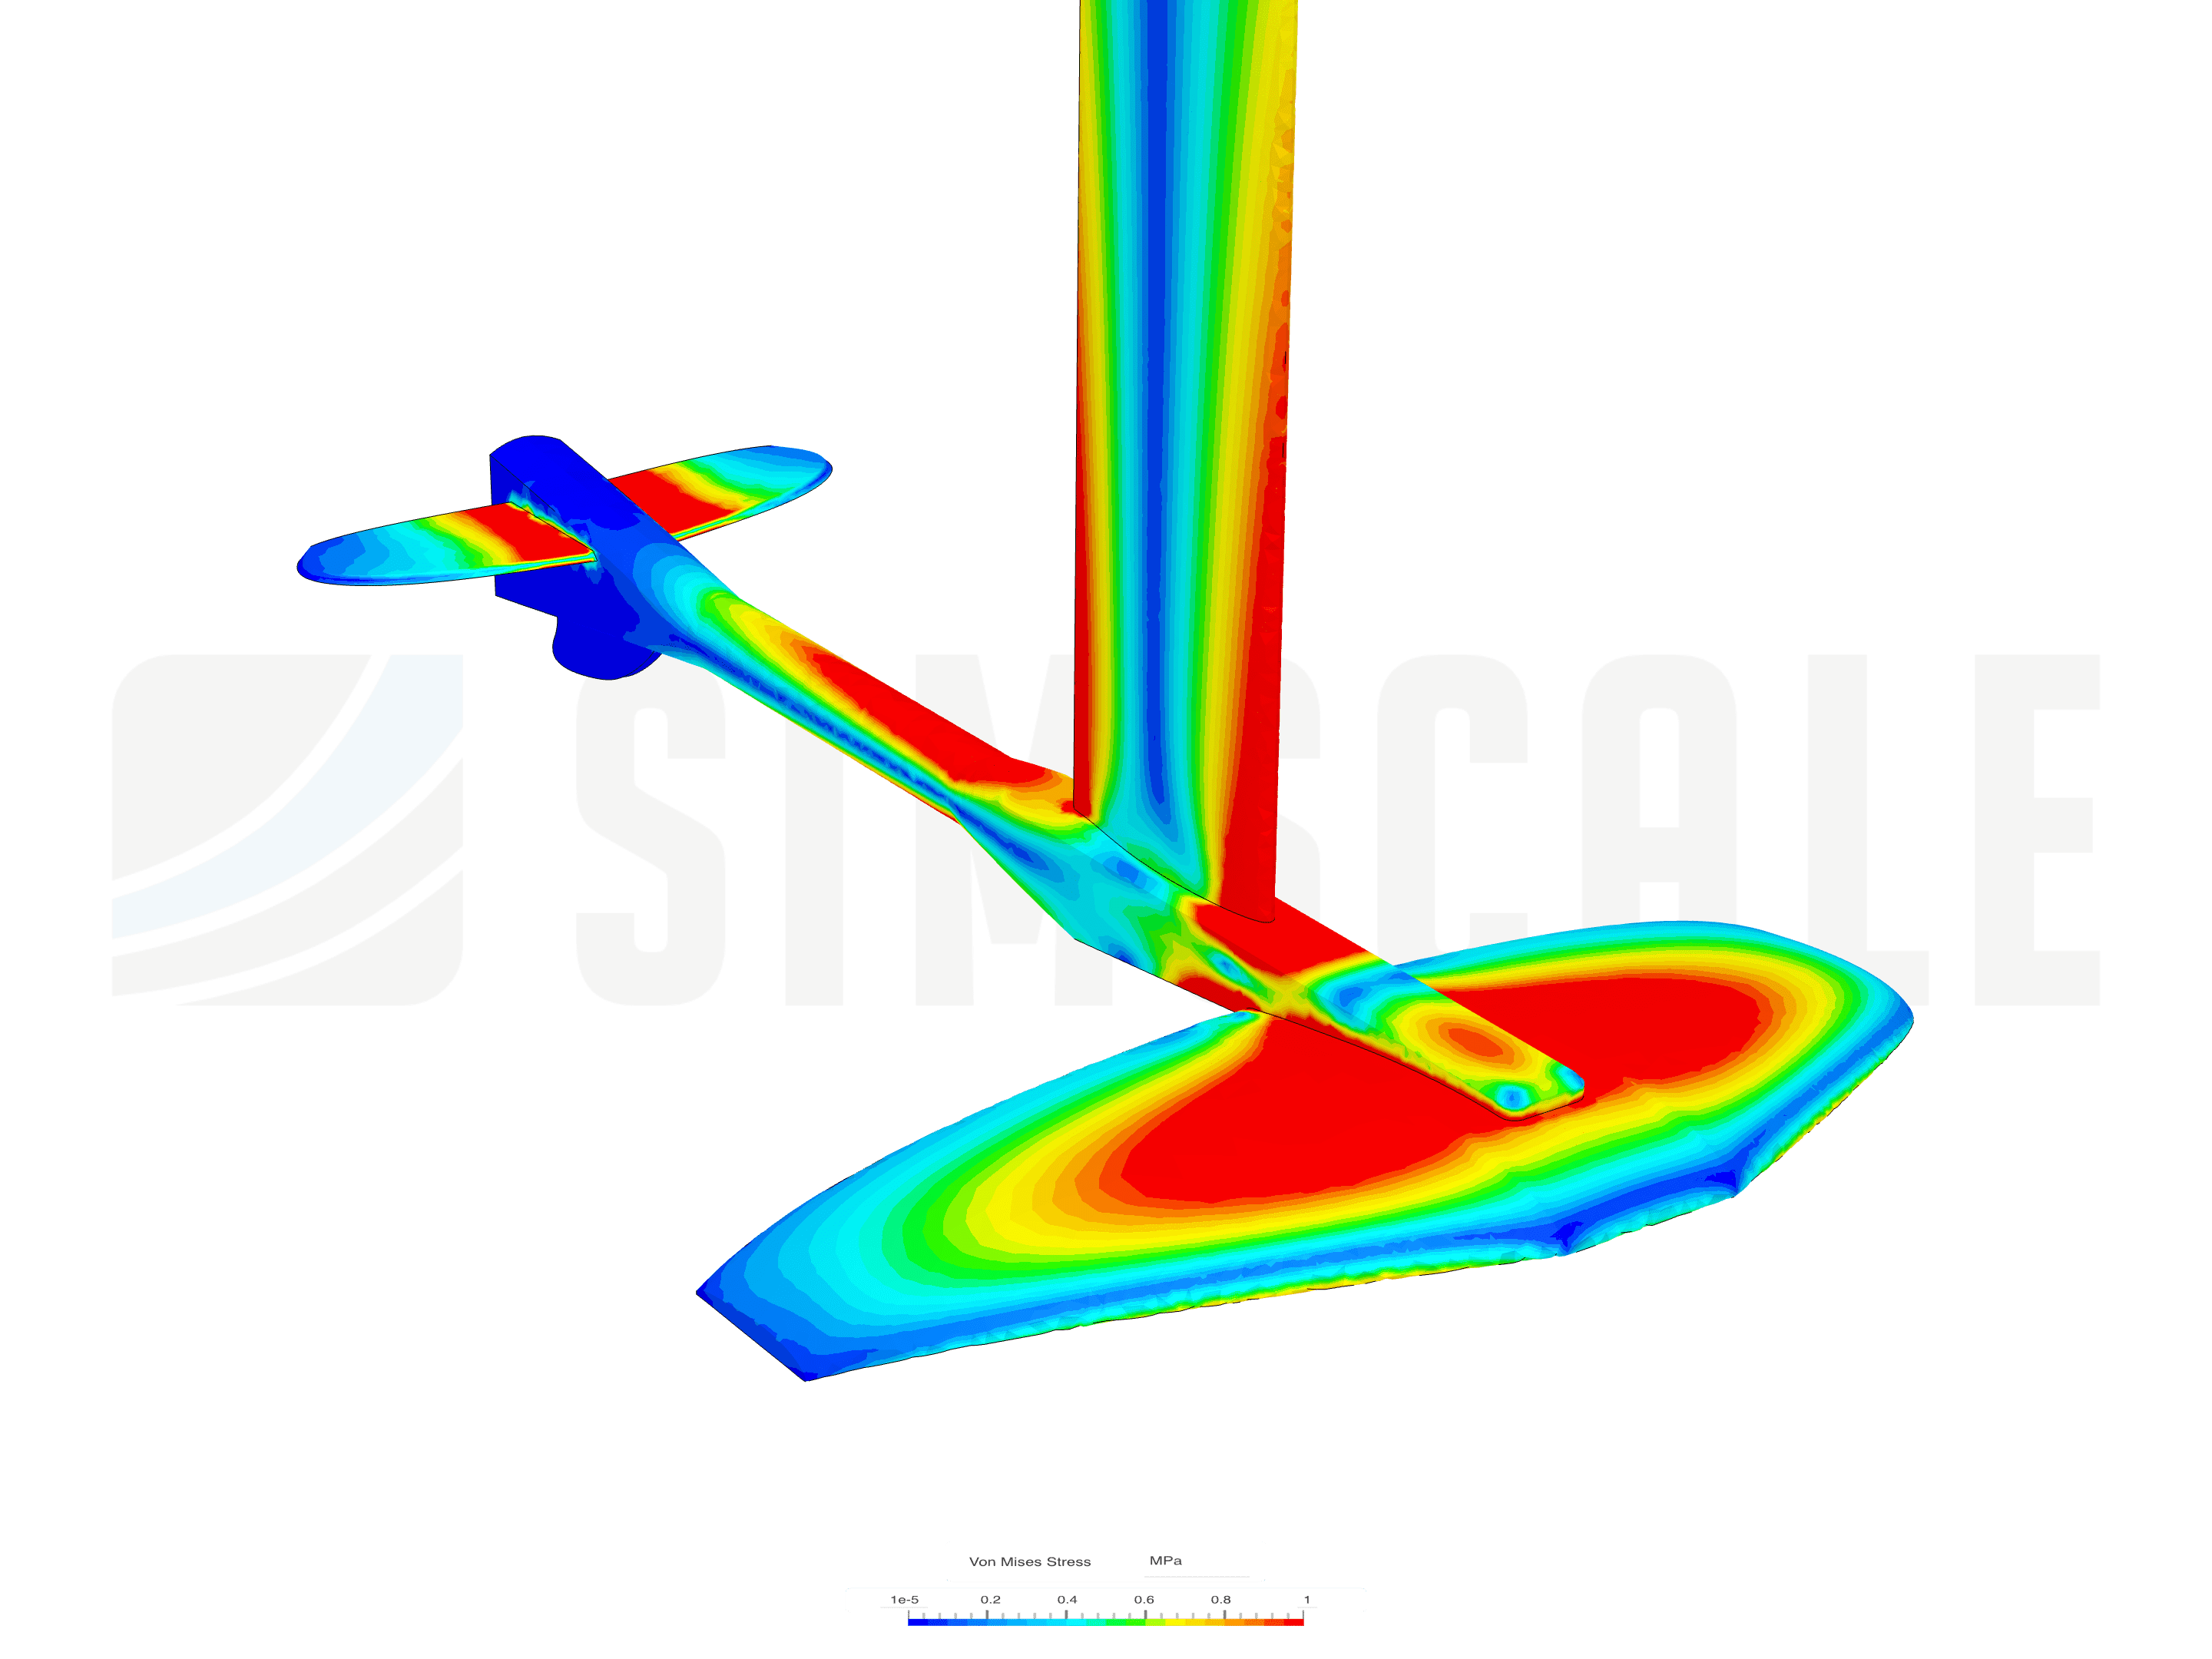
To guide the process of conducting a One-Way FSI study, we will use a hydrofoil model as an example. The first step involves performing an Incompressible fluid simulation to obtain pressure data on the hydrofoil’s surfaces. This pressure data is then applied to a Static structural analysis by incorporating it into a pressure table, enabling the evaluation of the hydrofoil’s mechanical response to the fluid forces. The hydrofoil study can be accessed here:
Finally, ParaView will be used as the external post-processing tool to retrieve and manage the pressure data effectively.
1. Performing an Initial Fluid Flow Analysis
The initial step in conducting an FSI study involves running an Incompressible fluid flow analysis. For the hydrofoil case, which is an external aerodynamics application, the process includes the following key tasks:
- Create an external flow volume to define the simulation domain.
- Set inlet and outlet boundary conditions to establish the flow behavior.
- Assign boundary conditions to the side and top faces, treating the side faces as slip walls and applying symmetry to the top face.
- Refine the mesh in regions of interest to achieve higher resolution and more accurate results.
- Run the analysis to simulate the fluid flow around the hydrofoil.
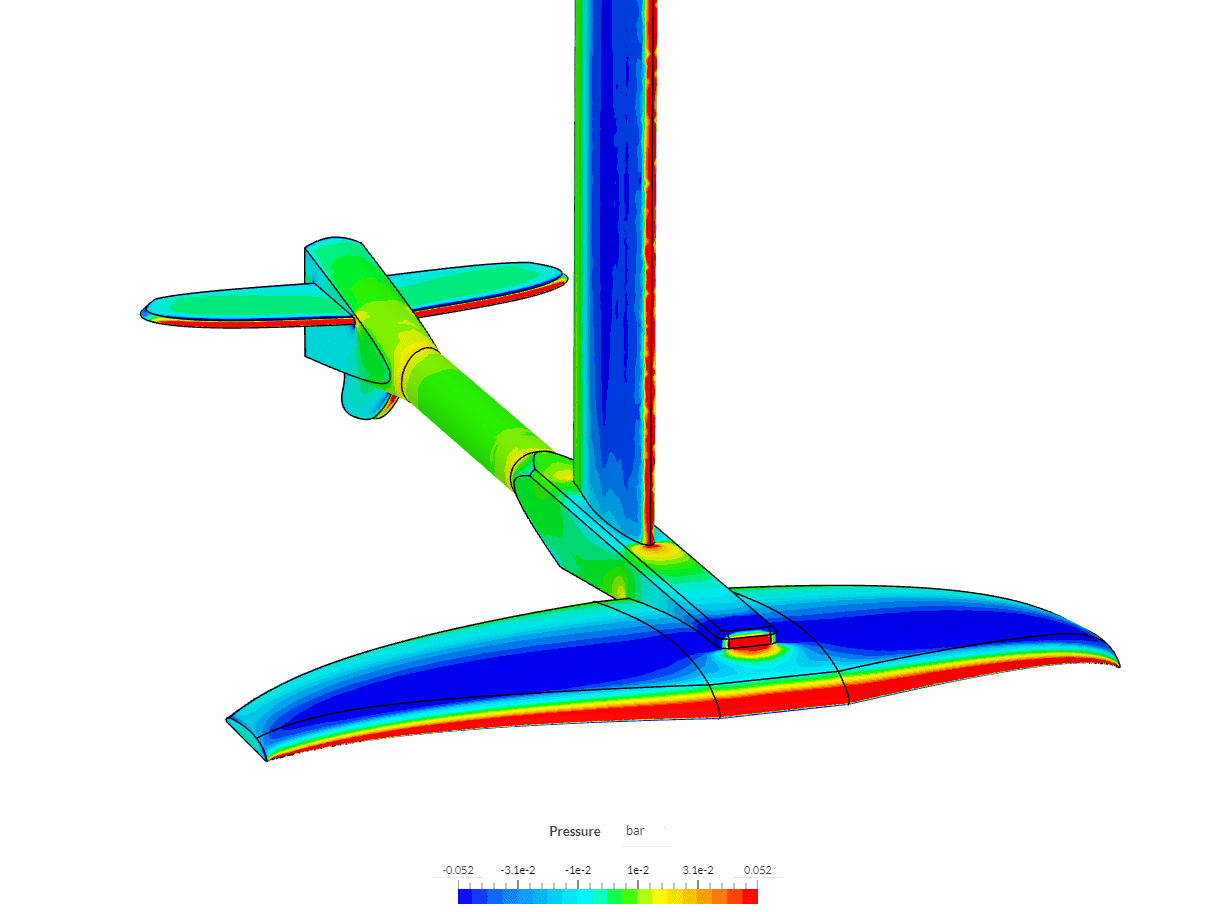
Once the simulation run is complete, we can examine the pressure distribution on the hydrofoil by hiding the outer faces of the flow domain, allowing a clear view of the hydrofoil’s surface.
2. Extracting Pressure Data from Faces Using ParaView
The next step in our analysis involves exporting the simulation results and opening them in ParaView. We’ll divide this section into two approaches: a simple one which works for external aerodynamics cases such as this one and a general approach.
2.1 External Aerodynamics Approach
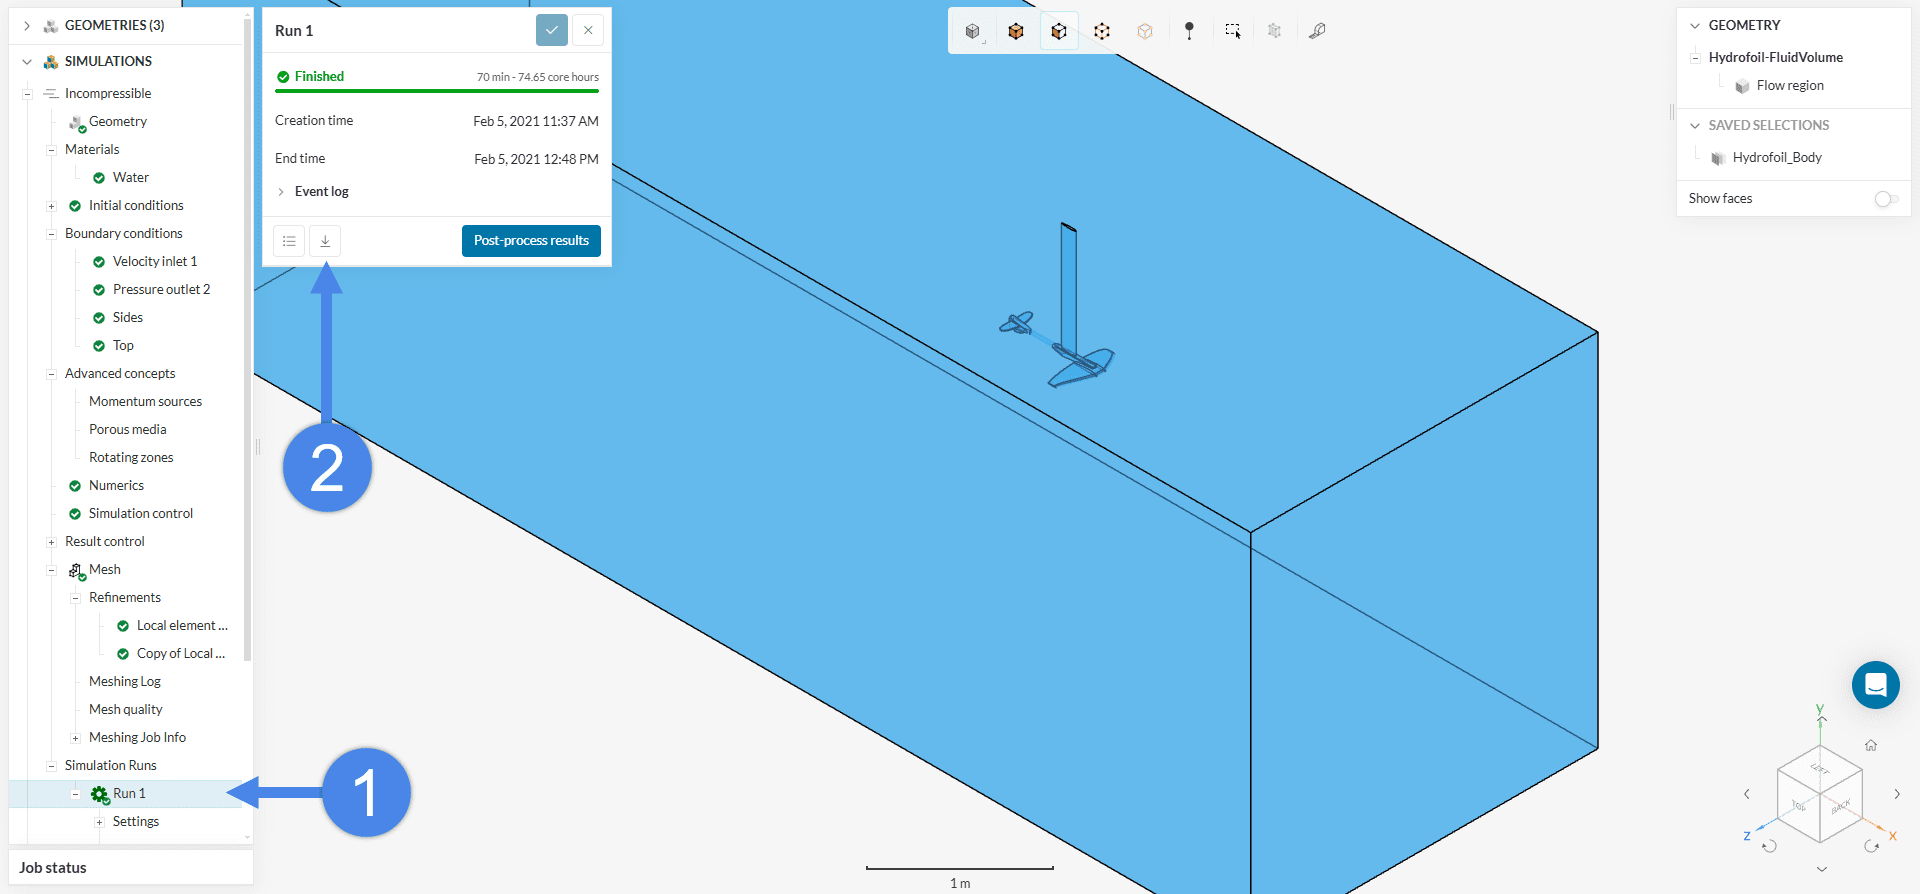
To start, click on the completed simulation run, then select the download button to retrieve the results.
After the download is complete, open the case.foam file in ParaView and follow these steps:
- Click on ‘Filters’ → ‘Alphabetical’ → ‘Extract Surface’ (this will leave only the outer surfaces of the results and exclude the inner solid region)
- Create a Clip filter, selecting ‘Box’ as the Clip Type, and position the box so it fully excludes the outer surfaces of the flow region
- Go to File → Save Data, then set the format as
.csvand click ‘OK’. On the Configure CSV window, click on ‘Choose Arrays To Write’ and only select ‘p’ (pressure) and click ‘OK’.
Here’s a brief video walkthrough of the process:
Be aware
As highlighted in the first seconds of Animation 1, you need to set the “Time” tab on ParaView to the last step in your simulation run!
2.2 General approach
If the previously suggested approach does not suit your specific case — for example, if you need to extract pressure data from a particular face in your model — you can follow this alternative, more general workflow:
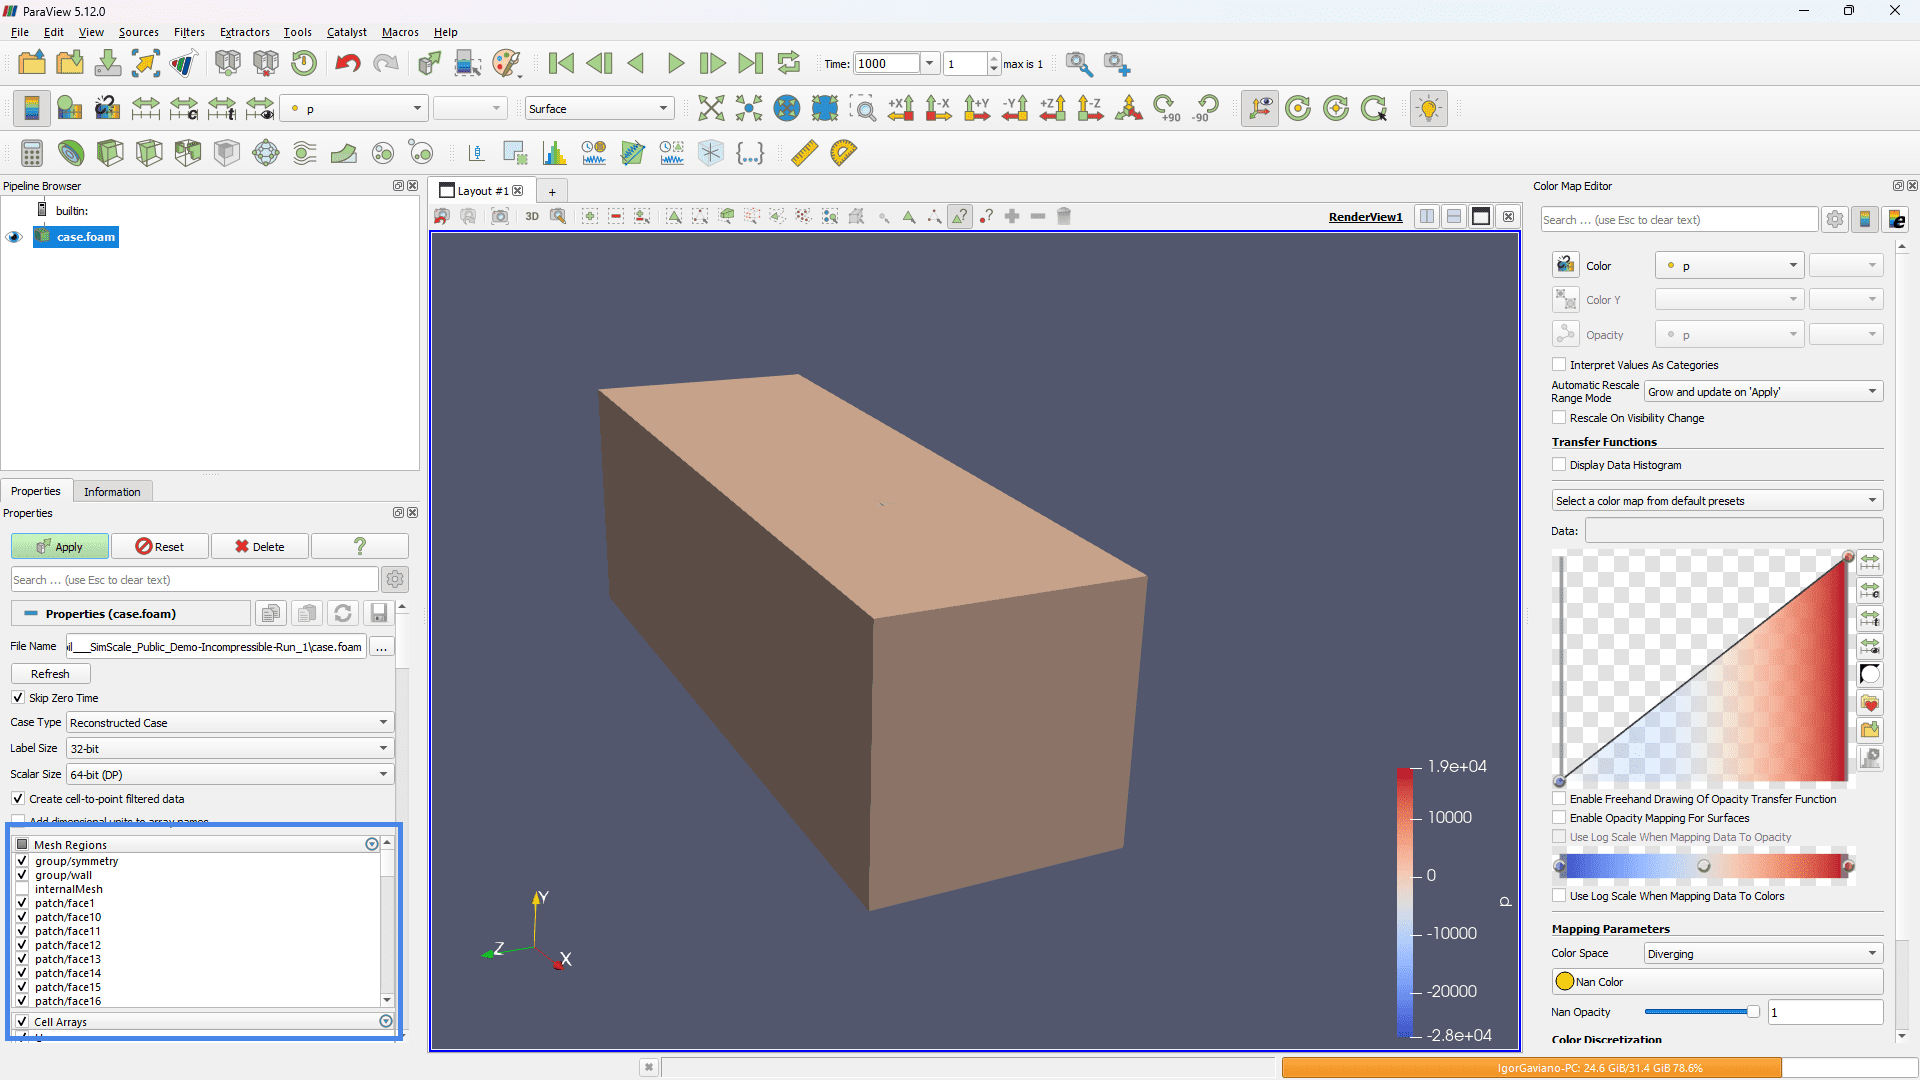
- Open the
case.foamfile in ParaView. - Under the Mesh Regions section, uncheck the ‘internalMesh’ box and select all the other boxes corresponding to the faces and select ‘Apply’.
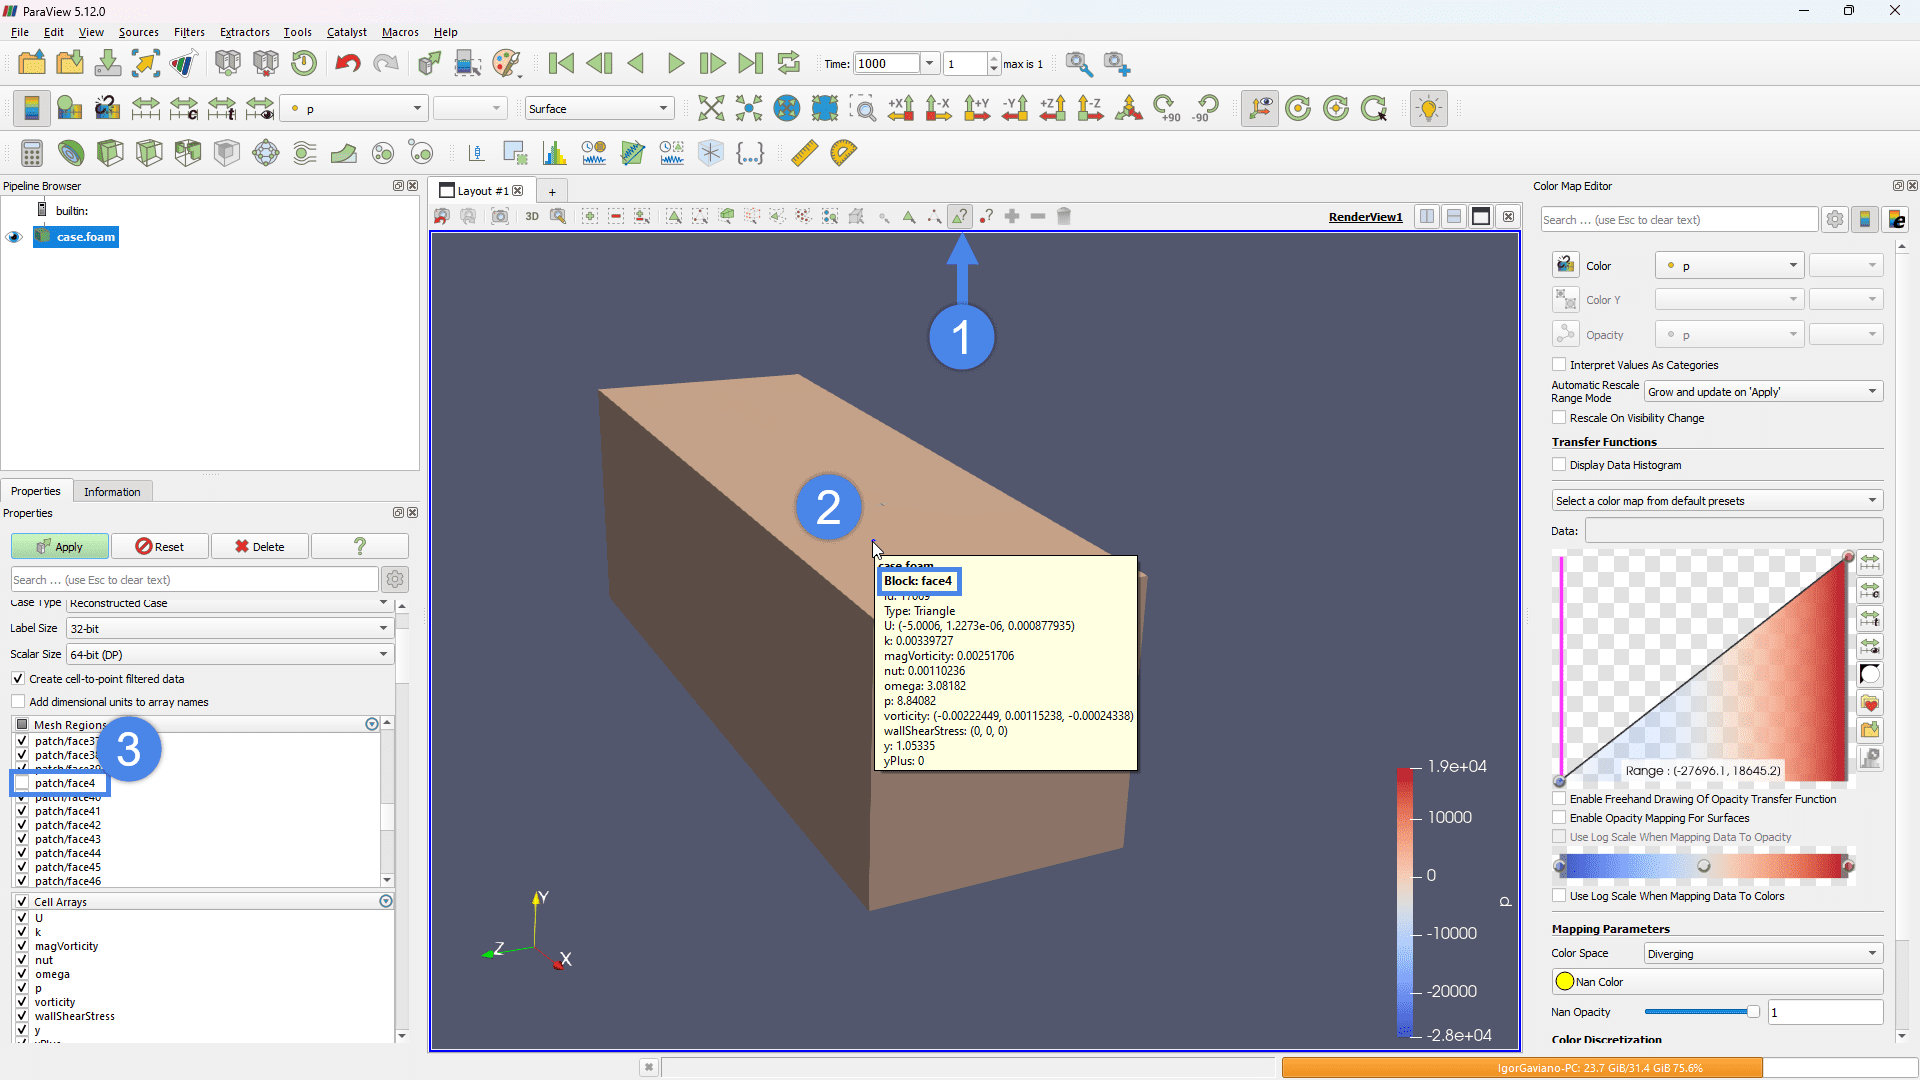
- Use the Hover Cells On tool to inspect the faces and identify their names.
- Once you’ve located the undesired face(s), hide them by unchecking their names and pressing ‘Apply’ to reload the results. This will leave only the faces of interest loaded in the viewer.
- Finally, repeat Step 3 from the previous section to download the results.
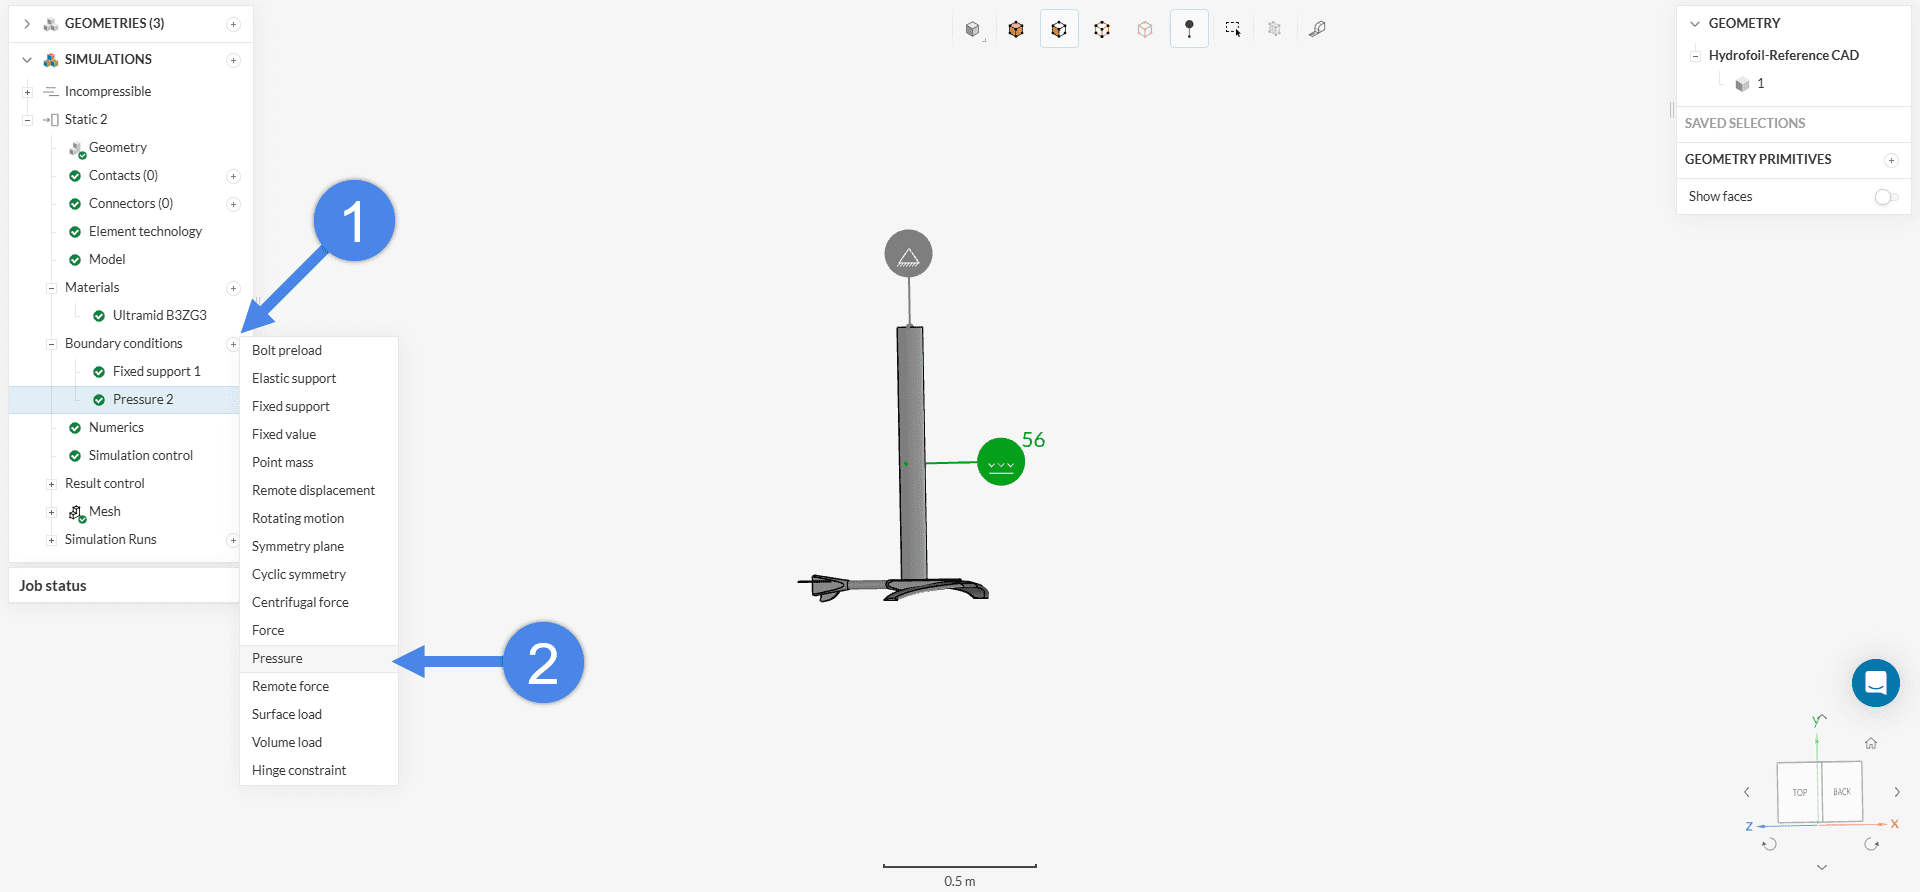
3. Inserting Pressure Data into an FEA Simulation
The final step in conducting an FSI study with SimScale is to import the pressure data into the Static analysis simulation. To accomplish this, simply create a Pressure boundary condition and apply it to the relevant surfaces.
Select the Table icon and upload the .csv file exported from ParaView to map the pressure values accurately.
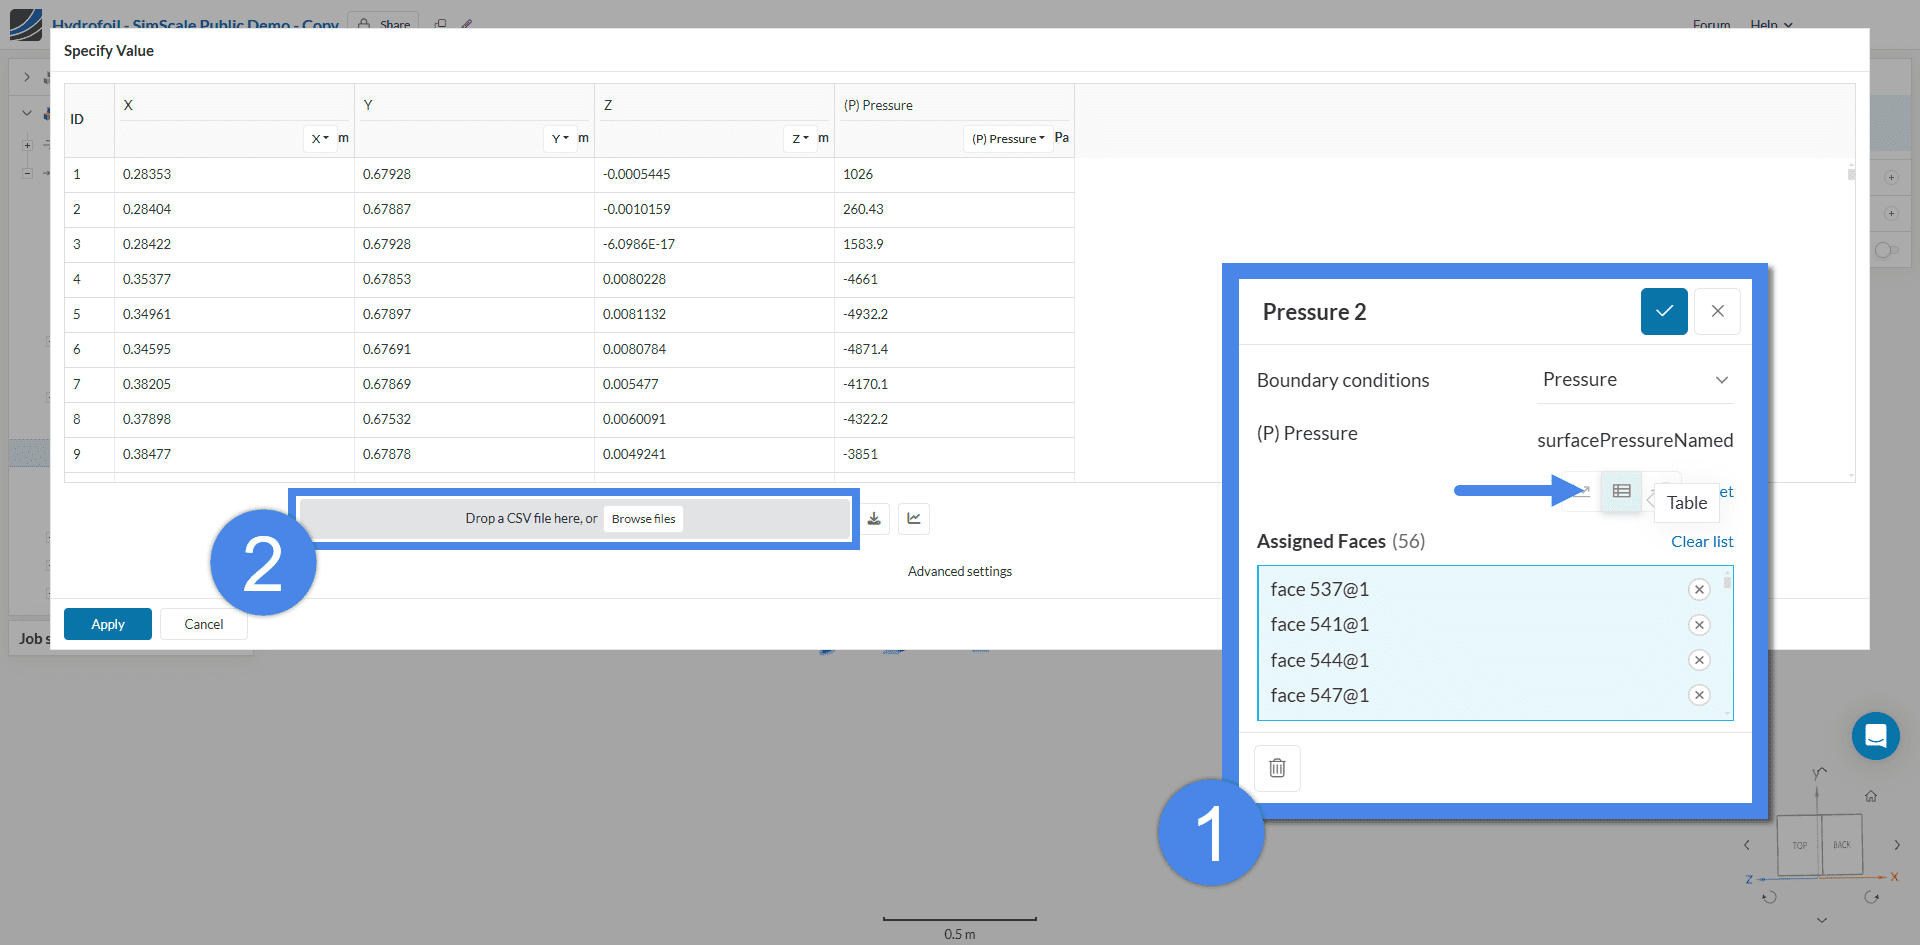
.csv file to be used as a pressure table boundary condition.Ensure .csv File is Ready for Import
Rename the columns in the .csv file from “Points:0,” “Points:1,” and “Points:2” to “X,” “Y,” and “Z,” respectively.
Finally, add the remaining boundary conditions required for the analysis, run the simulation, and complete the FSI study.