This article aims to define electric arcing and provide a best practice guide for setting up your model in SimScale to estimate this phenomenon.
Understanding Dielectric Breakdown & Electric Arcing
Dielectric breakdown and electric arc are inherently connected phenomena. In practice, dielectric breakdown is often the initiating event that enables the formation of an electric arc. In other words, an electric arc typically occurs as a consequence of dielectric breakdown, which establishes the conductive path through which the arc develops.
Dielectric Breakdown
Dielectric breakdown is an electrical discharge that occurs when the applied electric field exceeds a material’s dielectric strength, its maximum field tolerance before failing. Under such conditions, the material’s internal structure (e.g., gas molecules or polymer bonds) rapidly transforms through mechanisms such as ionization or electrolytic dissociation. This process leads to an electron avalanche that forms a conductive path (plasma), creating a conductive path through what was previously an insulating medium. The resulting intense and high-temperature current flow is referred to as an electric arc, often characterized as a catastrophic discharge event\(^1\).
Electric Arcing
An electric arc is an electrical discharge sustained by current flowing through a gaseous medium (plasma) between two electrodes or across a normally non-conductive medium such as air. Physically, it consists of a thermal plasma at ambient pressure, reaching extremely high temperatures, typically on the order of 10,000 K (10 kK).
Arc initiation commonly occurs via two mechanisms:
- Dielectric breakdown, which creates a conductive path through the insulating medium;
- Electrode separation under current, where an arc forms as the contact is interrupted.
The intense light emitted is a direct result of the current flowing through the plasma. In industrial applications, such as Submerged Arc Furnaces (SAFs), the electric arc functions as a critical heat source\(^2\).
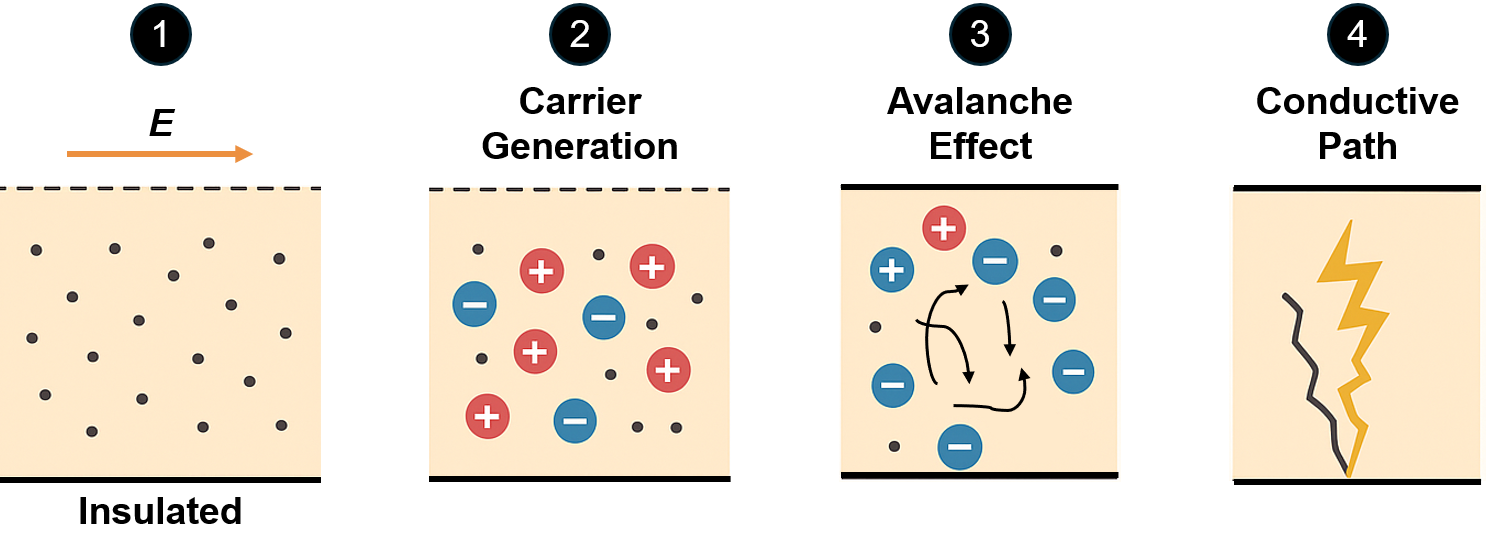
Figure 1 illustrates the four main stages of the dielectric breakdown process in an insulating material:
- Insulated State: An external electric field (E) is applied to an insulating material that initially has a uniform distribution of charges.
- Carrier Generation: The high intensity of the electric field forces electrons to separate from their atoms, thereby producing free charge carriers (electrons and positive ions).
- Avalanche Effect: The free charge carriers are accelerated by the electric field, leading to collisions with other atoms. This causes an exponential, chain reaction release of additional charge carriers.
- Conductive Path Formation: The vast accumulation of charge carriers establishes a conductive channel (a plasma path) through the material, culminating in an electrical discharge, such as lightning.
Material Properties that Impact Breakdown Behavior
The dielectric strength is the fundamental and most critical material property associated with breakdown. Materials with stronger chemical bonds (e.g., ceramics and certain high-performance polymers) generally exhibit higher dielectric strength. Other material properties also influence breakdown behavior:
- Material purity and structural homogeneity: A defect-free, homogeneous material with an ordered internal structure better resists breakdown. Impurities, voids, interfaces (e.g., in composites), or microstructural defects can locally intensify the electric field and trigger early failure.
- Thermal properties and stability: Materials with low thermal conductivity may accumulate heat under electrical stress, promoting thermal breakdown through increased charge mobility or bond degradation.
- Dielectric permittivity (polarizability): The dielectric constant governs how the material polarizes under an applied electric field. While it primarily affects capacitance and field distribution, local variations in permittivity can concentrate the electric field, increasing the likelihood of breakdown.
- Moisture content and environmental humidity: Absorbed water introduces additional charge carriers and conductive pathways, significantly reducing dielectric strength, particularly in polymeric and porous materials.
Using SimScale to Assess Breakdown Risk
While SimScale does not currently support dynamic simulation of the electric arcing process itself, it is still possible to estimate breakdown risk using the Electrostatics solver. A practical approach consists of evaluating whether the local electric field exceeds the material’s dielectric breakdown strength, which serves as a first-order indicator of potential arcing onset. The method for assessing risk consists of:
- Analyze Electric Field Distribution: Use the electrostatics solver to determine the distribution of the electric field within the system you are simulating.
- Compare Against Dielectric Strength: Investigate whether the calculated electric field exceeds the material’s breakdown electrical field strength (dielectric strength).
- Identify Risk Locations: The areas where the electric field exceeds the material’s dielectric strength are the locations where dielectric breakdown voltage or flashover could occur.
This approach allows you to predict where arcing might start, rather than simulating the full arcing phenomenon or its dynamic thermal effects.
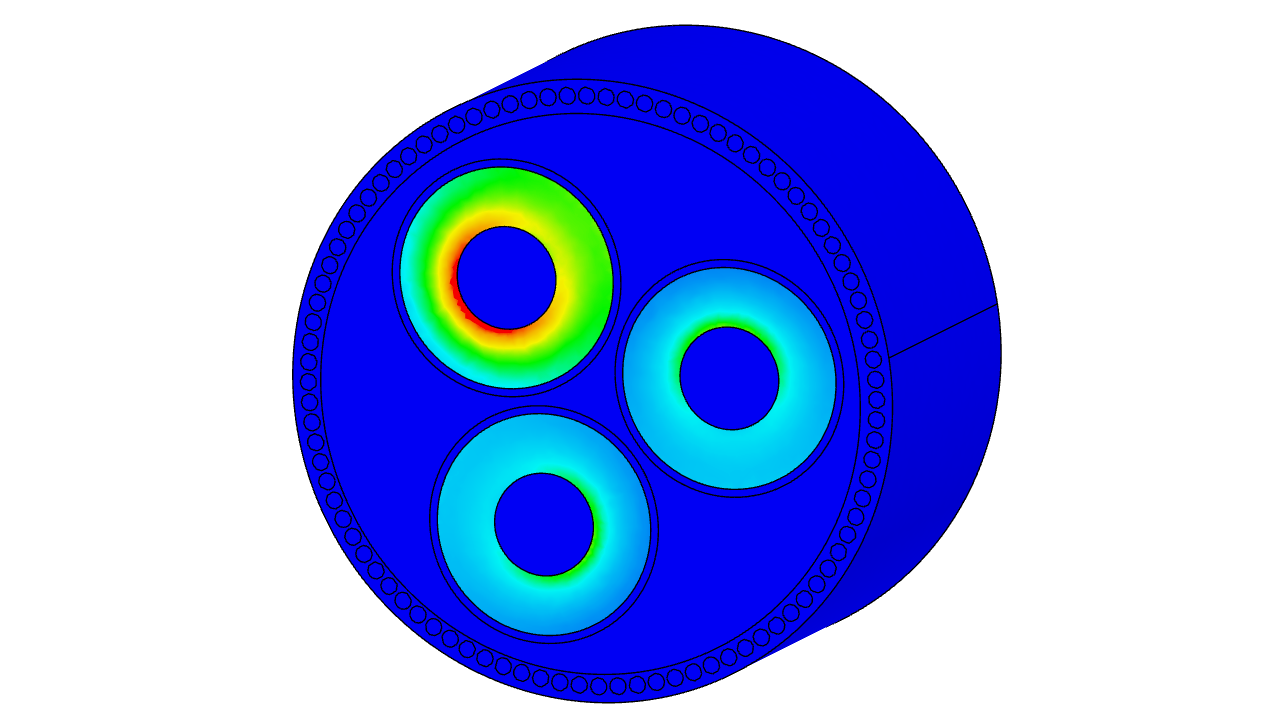
Simulation Example: High Voltage 3-Phase Cable
The tutorial example demonstrates an Electrostatics simulation of a high-voltage (HV) three-phase power cable assembly using the Electromagnetics solver. The primary objectives are to evaluate the electric field magnitude and compute the system’s capacitance matrix. Additionally, this setup can be used to assess breakdown risk by comparing the material’s relative permittivity and dielectric strength against the simulated electric field magnitude under different applied voltage levels.
How to Interpret Electric Field Results for Breakdown Assessment
After the simulation is complete, the solution fields can be accessed to post-process the Electric Field Magnitude. These results alone can already help identify regions with potential breakdown risk. However, SimScale also offers a useful feature called Field Calculator, which allows users to define custom expressions. In this case, a safety factor can be calculated by dividing the Electric Field Magnitude by the material’s dielectric strength. The resulting value should range from 0 to 1, where values equal to or greater than 1 indicate that the dielectric strength has been exceeded, signaling a breakdown risk.
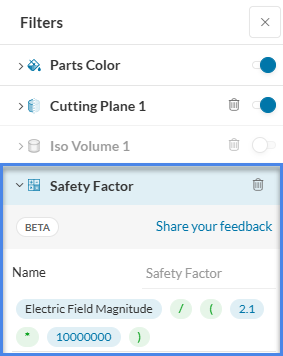
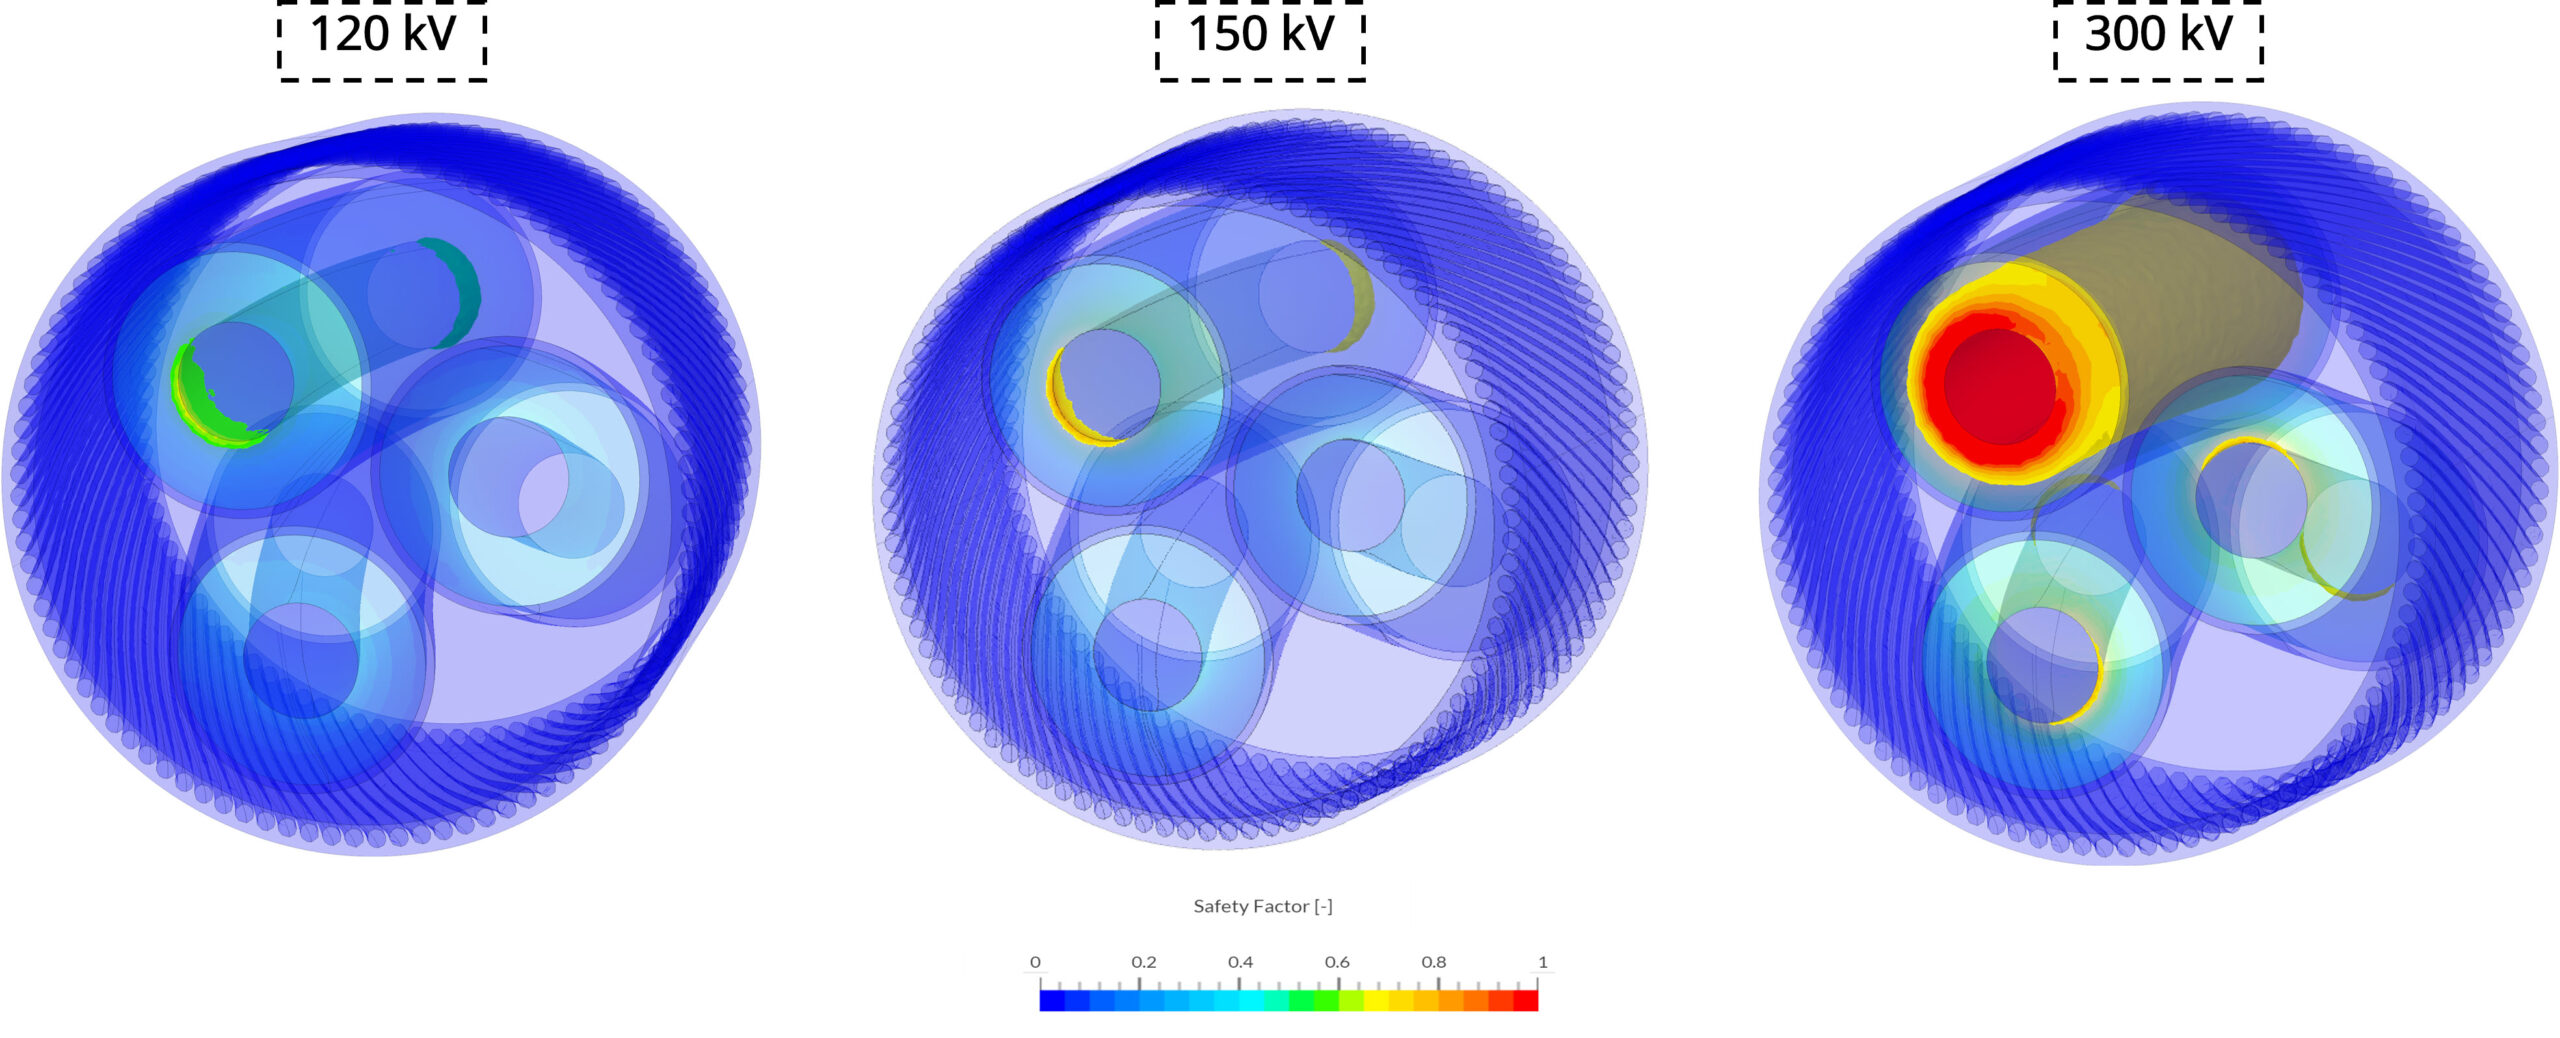
Figure 4 presents the same cable evaluated under three voltage scenarios: 120 kV, 150 kV, and 300 kV. By comparing the results, it is possible to assess the performance of the insulation system using the safety factor as an indicator.
As discussed, a safety factor equal to or greater than 1 indicates that the electric field exceeds the insulation capacity of the material. For 120 kV and 150 kV, the safety factor remains below 1, demonstrating acceptable operating conditions. However, at 300 kV, the safety factor reaches significantly higher values, clearly indicating a high risk of dielectric breakdown and a strong likelihood of an electric arc occurring under this scenario.