Validation Case: Airflow in a Data Center
The airflow in a data center validation case belongs to fluid dynamics. This test case aims to validate the following:
- Velocity profile
The validation is performed against experimental data and simulations presented by Wibron, Ljung, and Lundström\(^{1}\), who studied the flow field behavior within a data center module.
Geometry
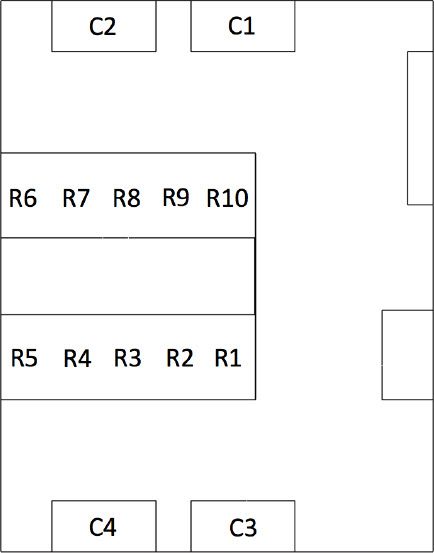
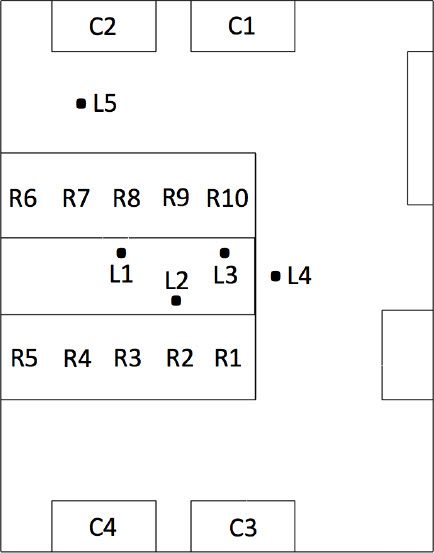
The geometry consists of a data center module with four Computer Room Air Conditioning (CRAC) units, as well as ten server racks, as shown in the schematics below:
Furthermore, the authors also provide an isometric image of the data center module, showing its dimensions.
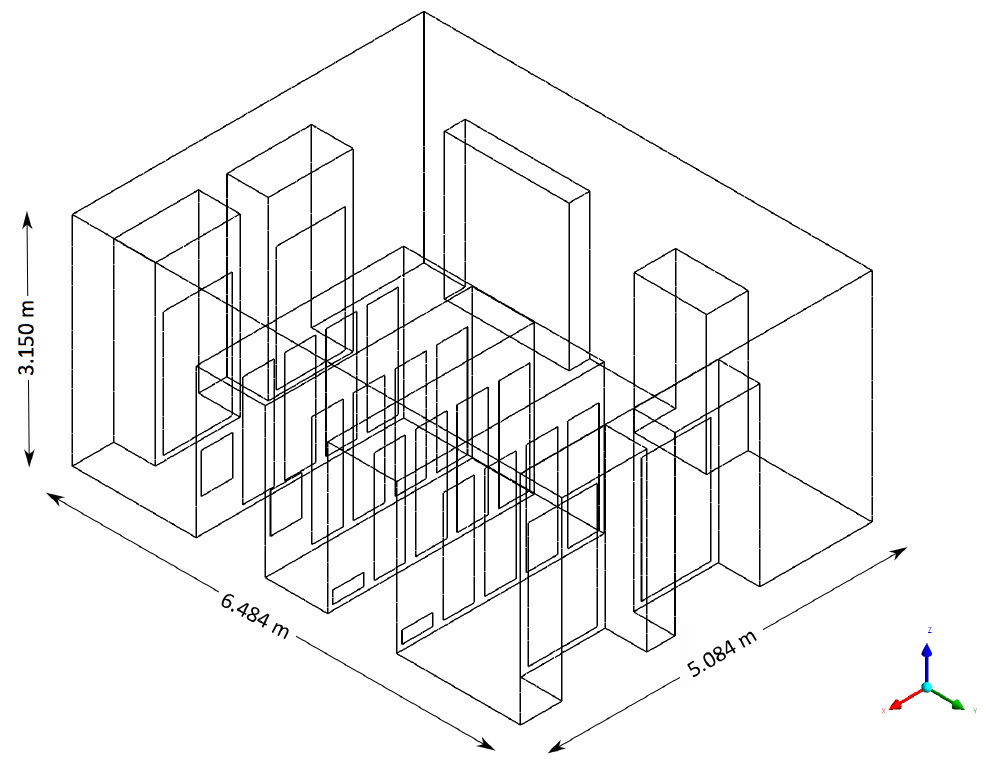
The schematics provided in the study contain the dimensions of the module, however they do not provide any additional details about the dimensions of the equipment.
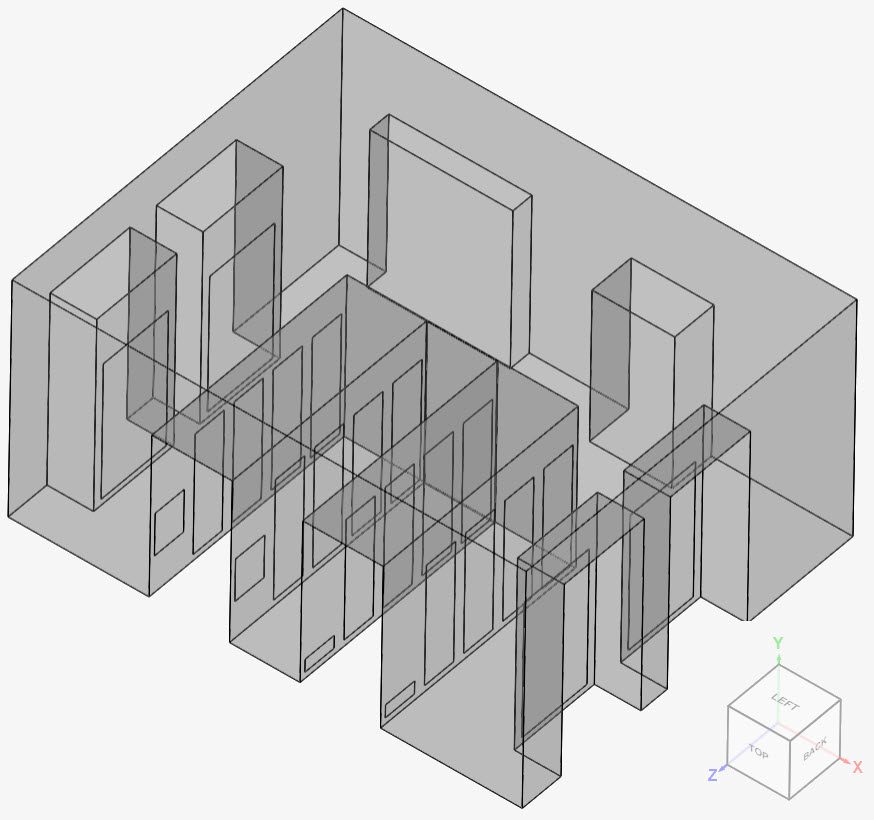
Therefore, to obtain the final geometry used in this validation case, the isometric image shown in Figure 2 was manually measured to determine the missing dimensions. Figure 3 shows the resulting geometry in SimScale:
Analysis Type and Mesh
Tool Type: OpenFOAM®
Analysis Type: Steady-state, incompressible Convective heat transfer analysis
Turbulence Model: k-omega SST.
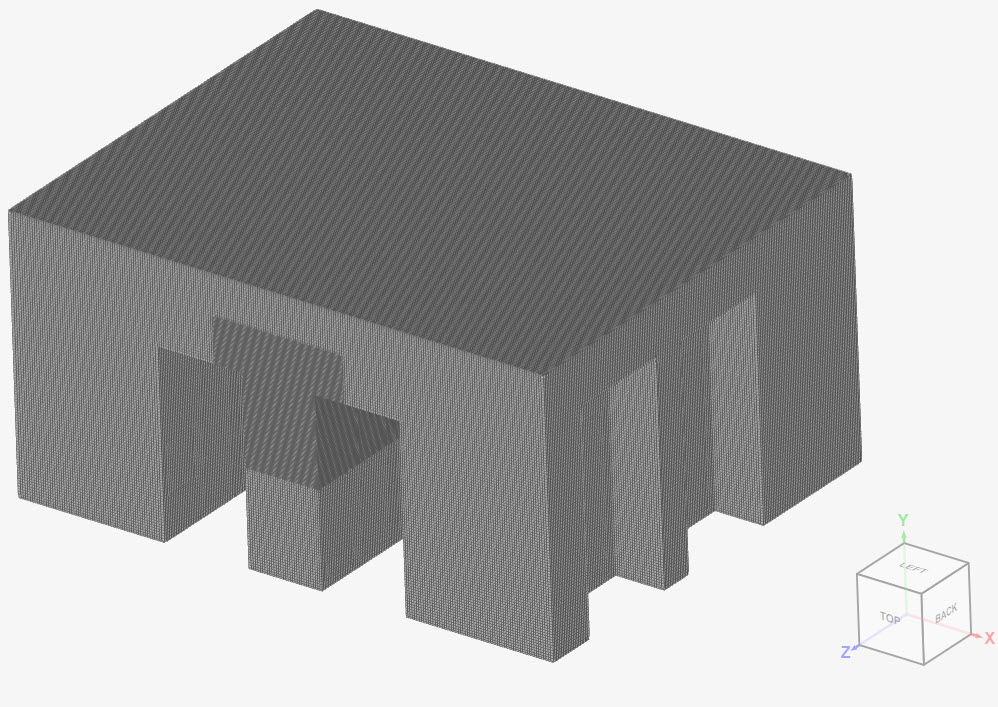
Mesh and Element Types: The meshes used in this validation case were created in SimScale with the hex-dominant (parametric) algorithm. To ensure that the results are mesh-independent, a total of three successively finer meshes were used to run the simulations. The results were found to be mesh-independent.
Table 1 presents relevant metrics and details of the resulting meshes:
| Domain | Identification | Mesh Type | Cells | Element Type |
| Data center module | Coarse mesh | Hex-dominant (parametric) | 127314 | 3D hexahedral |
| Data center module | Moderate mesh | Hex-dominant (parametric) | 820561 | 3D hexahedral |
| Data center module | Fine mesh | Hex-dominant (parametric) | 6059578 | 3D hexahedral |
Find below, in Figure 4, the fine hex-dominant (parametric) mesh generated in SimScale.
Simulation Setup
Material:
The fluid material for this simulation is air. In terms of material properties, the authors did not indicate any values, except for the specific heat. Therefore, the following material settings are used in this validation case:
- Viscosity model: Newtonian
- \((\nu)\) Kinematic viscosity: 1.5295e-5 \(m^2/s\)
- \((\rho)\) Density: 1.1965 \(kg/m^3\)
- Thermal expansion coefficient: 0.00343 \(\frac {1} {K}\)
- \(T_0\) Reference temperature: 273.15 \(K\)
- \((Pr_{lam})\) Laminar Prandtl number: 0.713
- \((Pr_{t})\) Turb. Prandtl number: 0.85
- Specific heat: 1004.4 \(\frac {J} {kg.K}\)
Boundary Conditions:
In the reference study, the authors provided the volumetric flow rate and the temperature at the inlet of the CRAC units. Furthermore, the volumetric flow rate and heat dissipation are also given for each server rack.
Following the same approach used in the simulations from the reference paper, each server rack has an outlet (cold side) and an inlet (hot side). The temperature at the server inlets is calculated based on the flow rate through the server rack, the temperature at the cold side, and the heat dissipation. The formula is described in this article.
In the table below, the configuration for both velocity and pressure are given at each of the boundaries:
| Boundary | Boundary Type | Boundary Condition Description |
| Crack unit 1 – Inlet | Velocity inlet | 0.61 \(m/s\) at 19.7 \(ºC\) |
| Crack unit 2 – Inlet | Velocity inlet | 0.62 \(m/s\) at 20 \(ºC\) |
| Crack unit 3 – Inlet | Velocity inlet | 0.59 \(m/s\) at 19.7 \(ºC\) |
| Crack unit 4 – Inlet | Velocity inlet | 0.62 \(m/s\) at 19.9 \(ºC\) |
| Outlets – CRAC units | Pressure outlet | Fixed at 0 gauge \(Pa\) |
| Rack 1 – Hot side | Custom | 0.4 \(m/s\) inlet at 35.171 \(ºC\) |
| Rack 2 – Hot side | Custom | 0.46 \(m/s\) inlet at 33.228 \(ºC\) |
| Rack 3 – Hot side | Custom | 0.47 \(m/s\) inlet at 32.864 \(ºC\) |
| Rack 4 – Hot side | Custom | 0.45 \(m/s\) inlet at 33.412 \(ºC\) |
| Rack 5 – Hot side | Custom | 0.26 \(m/s\) inlet at 20.000 \(ºC\) |
| Rack 6 – Hot side | Custom | 0.41 \(m/s\) inlet at 34.255 \(ºC\) |
| Rack 7 – Hot side | Custom | 0.38 \(m/s\) inlet at 36.013 \(ºC\) |
| Rack 8 – Hot side | Custom | 0.43 \(m/s\) inlet at 34.347 \(ºC\) |
| Rack 9 – Hot side | Custom | 0.42 \(m/s\) inlet at 34.856 \(ºC\) |
| Rack 10 – Hot side | Custom | 0.39 \(m/s\) inlet at 35.614 \(ºC\) |
| Racks 1 through 10 – Cold side | Velocity outlet | Face normal value for velocity, equal to the hot side of each rack |
| Internal walls | Wall | No-slip condition, adiabatic |
| External walls | Wall | No-slip condition, adiabatic |
Result Comparison
In the reference study\(^{1}\), the air velocity was measured over five lines (L1 through L5). For all lines, measurements were made 0.5, 1, and 1.5 \(m\) above the ground. For L4 and L5, one additional measurement was taken at 2 meters height.
Since no precise locations were given for the probe lines, the figure below was used to estimate their coordinates.
Velocity Profiles
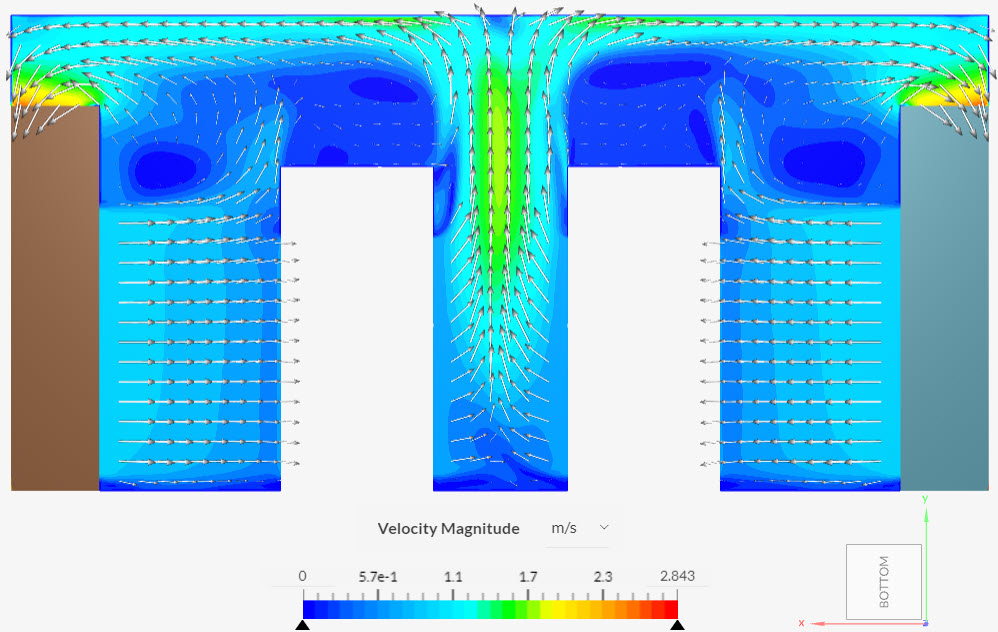
Find in the images below a comparison between the velocities obtained in SimScale, the experimental data, and the simulation results from the reference paper\(^{1}\).
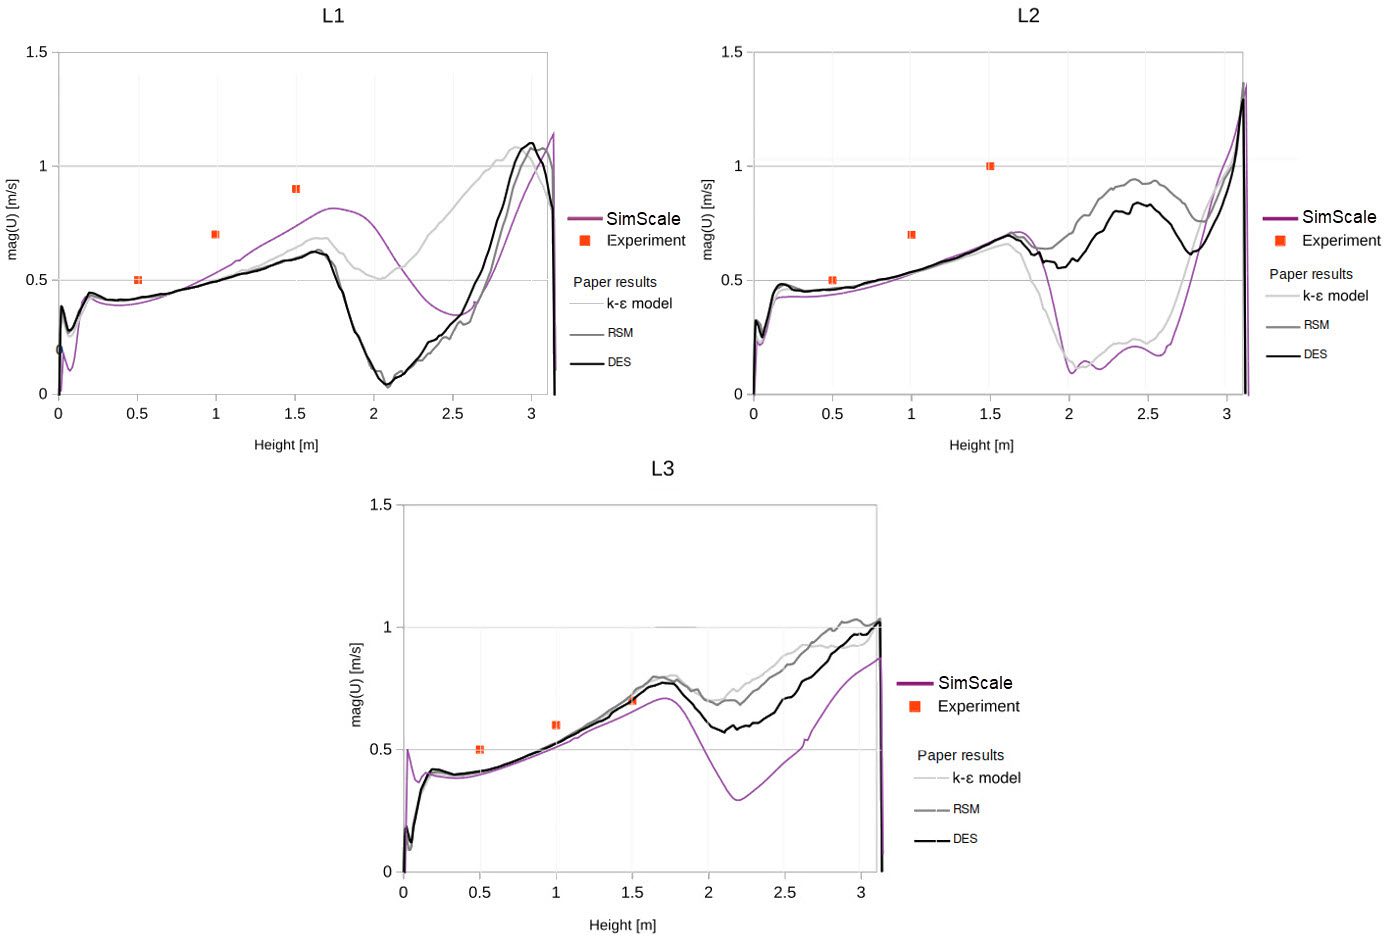
The fine mesh results from SimScale show the same trends as the experimental and simulation results from the reference study. Given the lack of a precise description of the data center module and air properties, differences in the results are expected.
Moreover, the fine mesh used in SimScale has 6059578 cells, whereas the fine mesh from the paper has only 1486077 cells. Figure 7 contains a similar comparison, now for lines L4 and L5.
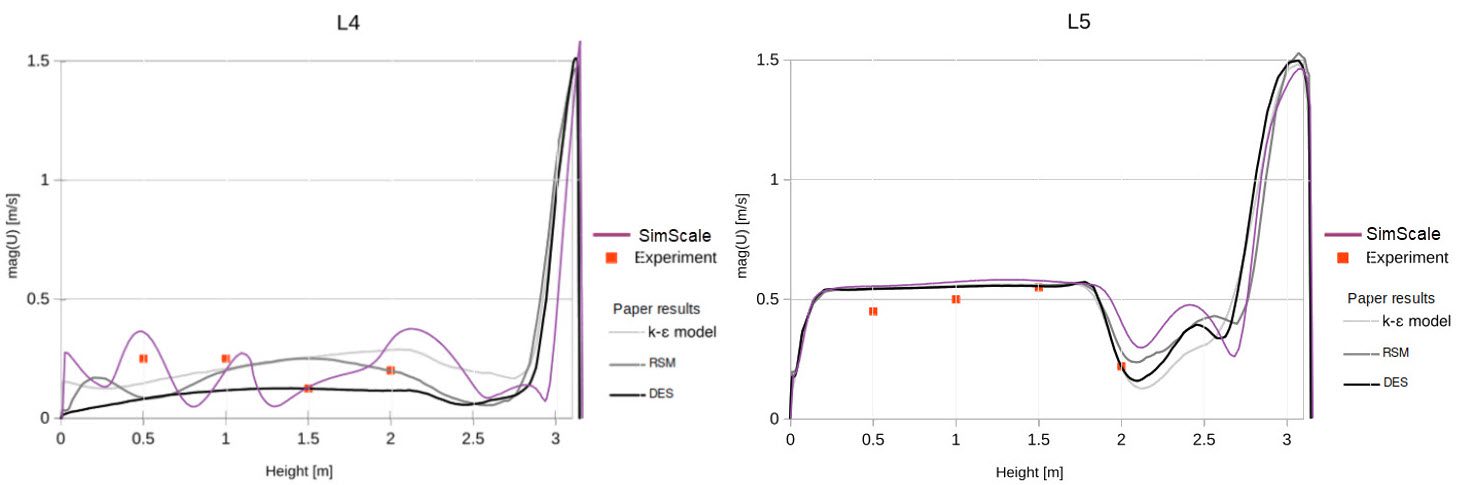
For lines L4 and L5, the velocity profiles obtained with SimScale are also showing the same trends as the results from the reference study. This is expected, based on the assumptions that were made during the case setup.
The flow is slightly unsymmetrical, due to differences in the flow rates through the CRAC units and server racks.
Last updated: March 15th, 2021
Did this article solve your issue?
How can we do better?
We appreciate and value your feedback.


