Validation Case: CAARC- Facade Pressure Validation Study
The CAARC validation study has for many years been used to validate computational fluid dynamics (CFD) codes. This case has been shown in the past validating both URANS and LES turbulence models, where the trend has been that RANS/URANS has predicted the windward facade well, yet fails to predict the sides and leeward facades. In contrast, LES has shown a good agreement with experimental results, however, there is still in general, an over-prediction for the sides and leeward facade, and a worse prediction on the windward facade.
In this project, we look at SimScale’s lattice Boltzmann method (LBM) implementation, Pacefish® from Numeric Systems GmbH\(^4\), and how well it performs using hybrid models, k-omega SST DDES, and k-omega SST IDDES models. These models use wall models based upon k-omega SST, but then transition to the highly accurate LES model further from the wall. Read more on the DES models here.
Summary
The LBM results using ‘Profile 1’ and the IDDES turbulence model predicted much better than past LES solutions for the windward and leeward facades and came in around as the middle ground for the side facades, where it performed better than LES results obtained in [1] but slightly higher than obtained in [2]. Correlations between Experimental and LBM results show that a strong linear correlation is shown for all 3 sides. The error for the rear was slightly positive, and the error for the side was even more positive, meaning that values followed good trends but were higher than experimental values as expected from past CFD studies.
CAARC Validation Study – Setup
Key points about the simulation setup include:
- The CAARC building was run in a 0° configuration.
- Two velocity and intensity profiles were used from different papers;
- Profile 1\(^1\) used a power law with the exponent at 0.17 and reference velocity at building height at 10 \(m/s\).
- Profile 2\(^2\) used a power law with the exponent at 0.16 and reference velocity at building height at 12.12 \(m/s\).
- SimScale’s LBM implementation, Pacefish, was used from Numeric Systems\(^4\).
- The k-omega SST IDDES turbulence model was chosen as it particularly excels for cell sizes this small whilst still providing wall modeling.
- The floor had a roughness of 0.5 \(m\) to maintain the profile.
- The sidewalls had a periodic condition.
- The top wall was a ‘slip’ wall.
- The upstream boundary was assigned the (Atmospheric Boundary Layer) ABL profiles and the downstream boundary was assigned a pressure outlet with reference pressure 0 \(Pa\).
- The simulation was run for approximately 5 fluid passes using the reference velocity at building height.
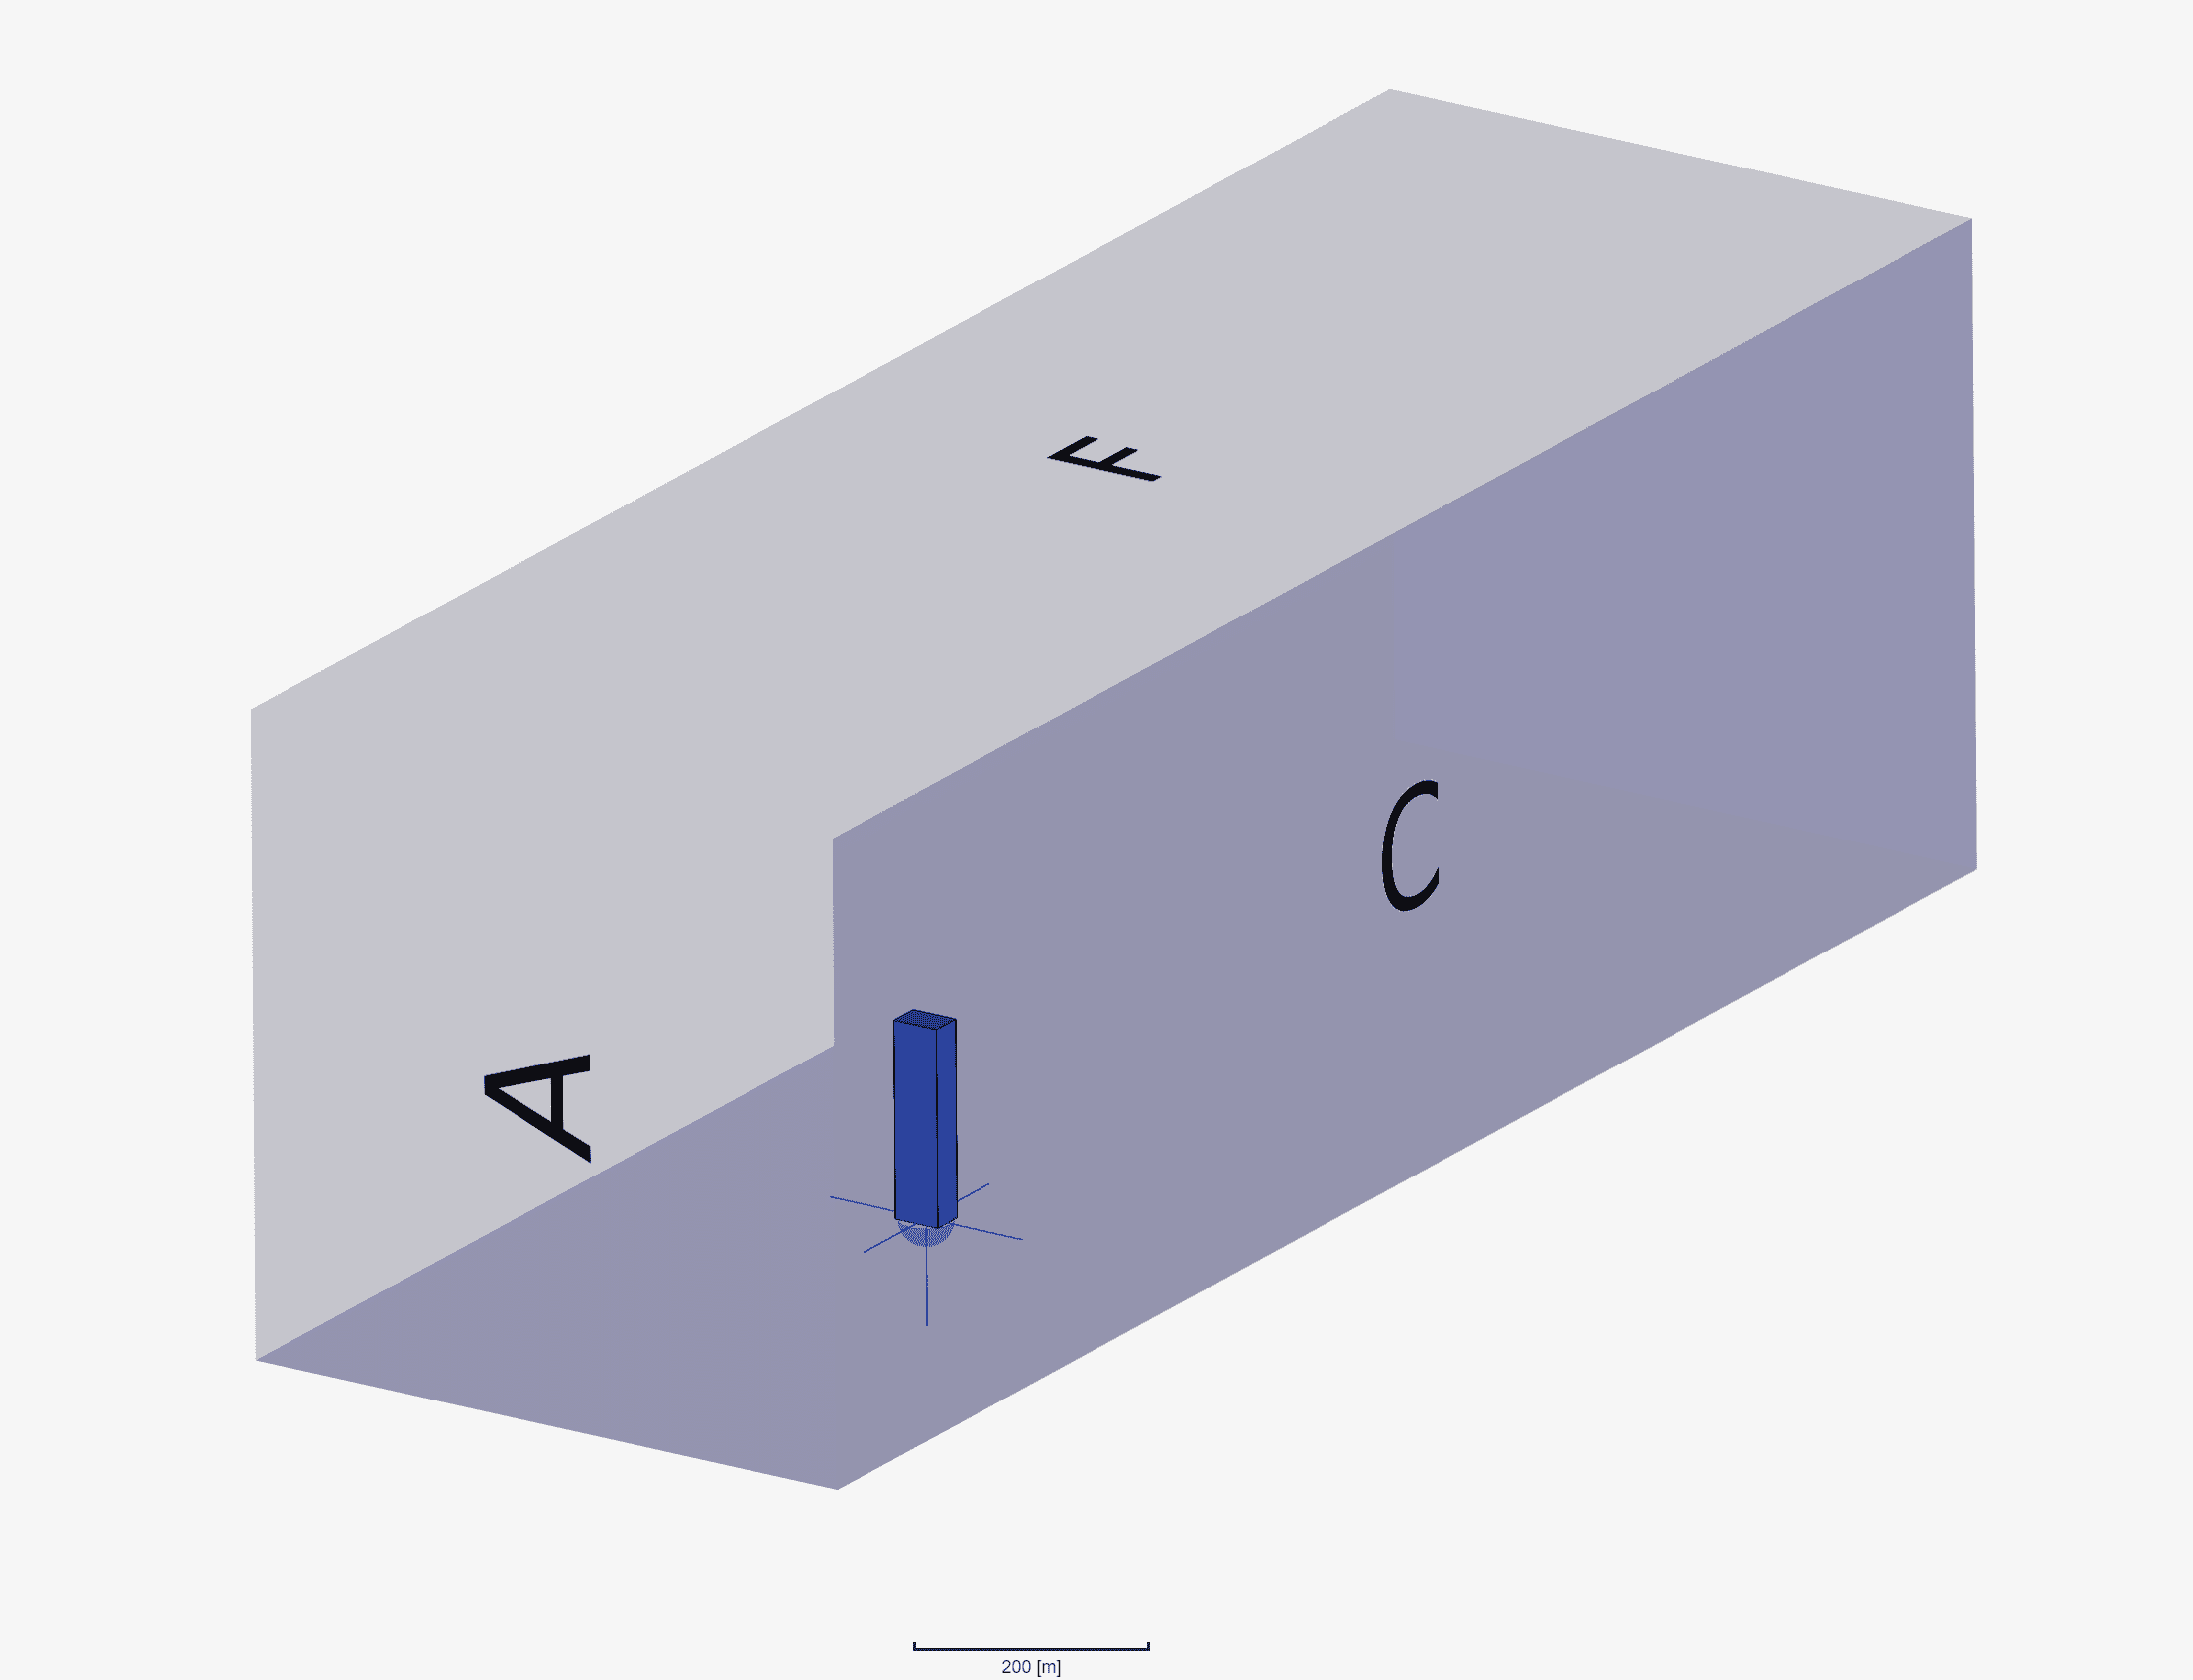
- A virtual wind tunnel was used that measured 1.8 \(km\) long x 1.2 \(km\) wide x 600 \(m\) tall.
- Default air properties were used with values:
- 1.529e-5 \(m^2/s\) for kinematic viscosity.
- 1.196 \(kg/m^3\) for density.
- Automatic meshing was used where the final run was ‘Very Fine’ resulting in a mesh that had;
- 91 million cells.
- Minimum cell size on the building of 0.12 \(m\).
- Maximum cell size in the far-field of 7.9 \(m\).
- Reynolds scaling factor of around 1:25.
- The simulation took 20 hours using 81.7 GPUh for this validation quality mesh.
CAARC Validation Study – Key Results
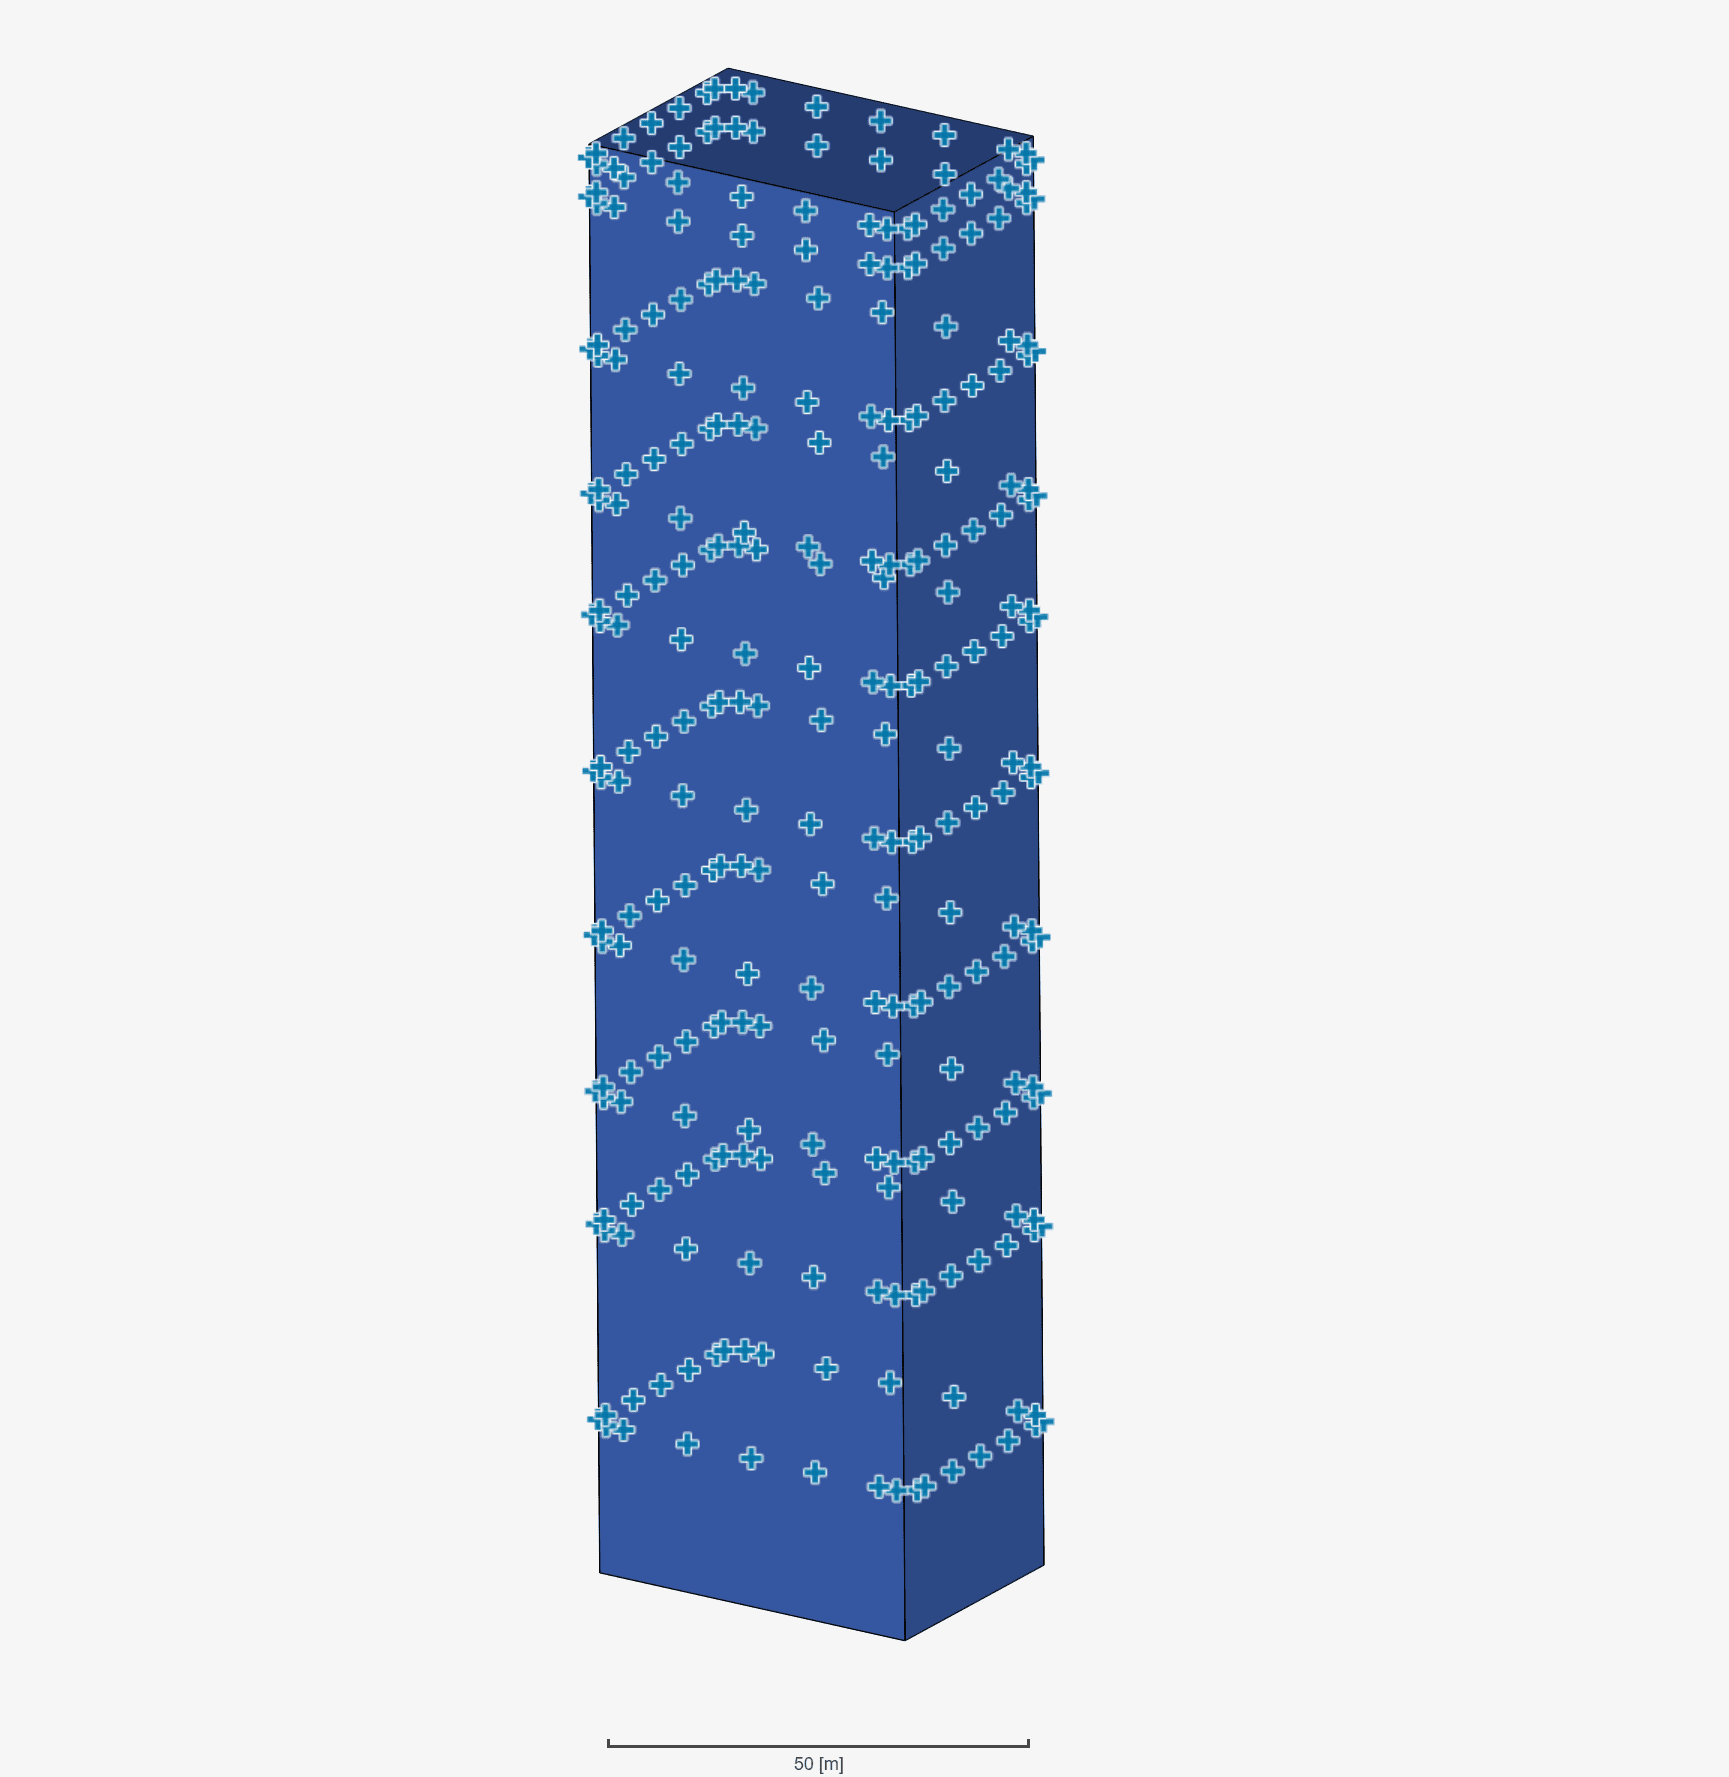
The purpose of our CAARC validation study is to prove that mean facade pressures are validated against experimental data. The results used to compare were obtained as follows.
- Pressure coefficients were taken from [3] which reviews a lot of data currently obtained by CFD in terms of wind loads (from 2013) which includes pressure coefficients around the CAARC building at 3/4 H.
- This experimental data and past CFD data was taken from the paper using a graph tracing tool, therefore, some minor error could be expected.
- SimScale results were obtained from an LBM (lattice Boltzmann method) solution for two profiles as described earlier.
- Results from SimScale were averaged over 75% of the simulation, therefore for the last 675 seconds.
- These average results were processed into pressure coefficients using the velocity at building height.
- The result sets were plotted against each other in a post-processing tool to show how they all compare.
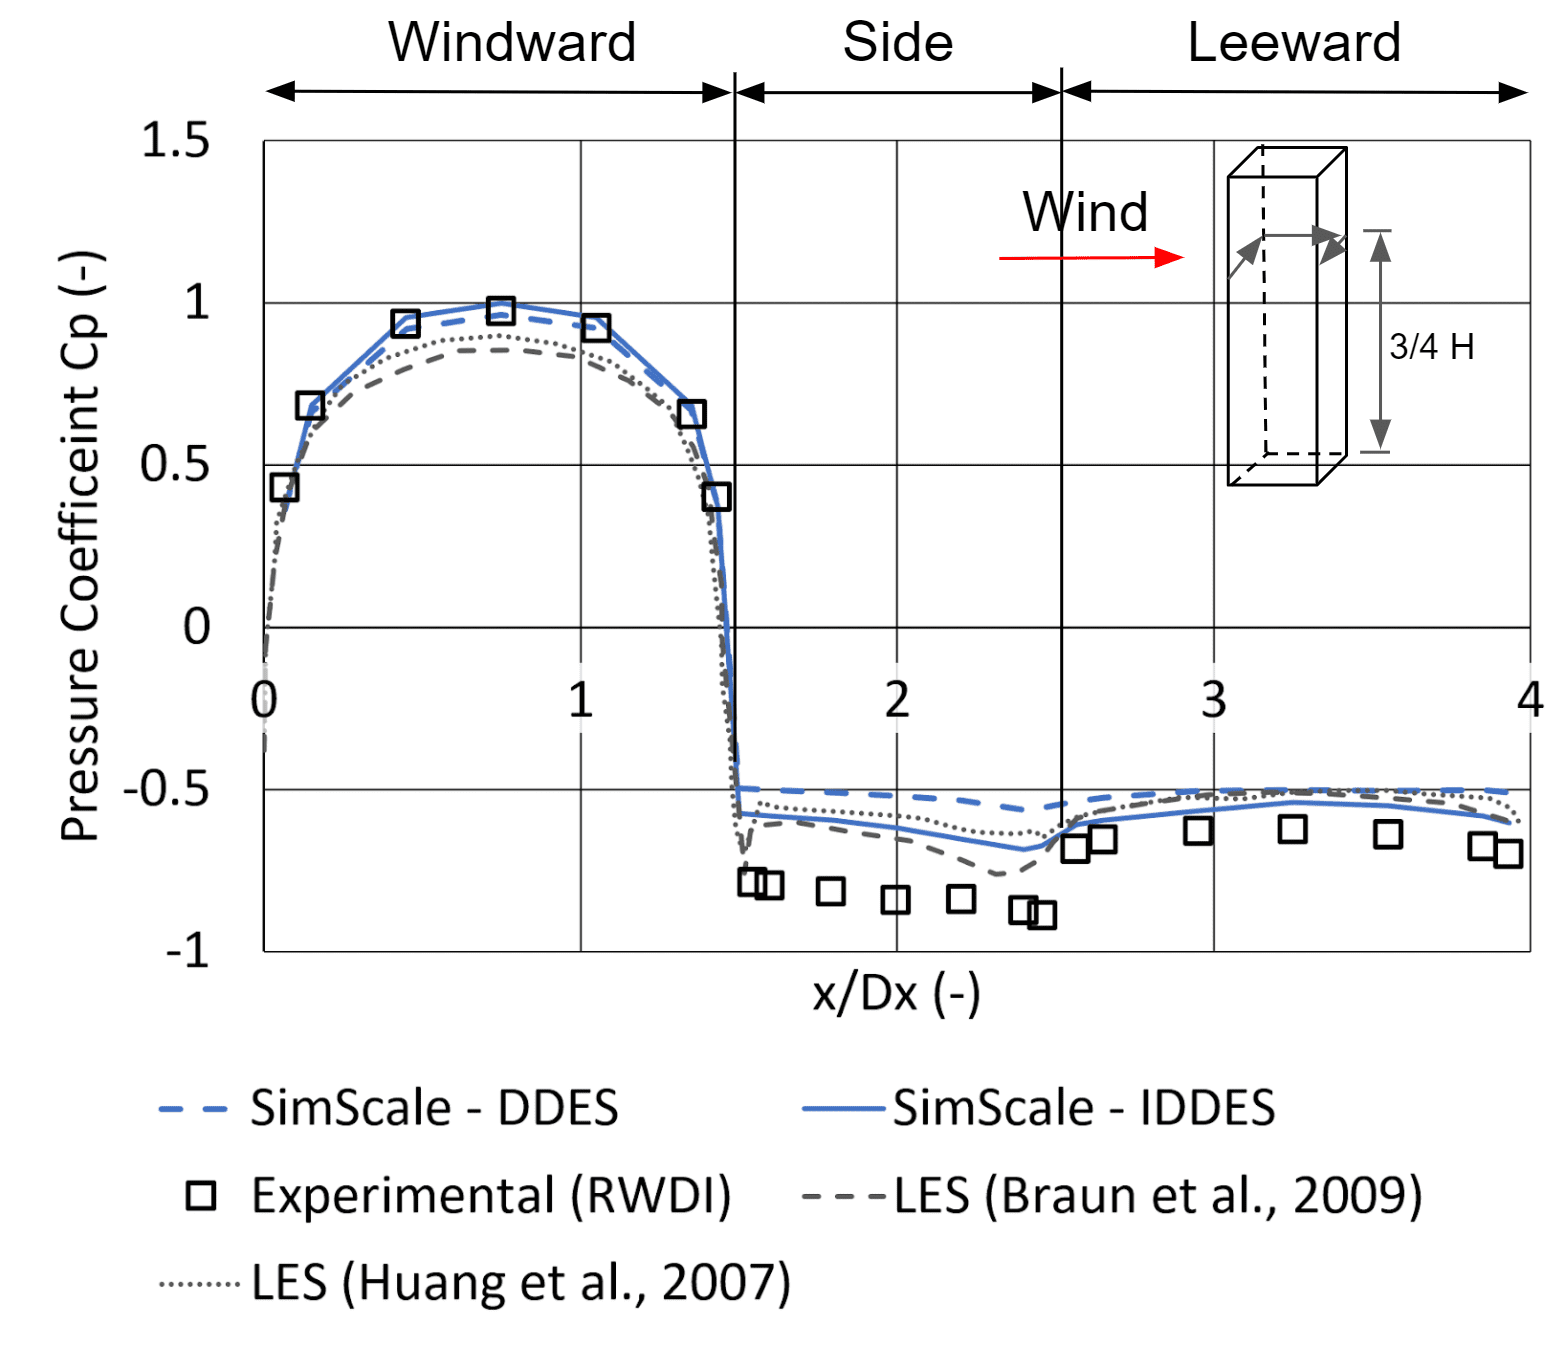
We can see that both turbulence models compare well for the windward facade, however as expected, in comparison to a full LES model, the DDES does not perform as well for the side facade and the leeward facade. This is likely because of the increased amount of wall modeling that is done in comparison to LES or IDDES. The IDDES model, however, holds up very well, outperforming LES for the leeward and windward facades, and coming around as the middle ground for the side facade.
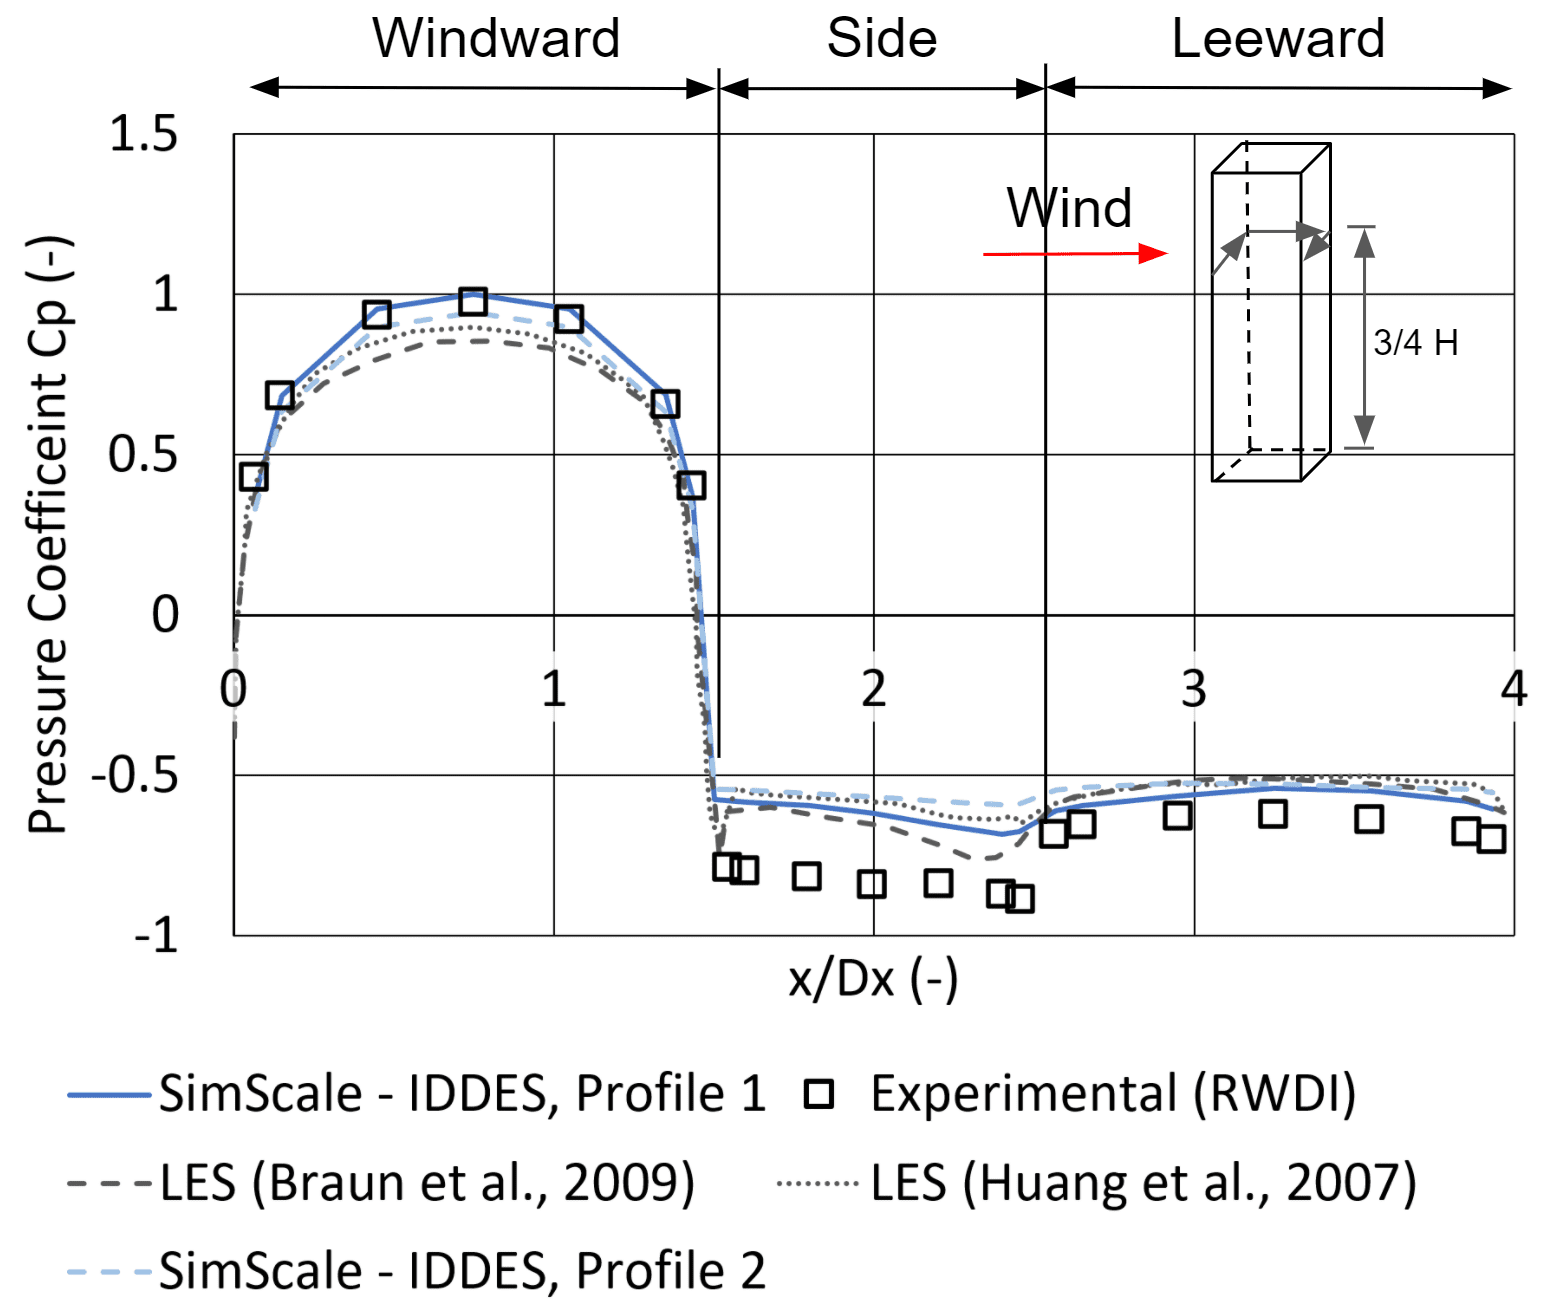
To ensure a thorough investigation, a different inlet profile was compared to see how sensitive results were to the inlet. The results didn’t vary as much as expected, however, with the second inlet profile, results were less comparable to experimental. The model still performed better for the windward facade, however, performed comparatively to LES results labeled ‘LES (Haung et al., 2007)’ for both the side facade and the leeward facade.
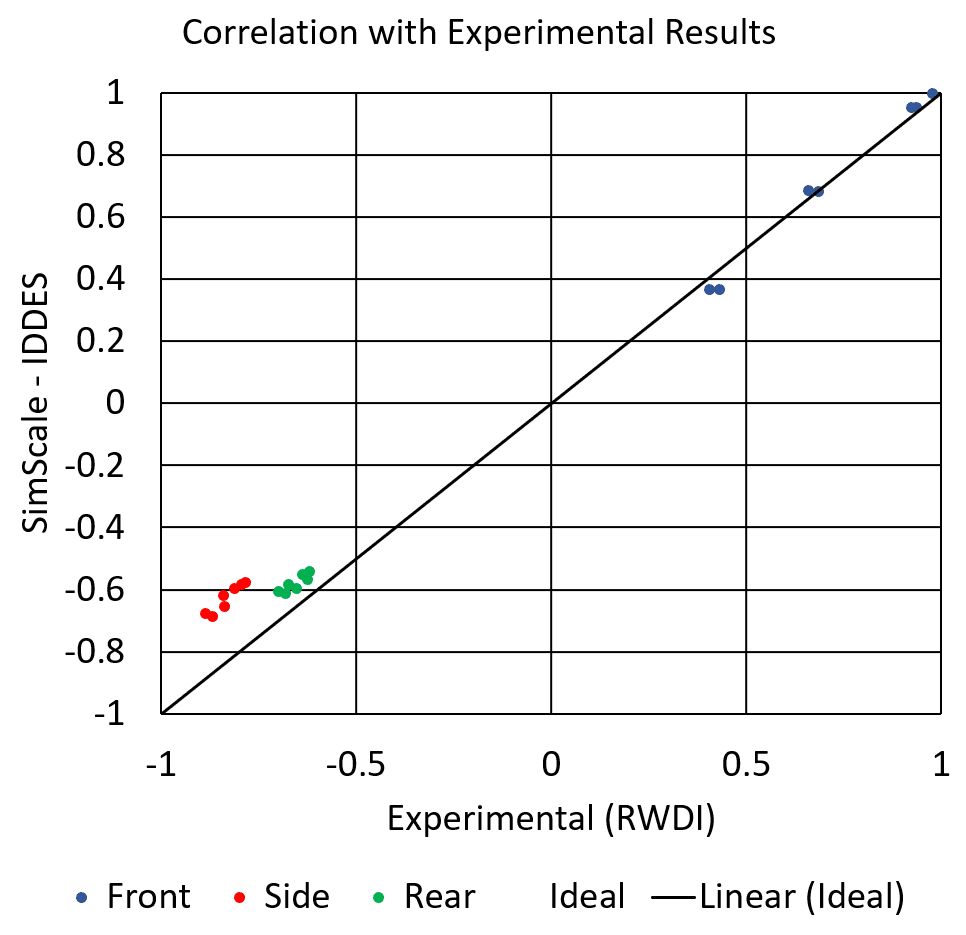
Looking at correlations, it makes it clear how the results compare to experimental, where if all points were located on the ideal line, a perfect result would be obtained. This shows in a different but clearer way how our result for the windward facade is almost a perfect match. The leeward facade shows a good linear correlation, however, its error is positive slightly. The side facade is similar however with a higher positive error.
CAARC Validation Study – Additional Results
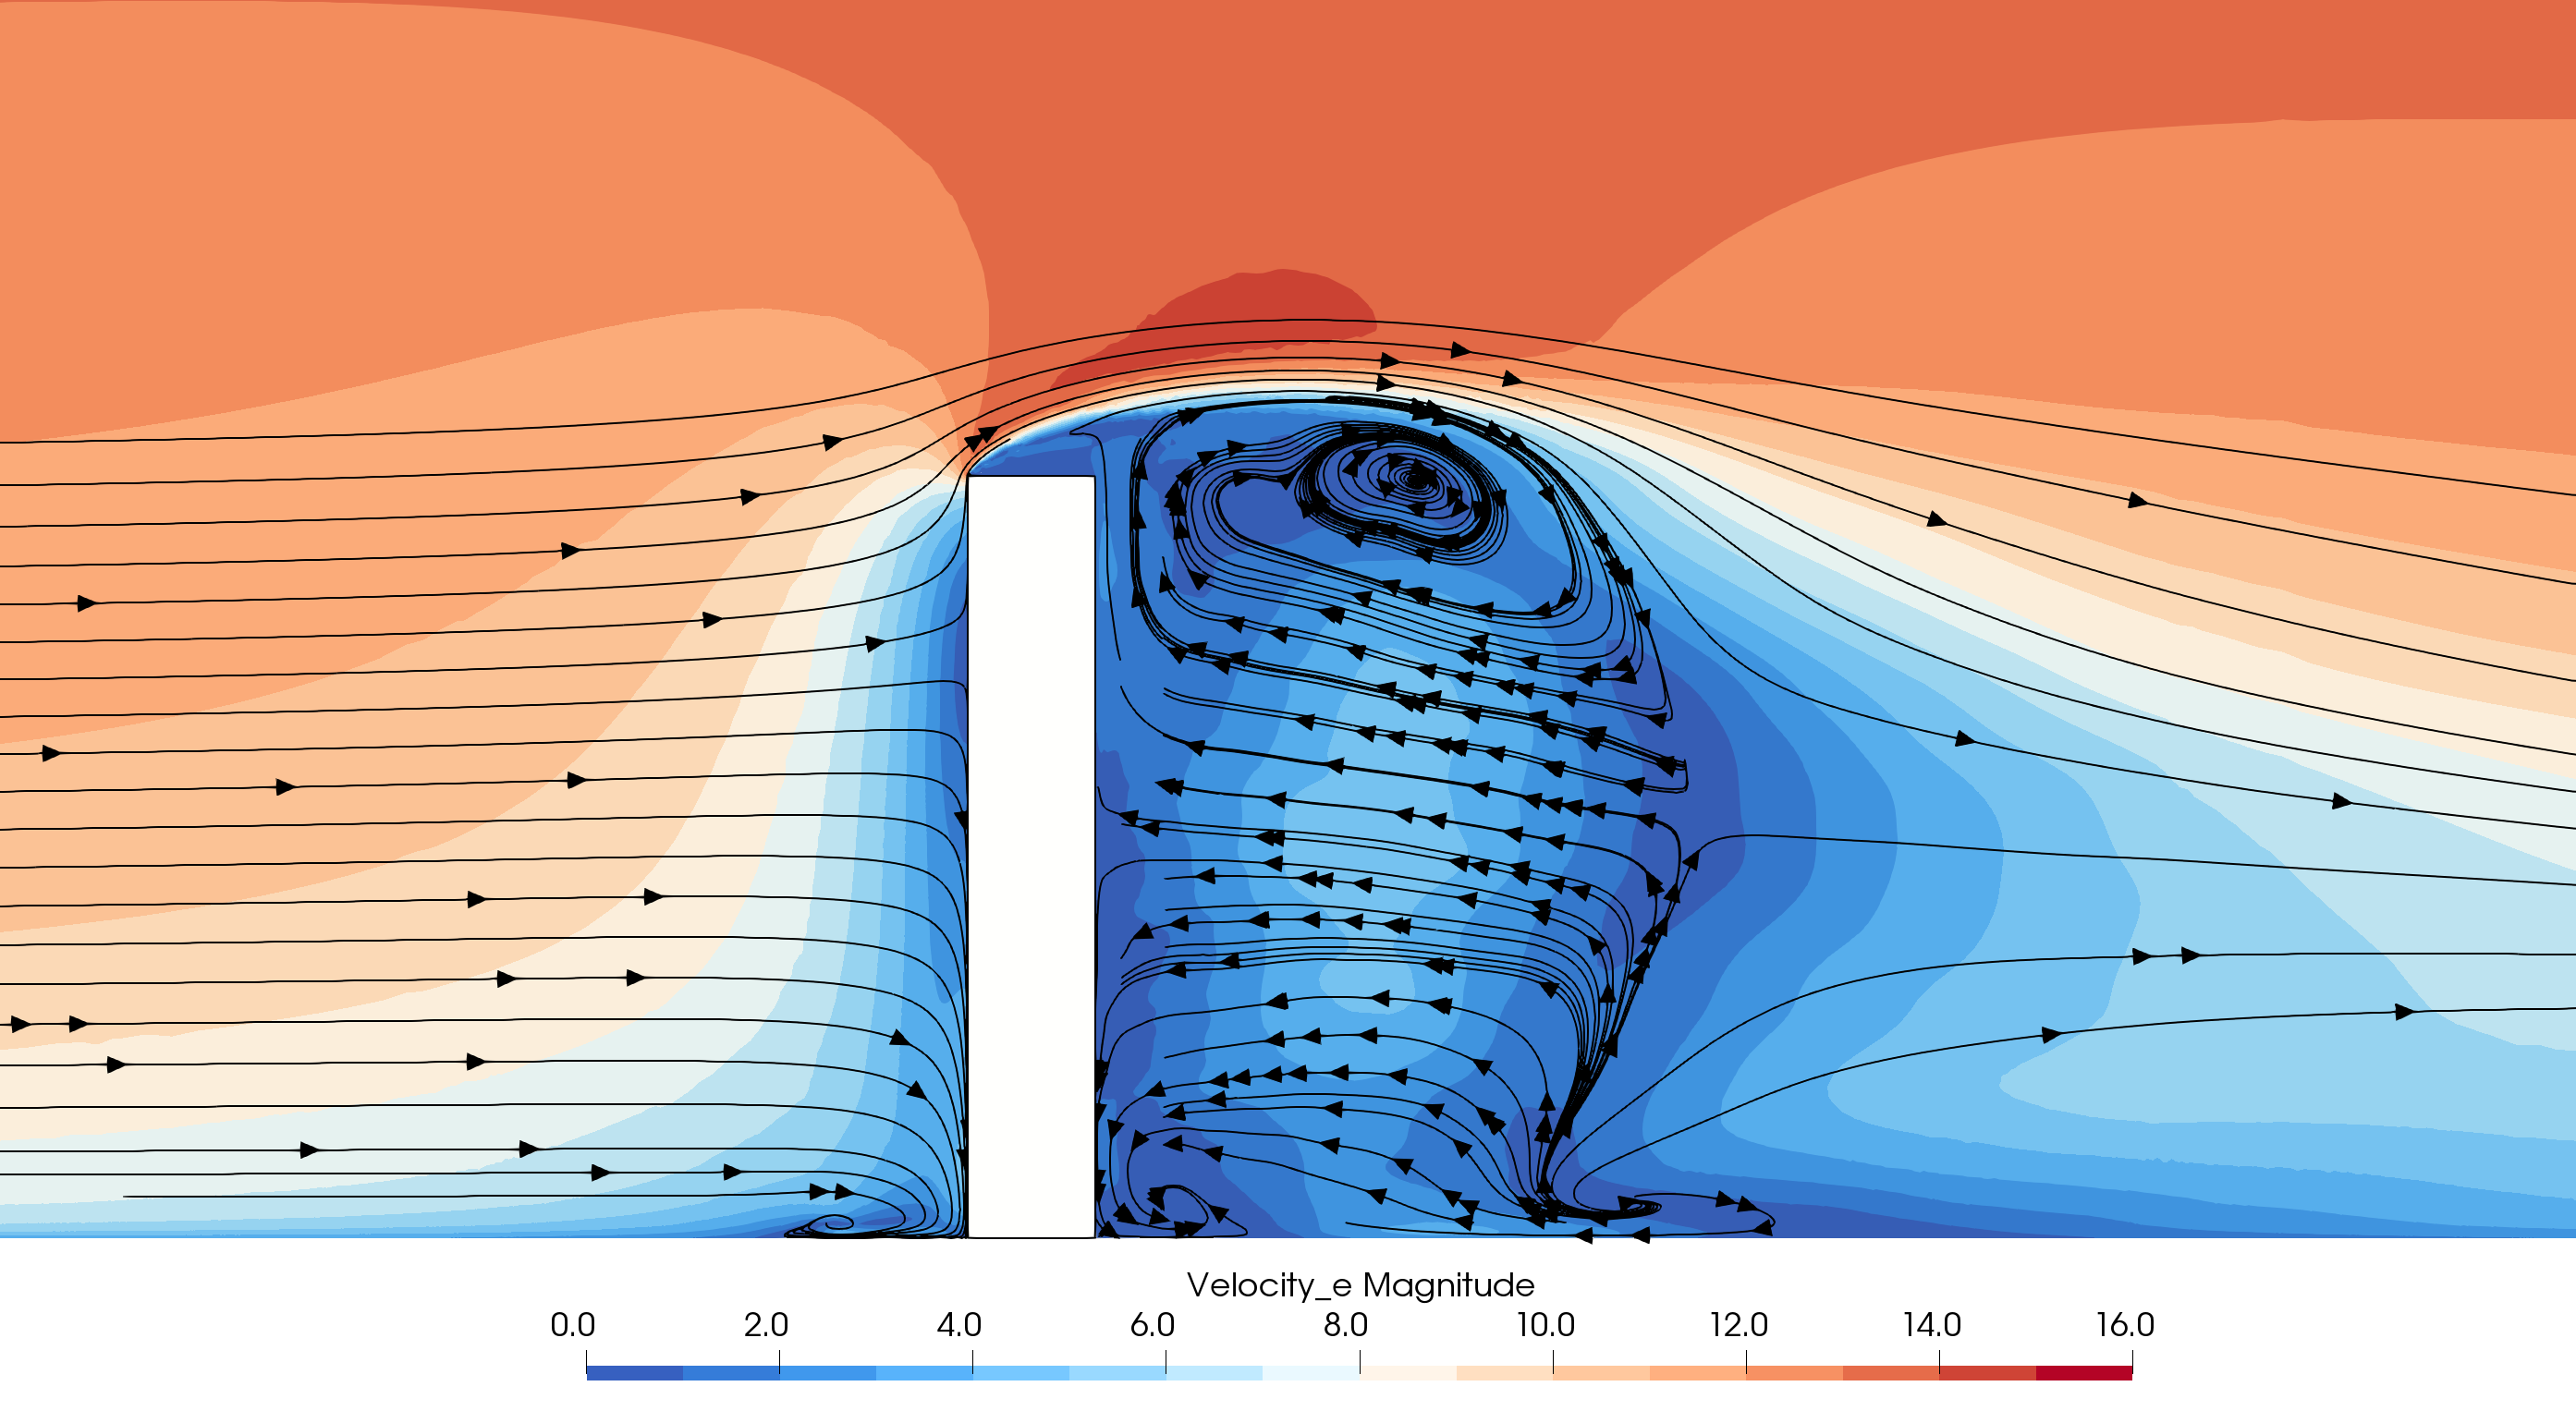
In addition to pressure coefficient values, we can look at additional results, for example, the velocity fields around the building.
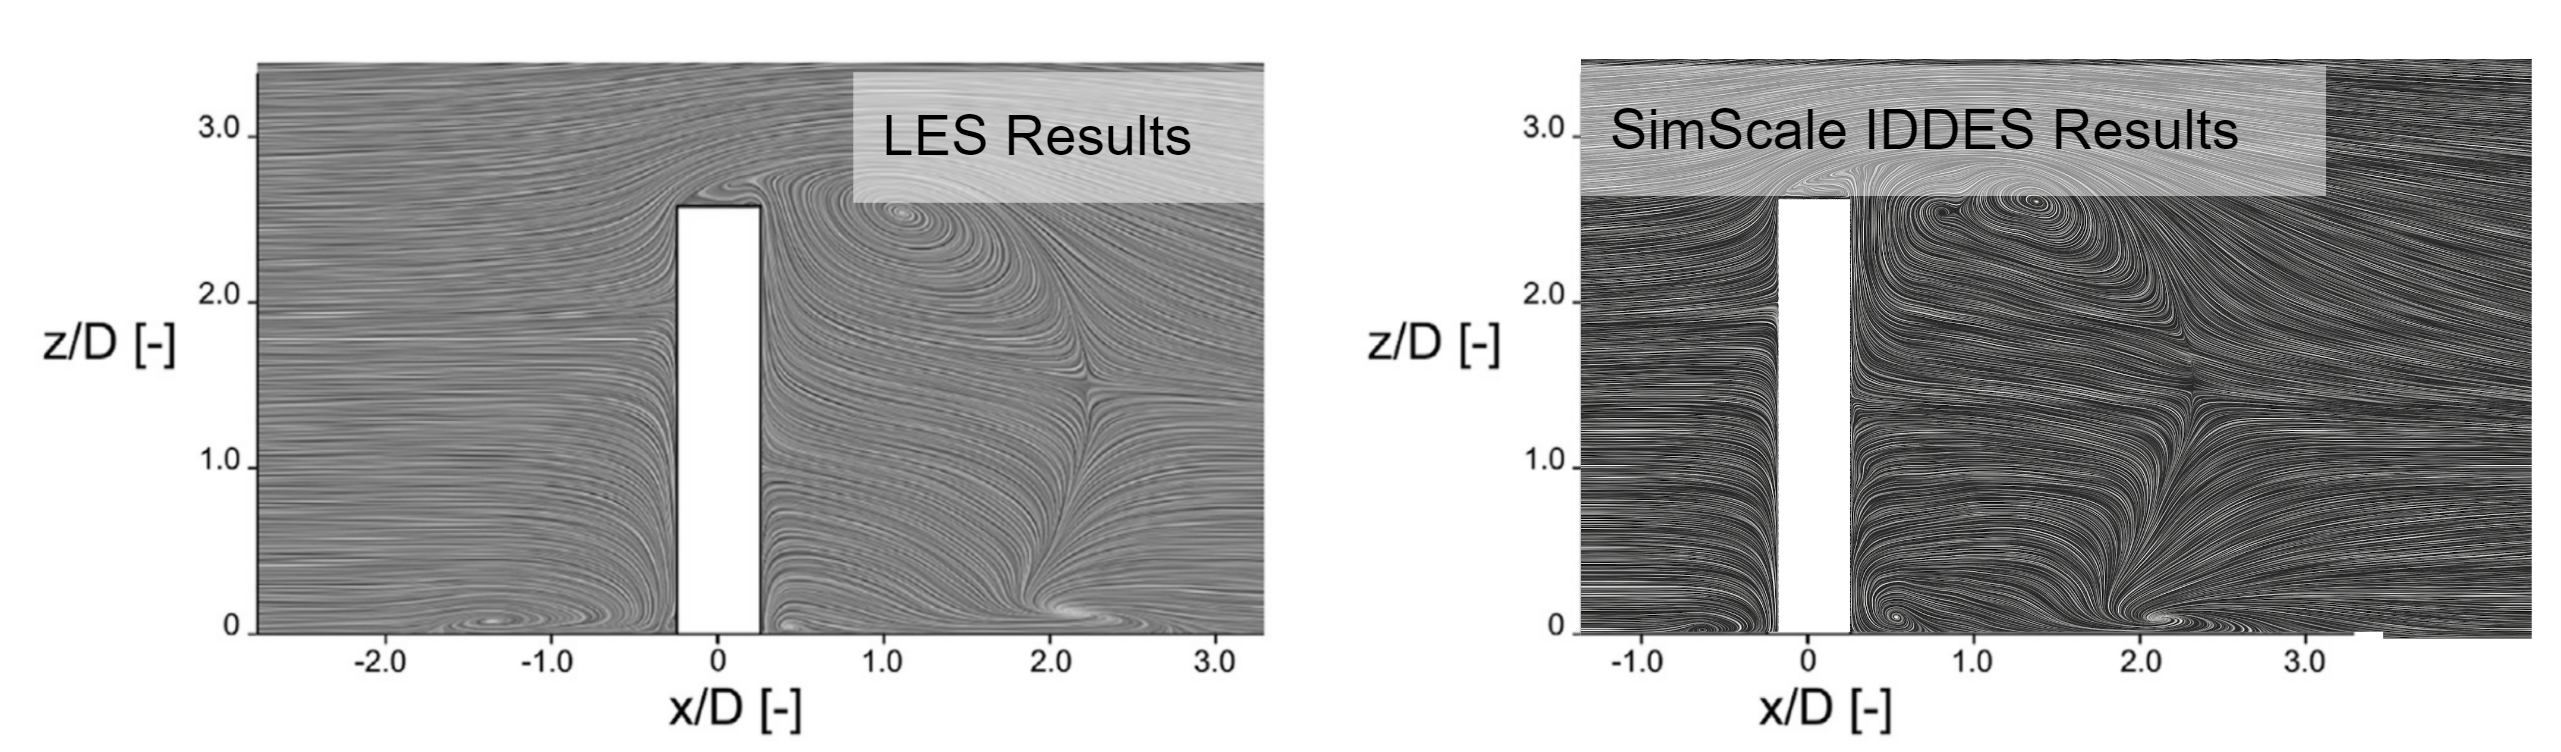
The comparison of flow pattern shows very comparable results to [5], this can be seen particularly in wake distance from the building and main swirl locations at the top of the building at x/D = 1.25 and at the ground at x/D = 2. A larger image can be seen below to make the results clearer.
Comparison to LES is not better than a comparison to wind tunnel results, however, it is good to get a sanity check against peer-reviewed results for highly accurate models such as LES.
Conclusion
Results obtained from SimScale’s lattice Boltzmann method (LBM) implementation from Numeric Systems\(^4\) show strong agreement in comparison to experimental results and surpass, in some cases, previous results obtained using LES.
Both DDES and IDDES were compared for the same grid, and it was found that the resolution in combination with the IDDES turbulence model had an advantage over DDES as it models less of the boundary layer, but still provides wall modeling.
Two different ABL inlet profiles from different papers where LES results were obtained were compared to test the sensitivity. It was found that an exponent of 0.17 better matched experimental results compared to those obtained with an exponent of 0.16, however, both agreed well overall.
Using correlations (Figure 5), we can highlight the trends shown in Figure 3 and Figure 4 where windward facades showed a strong linear correlation with little error, meaning that an almost perfect corroboration was present. The leeward facade had a good linear correlation with a slightly positive error, highlighting a good trend, but pressures that were slightly higher than experimental values. The side facade also had a good linear correlation, but a visible positive error, meaning this was the facade that was least well predicted, however, remember it was just as good or better than similar past LES results.
References
- Elshaer, Ahmed & Aboshosha, Haitham & Bitsuamlak, G. & El Damatty, Ashraf & Dagnew, Agerneh. (2016). LES evaluation of wind-induced responses for an isolated and a surrounded tall building. Engineering Structures. 115. 179-195. 10.1016/j.engstruct.2016.02.026.
- Dagnew, Agerneh & Bitsuamlak, G.. (2014). Computational evaluation of wind loads on a standard tall building using LES. Wind and Structures. 18. 567-598. 10.12989/was.2014.18.5.567.
- Dagnew, A. and Bitsuamlak, G., 2013. Computational evaluation of wind loads on buildings: a review. Wind and Structures, 16(6), pp.656.
- https://www.numeric.systems/
- Ricci, M, Patruno, L, Kalkman, I, de Miranda, S & Blocken, B 2018, Towards LES as a design tool: Wind loads assessment on a high-rise building, Journal of Wind Engineering and Industrial Aerodynamics, vol. 180, pp. 1-18. https://doi.org/10.1016/j.jweia.2018.07.009
Last updated: February 18th, 2026
Did this article solve your issue?
How can we do better?
We appreciate and value your feedback.


