Documentation
This validation case belongs to fluid dynamics. The aim of this test case is to validate the following parameters for a buoyant flow simulation between heated plates, and specifically a hot and cold wall:
The simulation results from SimScale were compared to the experimental results presented in a research article on turbulent natural convection in a closed cavity by Betts et. al. \(^1\)
The geometry is constructed based on the reference case \(^1\), as shown below:
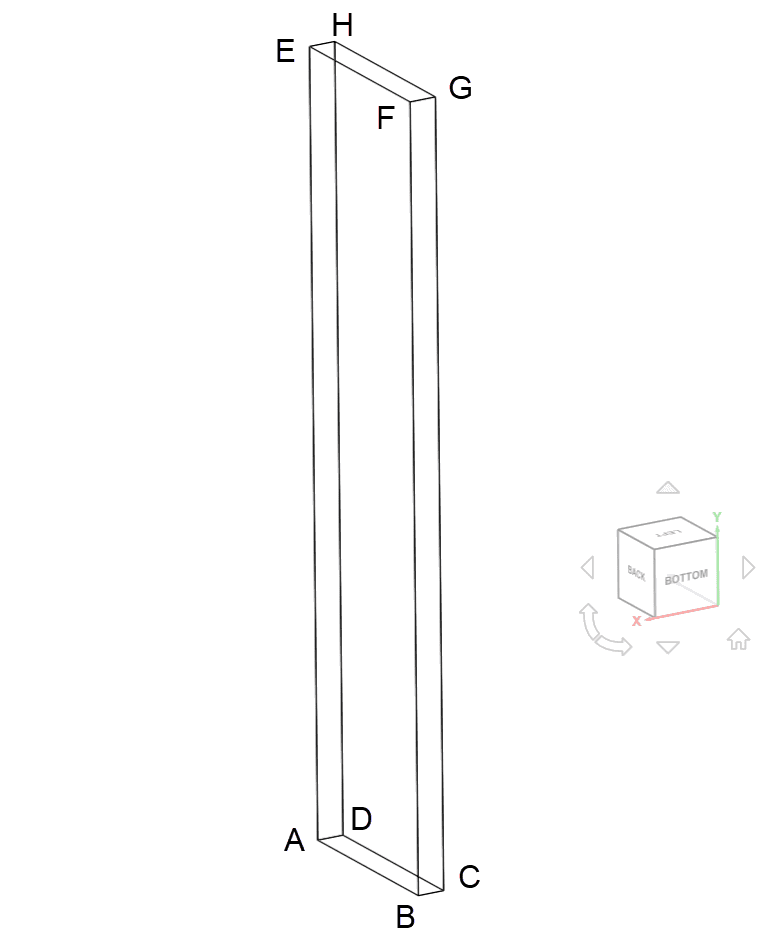
It is basically a rectangular block with dimensions 0.076 \(m\ \times \) 2.18 \(m\ \times \) 0.52 \(m \).
Tool Type: OpenFOAM®
Analysis Type: Steady-state, incompressible, Convective heat transfer
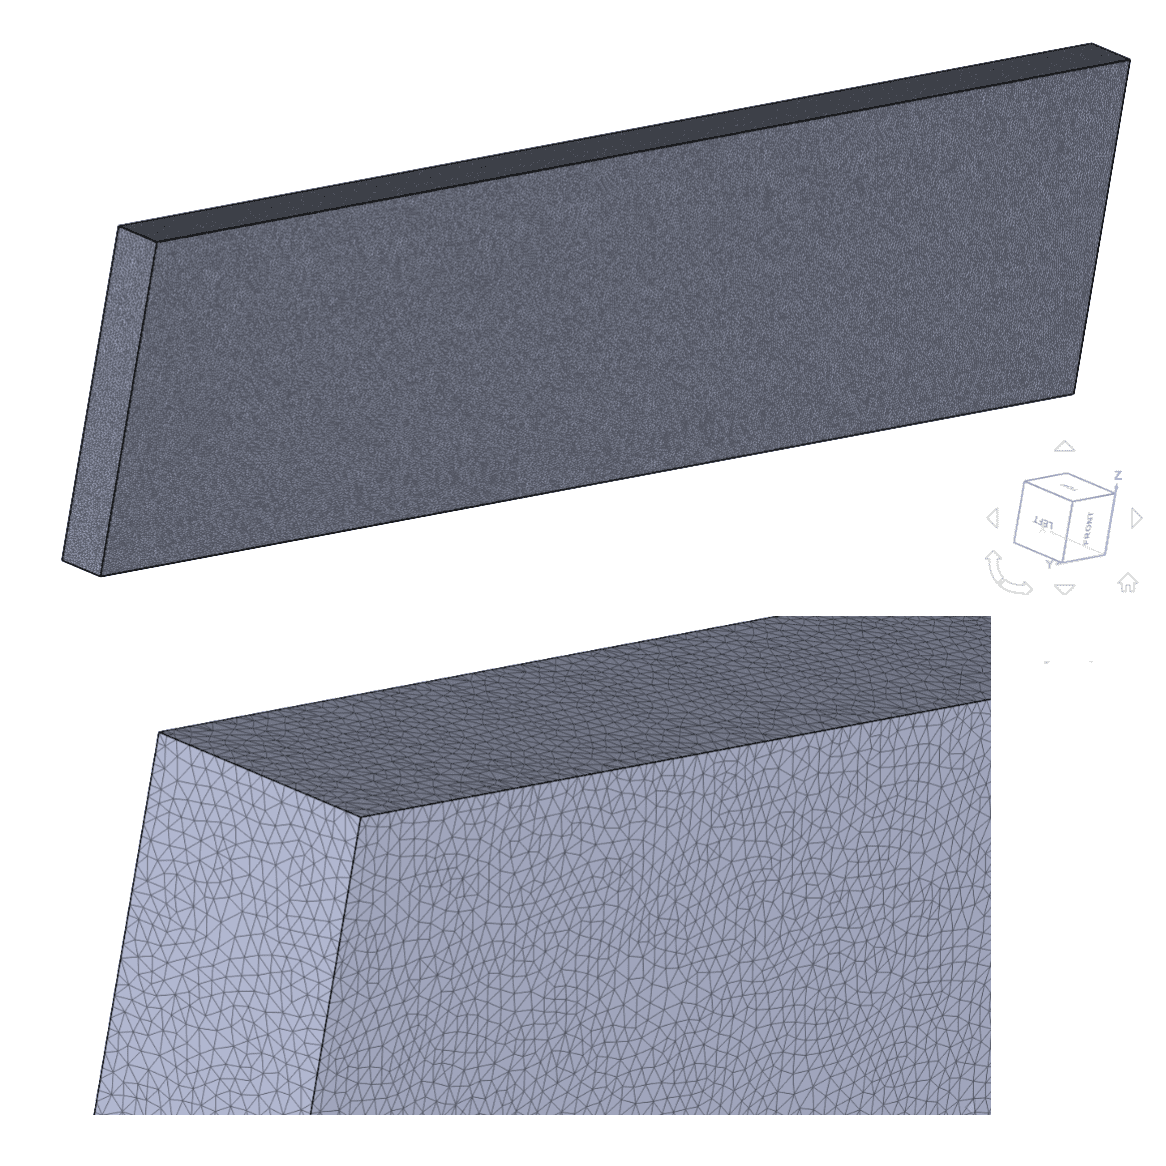
Mesh and Element Types:
SimScale’s Standard algorithm was used for the creation of this mesh :
Fluid:
Boundary Conditions:
Initial Conditions:
Model:
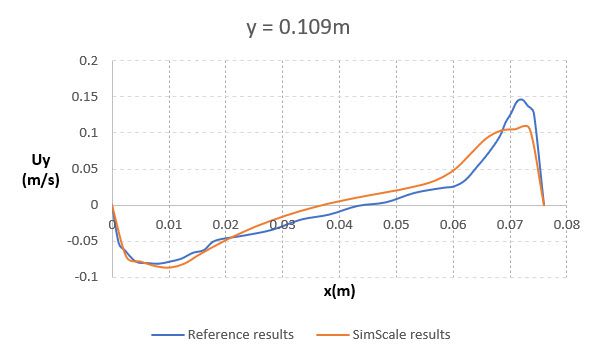
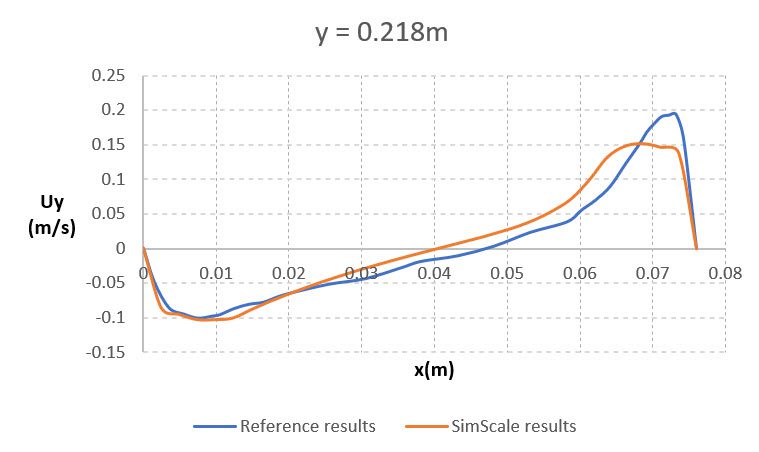
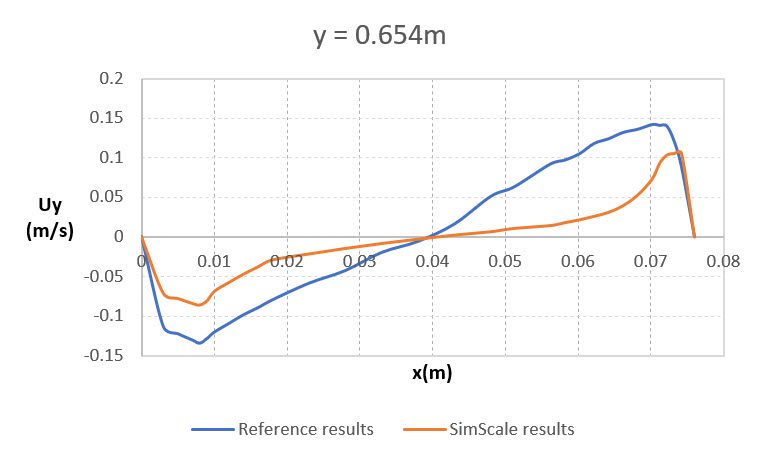
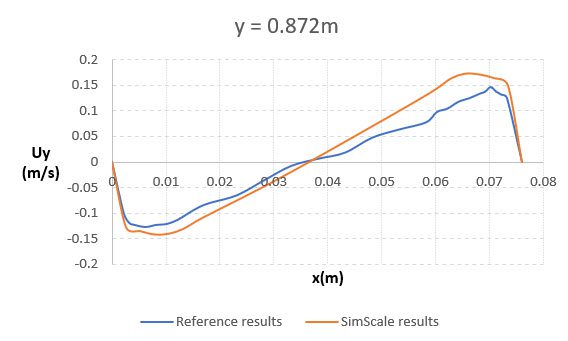
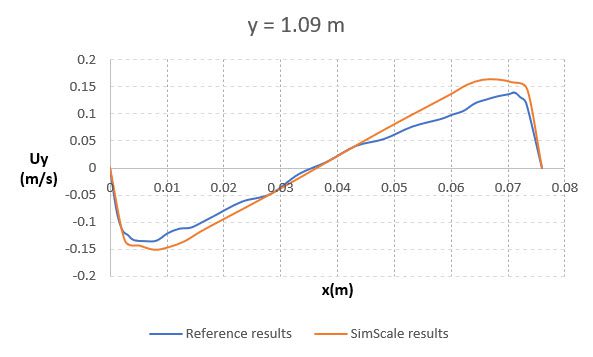
In the graphs below the velocity profile data that is parallel to the plates, \((U_y)\), extracted with ParaView, is plotted against the experimental findings \(^1\) at different heights. The reference lines are located at the mid-plane normal to the z-direction:
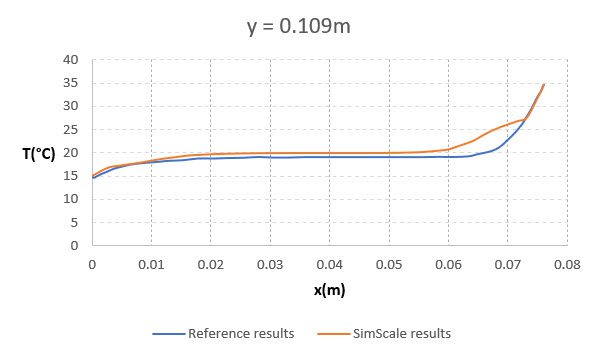
Shown below is the comparison of the temperature profile between the two plates obtained from SimScale simulation results with the reference paper \(^1\) at a height of 0.109 \(m\) . The reference line is located at the mid-plane normal to the z-direction:
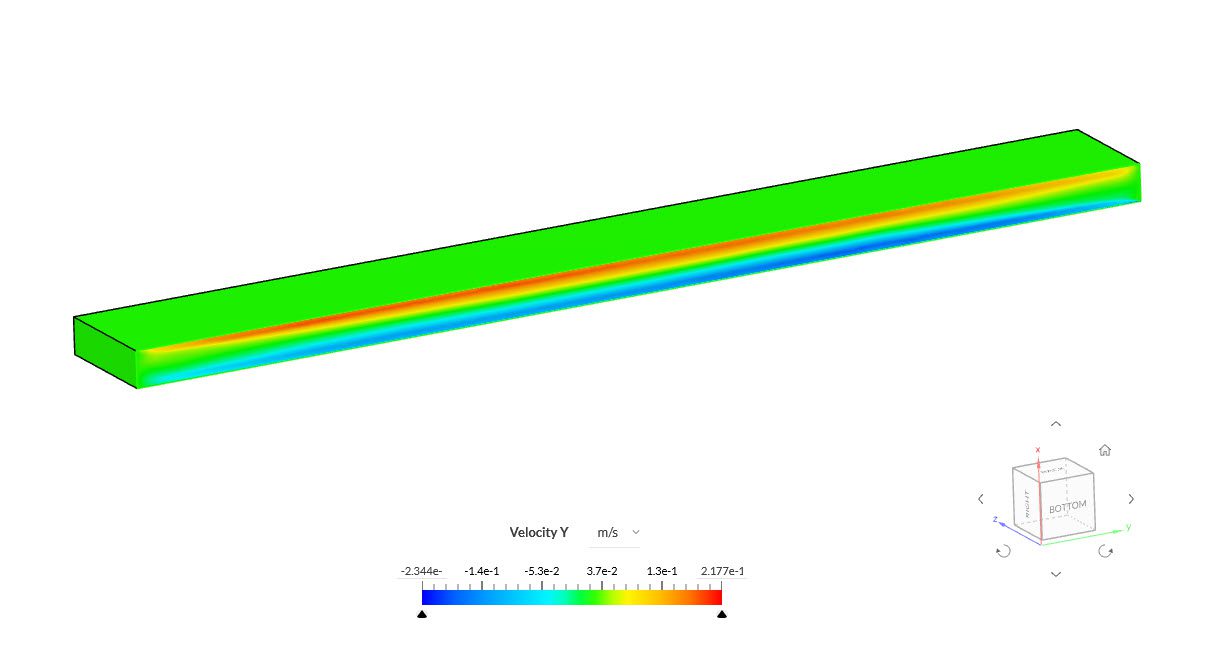
The \(U_y\) distribution mid-plane normal to the z-direction can be seen in the following figure:
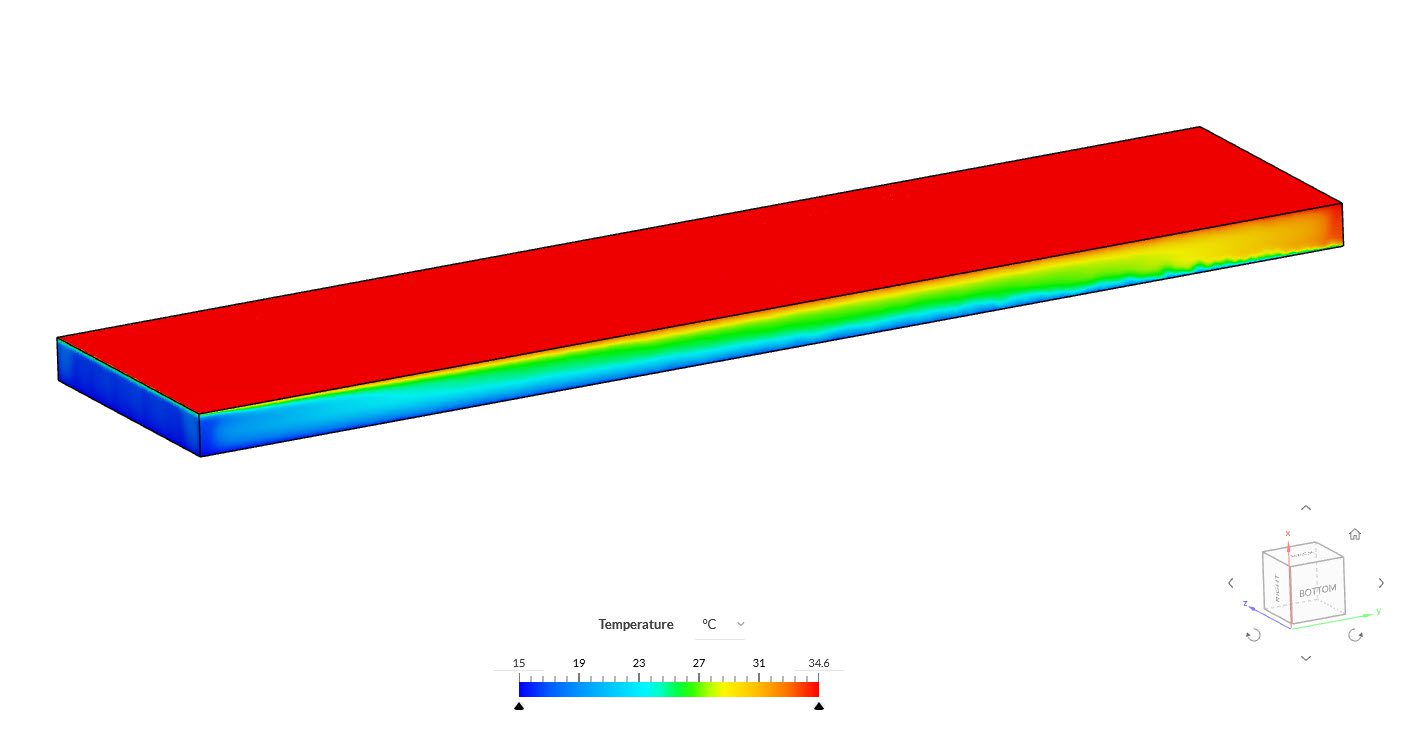
On the same plane, the temperature is also visualized:
All results are in good agreement with the reference.
References
Last updated: July 18th, 2022
We appreciate and value your feedback.
Sign up for SimScale
and start simulating now