Post-Processing
There are several ways for post-processing the resulting data from a SimScale simulation run, to analyze and extract the relevant information. Among them we can find:
- Plots generated from result control items
- Tables and plots for specific result outputs, such as frequency analysis or wind comfort
- Graphical post-processing for 3D visualization of simulation results
- Downloading of result database for local post-processing
The result data from a simulation can be accessed by expanding the tree item for the simulation run. The available data differs from case to case and depends on the type of simulation and the specified result control items. Here is an example tree:
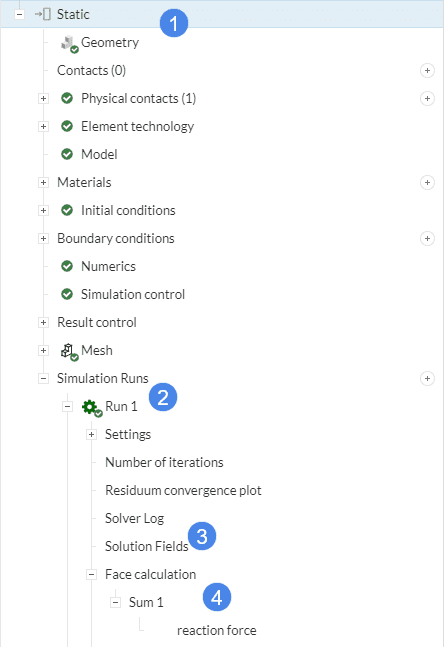
- Root of the simulation, in this case called analysis type Static.
- Simulation runs, in this case a successful computation Run 1.
- The 3D graphical post-processor is accessed with the Solution Fields item.
- A result control item is identified by its type, for example, Face calculation, then by Sum 1 and finally reaction force.
Result Control Items
If the simulation setup includes Result Control Items, corresponding tree items will be included under the simulation run. Such items allow visualization and download of the data sets. Here is an example with a Face calculation and the correspondingly generated plot (refer to Figure 1):
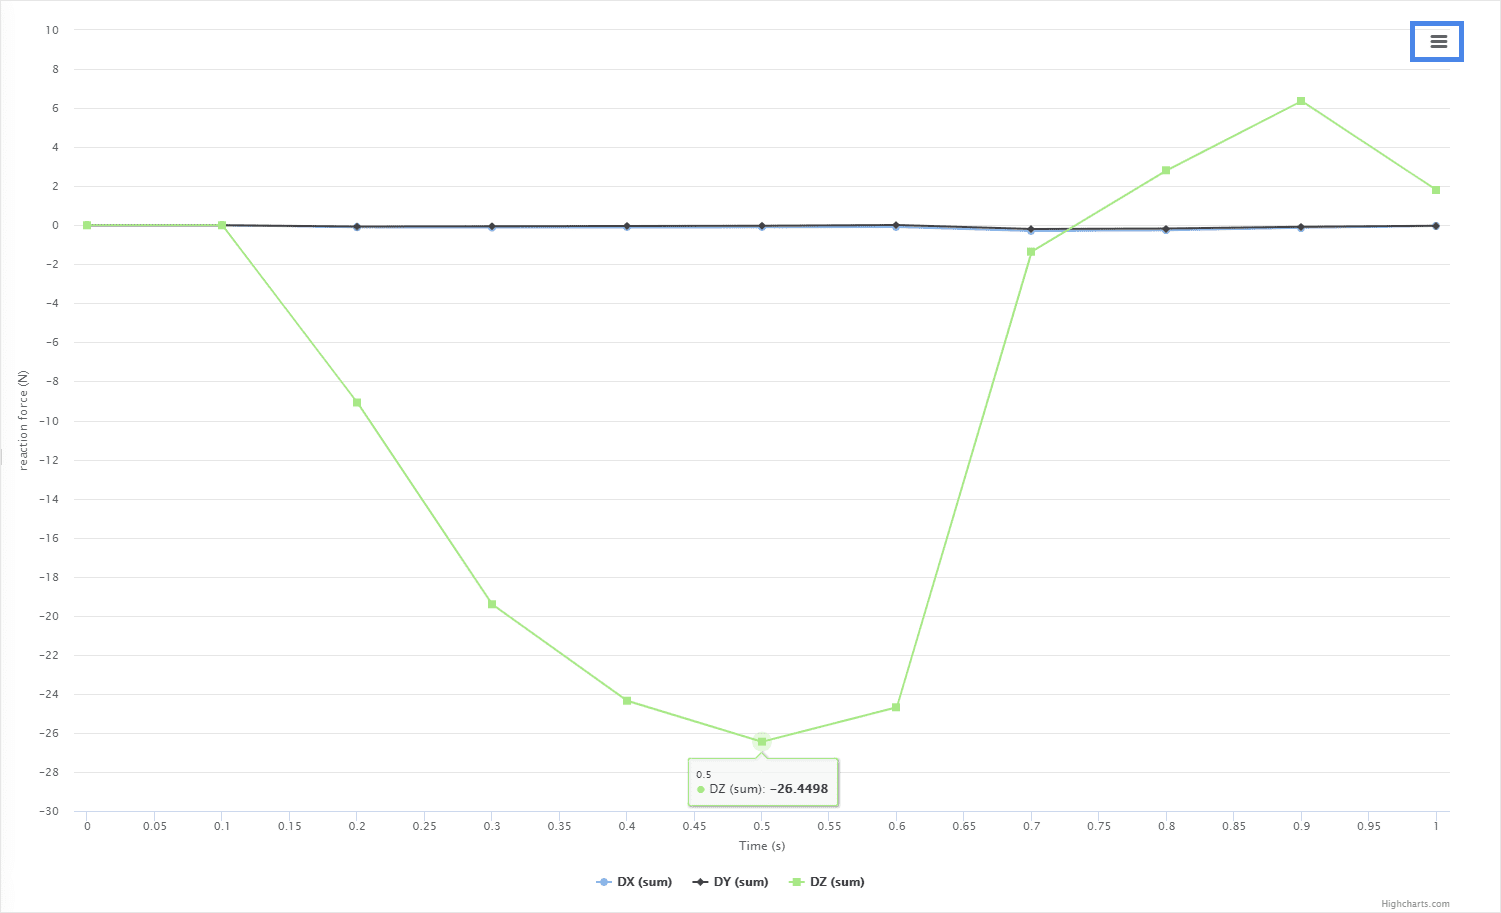
The data plot can be seen in Figure 2, with functionality such as curve hover to probe. Also, the menu button highlighted at the top-right allows downloading the data in different formats, for local plotting and processing.
Tables and Plots
For some types of simulations, special result data is presented to the user. Especially, for Frequency Analysis simulations, table and plot results can be found:
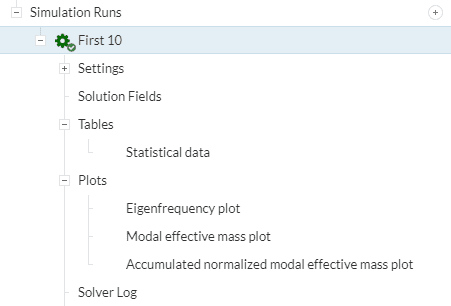
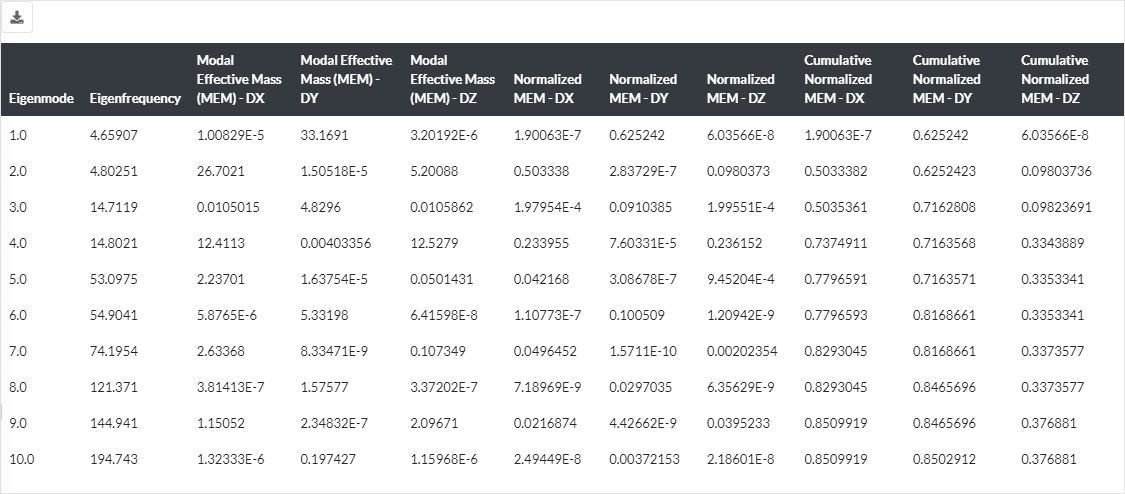
By opening the corresponding items, we can retrieve, visualize and download the resulting data. For instance, here is the resulting table with the frequency data:
3D Online Post-Processing in SimScale
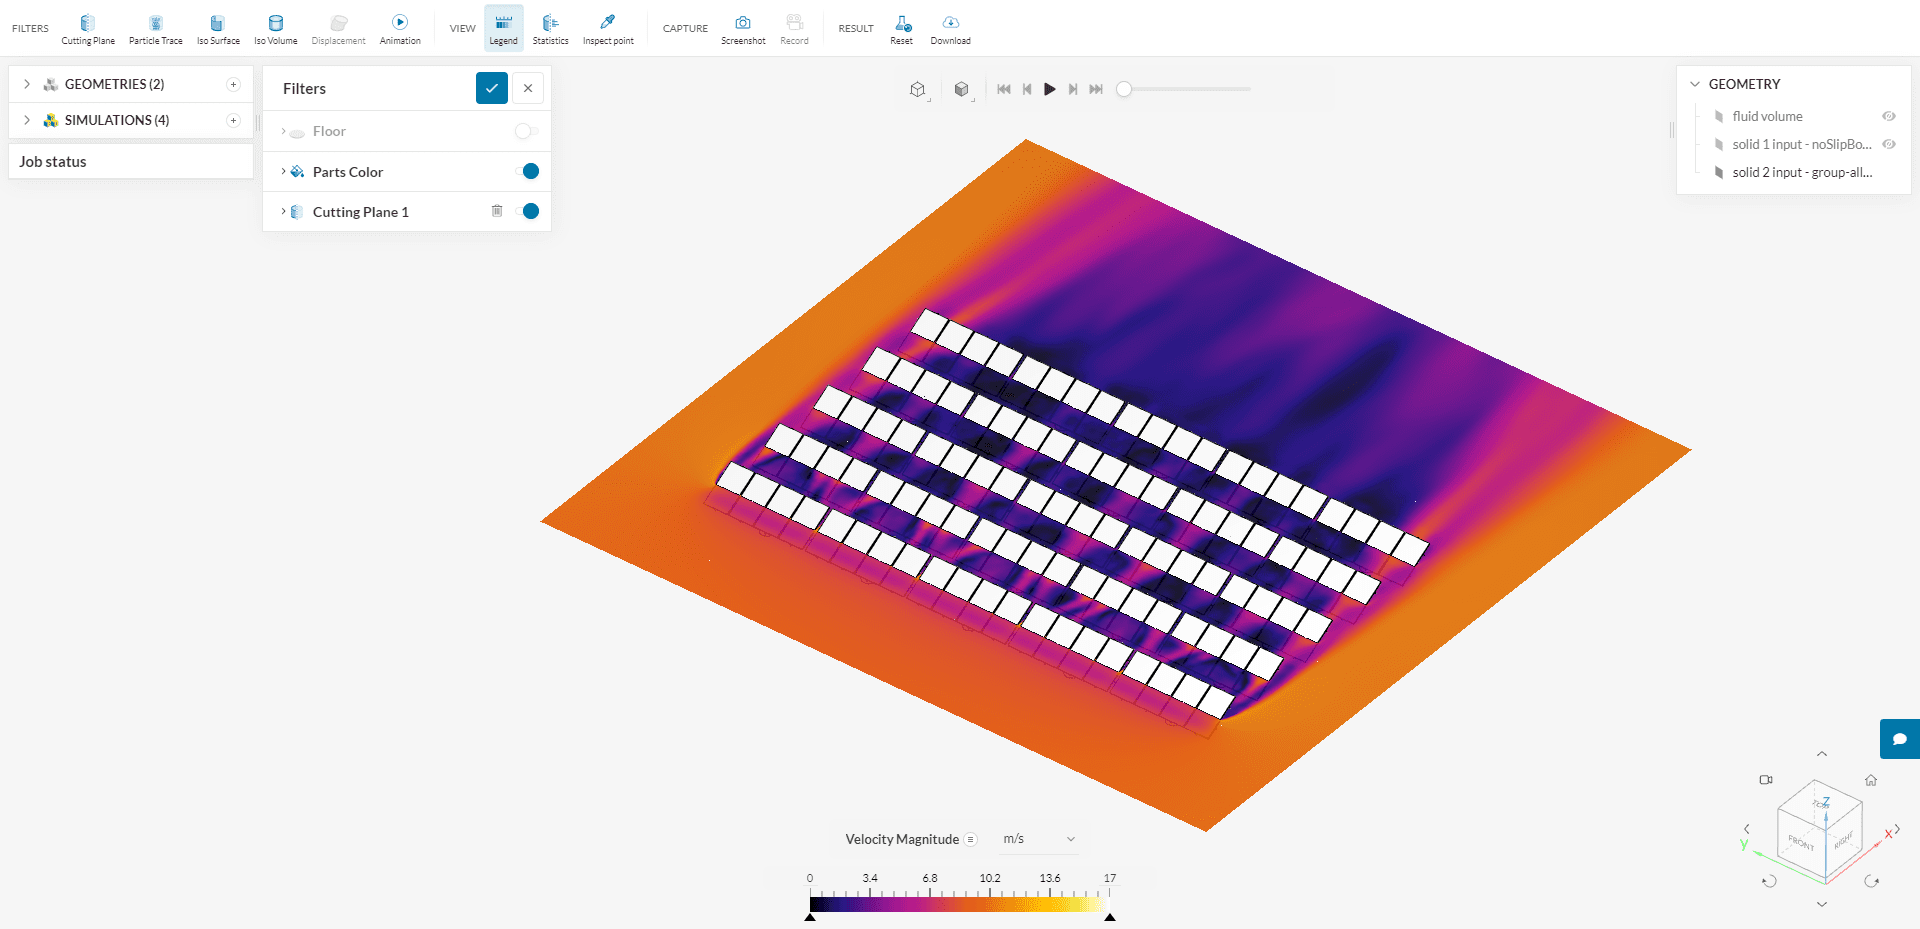
SimScale has its own integrated post-processor. This stellar post-processing tool offers 3D visualization of the result fields. With it, the data requested in the Result Fields, can be plotted in different ways over the geometrical model. Some example possibilities are:
- Deformation shape for structural simulations,
- Pressure contour plots coloring parts and flow regions for CFD simulations,
- Velocity vectors over cut planes,
- Flow particle tracing,
- Temperature contour for thermal simulations,
- Animations of different types of results,
and many other possibilities.
To get a hold of the features of this integrated platform, please visit the following page:
For reference, SimScale’s integrated Post-processor is based on Ceetron’s technology.
Local Post-Processing
If you need to perform post-processing with a specific software, the database from the simulation run results can be exported and downloaded. The files obtained this way can be opened in a program such as ParaView (a step-by-step procedure be found here).
The formats for the result files depend on the type of simulation and the physics of simulation used, as specified in the table below:
| Physics | Analysis Type | Result Format |
|---|---|---|
| Fluid Mechanics and Heat transfer | Incompressible Compressible Convective Heat Transfer Conjugate Heat Transfer Conjugate Heat Transfer (IBM) Multiphase | .foam folder |
| Structural Mechanics | Static Dynamic Frequency Analysis Harmonic Heat Transfer Thermomechanical Nonlinear Mechanical (Marc) | VTM folder |
| Fluid Mechanics and Heat Transfer | Incompressible LBM | EnsightGold .case |
| Pedestrian Wind Comfort | VTM folder | |
| Electromagnetics | Electromagnetics | VTM folder |
Last updated: June 10th, 2025
Did this article solve your issue?
How can we do better?
We appreciate and value your feedback.
What's Next
Integrated Post-Processorpart of: Post-Processing


