Most heat pump simulation software calculates seasonal performance from the outdoor air temperature in a weather file. On a real site, the air reaching the evaporator can be a few kelvin colder, because the unit draws in part of its own cold discharge air or its neighbor’s. A 3 K drop in intake temperature costs roughly 7% of COP by ideal-cycle estimate. A system model can’t detect it, because it doesn’t model the airflow around the unit.
Heat pumps on rooftops, in courtyards, in plant compounds or inside acoustic enclosures need two kinds of simulation. A system model sizes the plant and predicts seasonal performance. 3D CFD checks the air that the system model assumes, around the unit and inside the heated space.

What heat pump simulation software covers
Heat pump simulation software falls into three classes. They differ in what each one takes as a fixed input. A system model takes the air temperature at the coil as given and calculates energy. A 3D CFD model takes the heat pump’s performance as given and calculates where the air goes.
| Class | What it predicts | Typical tools | What it assumes |
|---|---|---|---|
| System and building energy models | Sizing, bivalent point, seasonal performance (SPF, SCOP, HSPF), energy use, running cost | GeoT*SOL, Polysun, TRNSYS, EnergyPlus | Air at the evaporator equals the weather-file temperature. Room air is fully mixed. |
| Refrigerant cycle and component models | Cycle COP and capacity, compressor, valve and heat exchanger matching | Modelica-based tools such as Modelon Impact | Air is evenly distributed across the coil face. |
| 3D CFD and conjugate heat transfer | Air velocity, temperature and pressure fields through the unit, across the site and inside the room | SimScale and other general-purpose CFD tools | Heat pump performance is an input: airflow, heat absorbed or rejected, fan curve. |
Most projects need more than one class. A seasonal performance factor depends on 8,760 hours of weather and load data, which only a system model can run. The air temperature at the coil of one unit, on one roof, in one wind direction, needs CFD.
What system models get right, and what they assume
System models are the right tool for sizing, bivalent point selection and seasonal performance, because those answers depend on a full year of weather and load. GeoT*SOL, Polysun, TRNSYS and EnergyPlus run that year at hourly or shorter time steps.
Their heat pump models come from manufacturer performance data. That data is measured in test chambers at standard rating points such as A7/W35 and A2/W35 under EN 14511, with the unit drawing air at a controlled temperature. The system model then assumes the same conditions on site: the evaporator sees the weather-file temperature, and the heated room is fully mixed.
Those assumptions hold for a single unit in open air with the manufacturer’s clearances met. They stop holding when:
- Several units sit close together in an array or plant compound.
- Units are on a roof with parapets, or in a courtyard, light well or acoustic enclosure.
- A building upstream of the units changes the wind around them.
- The heated space is large or tall, or uses low-temperature emitters where air movement decides comfort.
How much intake air temperature changes COP
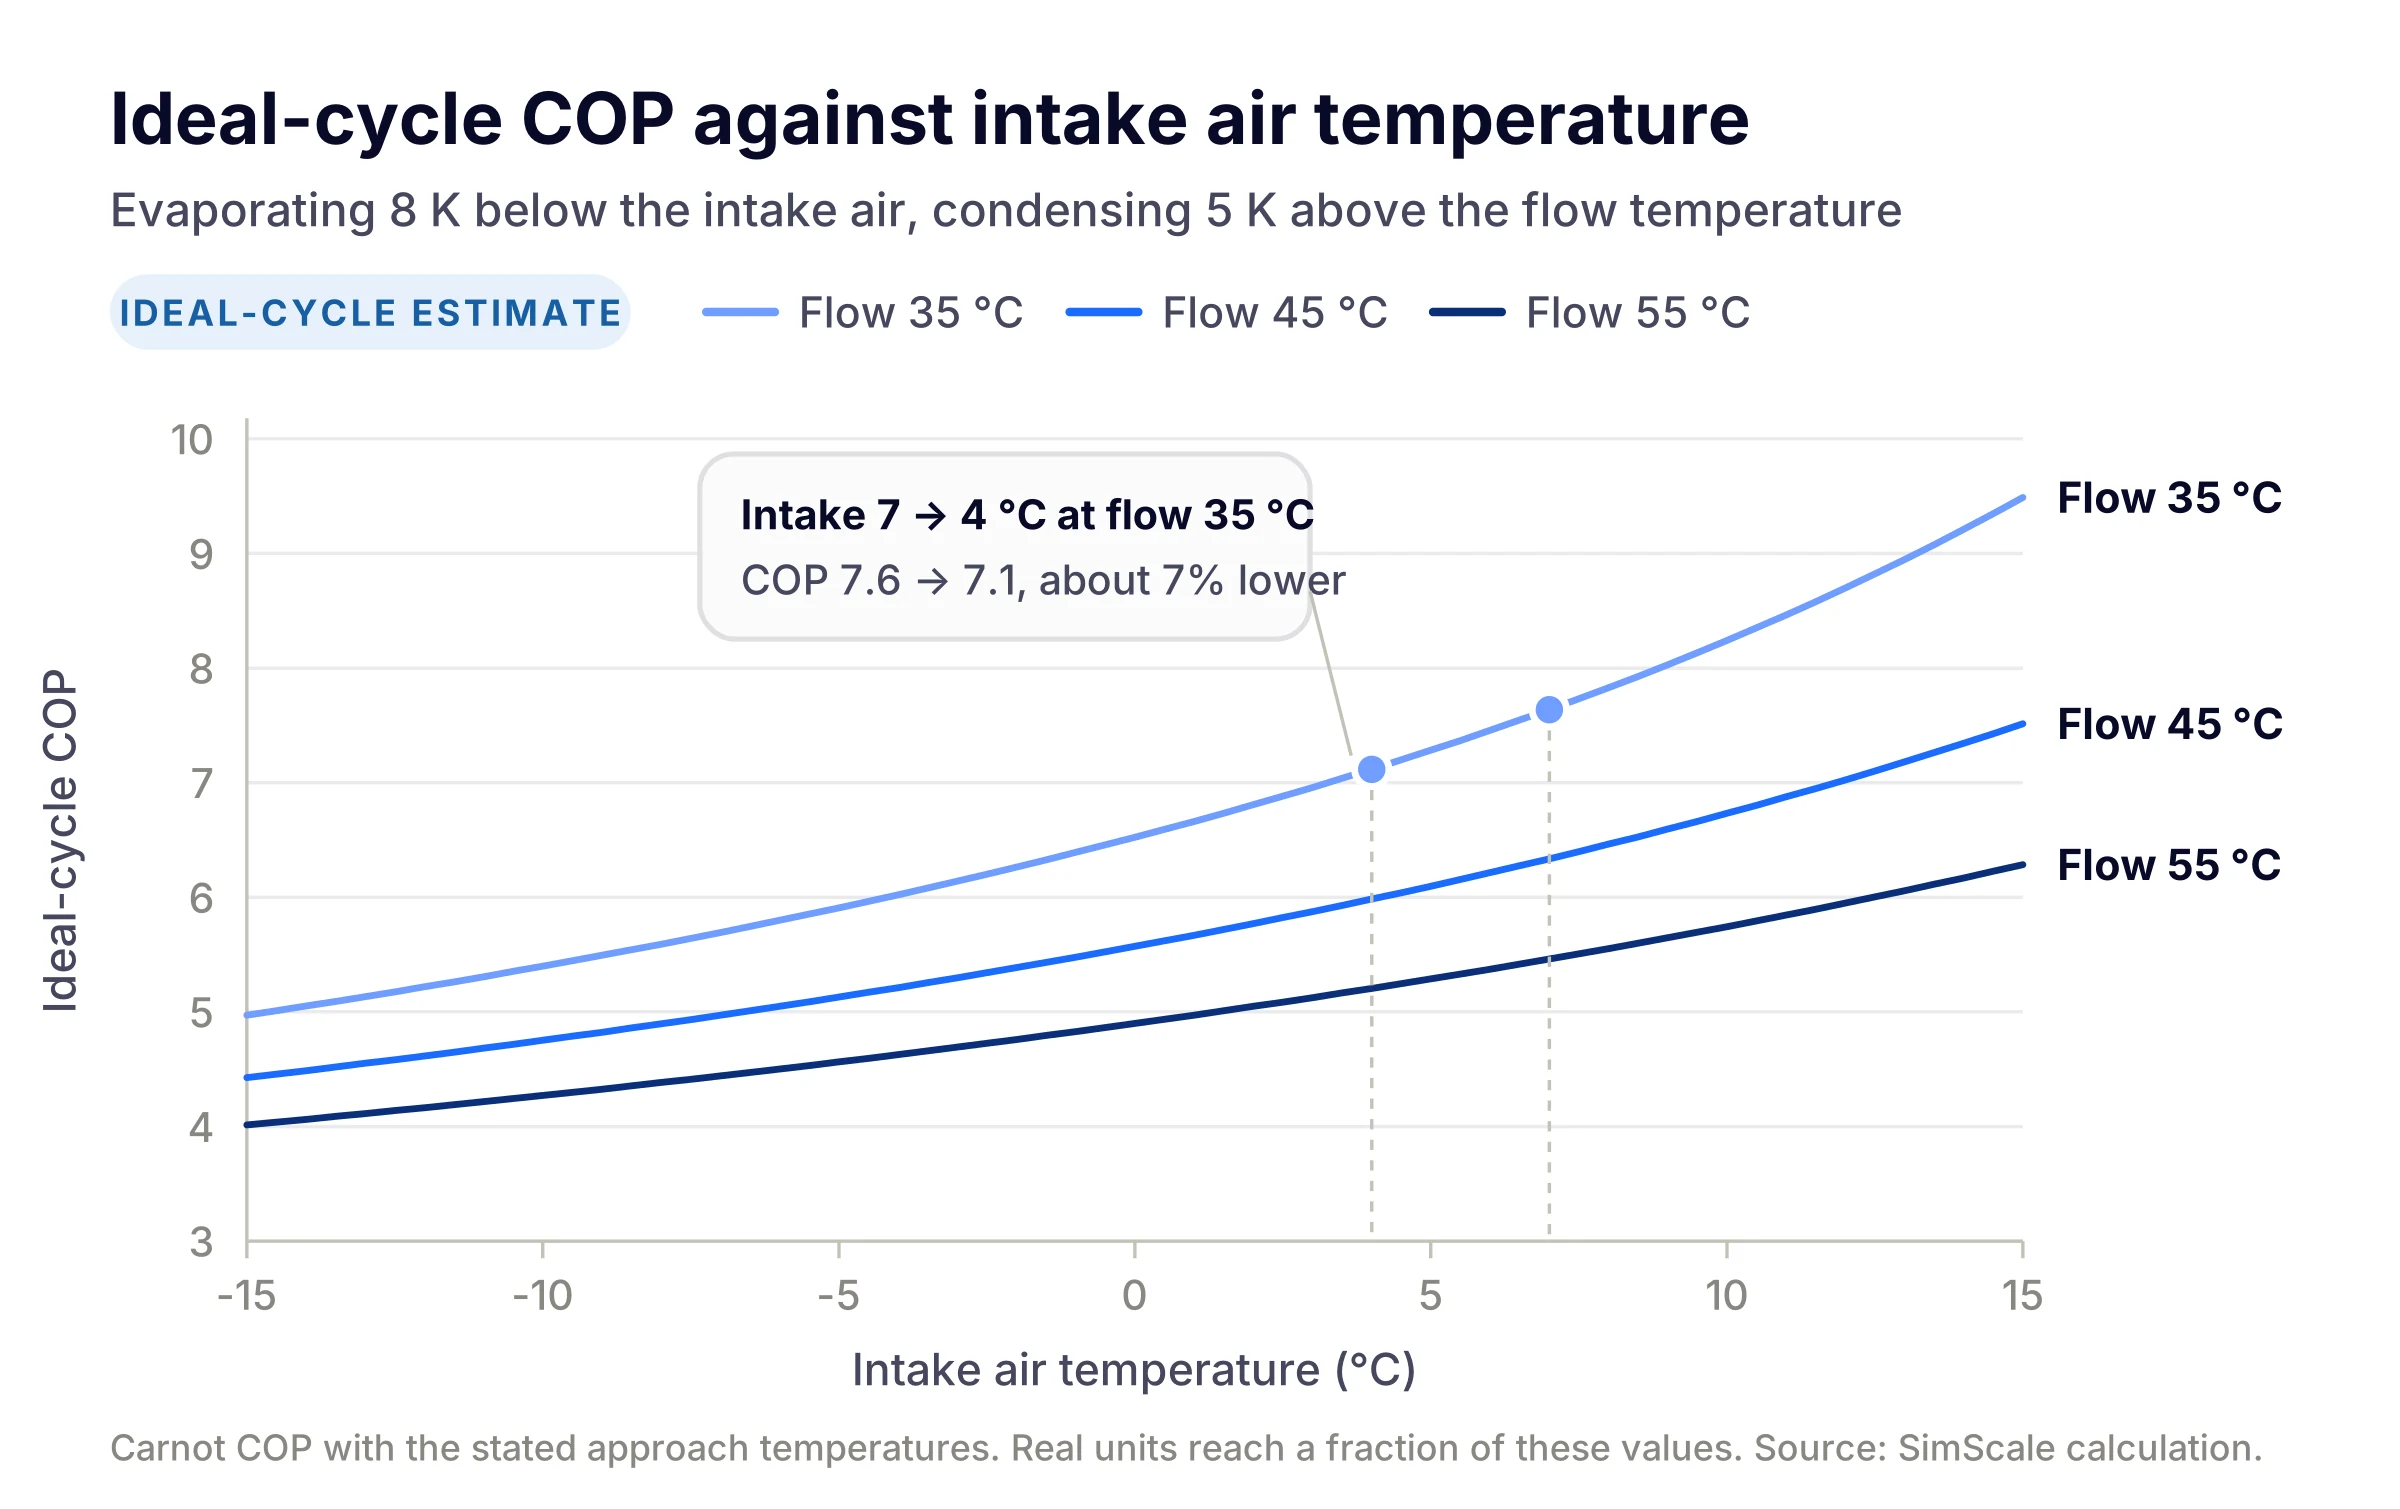
Each kelvin of intake cooling costs roughly 2% of COP at typical air-to-water operating points. The ideal-cycle (Carnot) COP shows where the number comes from:
$$ COP_{Carnot} = \frac{T_{cond}}{T_{cond} – T_{evap}} $$
Both temperatures are in kelvin. Take an A7/W35 operating point, and assume the refrigerant evaporates 8 K below the intake air and condenses 5 K above the flow temperature. If recirculation lowers the intake air from 7 °C to 4 °C, the Carnot COP falls from 7.6 to 7.1. That’s a loss of about 7%.
Real machines reach only a fraction of the Carnot value, but the ratio gives the direction and approximate size of the effect. Heating capacity falls too, because a lower evaporating temperature reduces the refrigerant mass flow through the compressor. A colder intake also brings the coil closer to frosting conditions.
Where 3D CFD answers what system models can’t
3D CFD is the right tool wherever the result depends on where the air goes. That covers three areas: around the installation, through the unit, and inside the heated space.
Installation siting and cold air recirculation
Air-source heat pumps placed near buildings, parapets or other units can draw part of their own discharge air back in. The discharge is several kelvin colder than ambient, and cold air is denser, so the plume sinks unless wind or fan momentum carries it away. Obstructions that slow or turn the wind make the plume more likely to reach the intakes.
This happens on open sites too. Rogié et al. (2020) modeled a 5 MW district-heating heat pump in Brædstrup, Denmark, with 20 evaporators in a row. They found recirculation for every wind direction they tested, caused by turbulence around the evaporators. Placing a building directly upstream of the evaporators increased it.
A siting study tests heat pump placement before installation and gives you:
- Intake air temperature and recirculation fraction for each unit.
- Plume length, position and temperature.
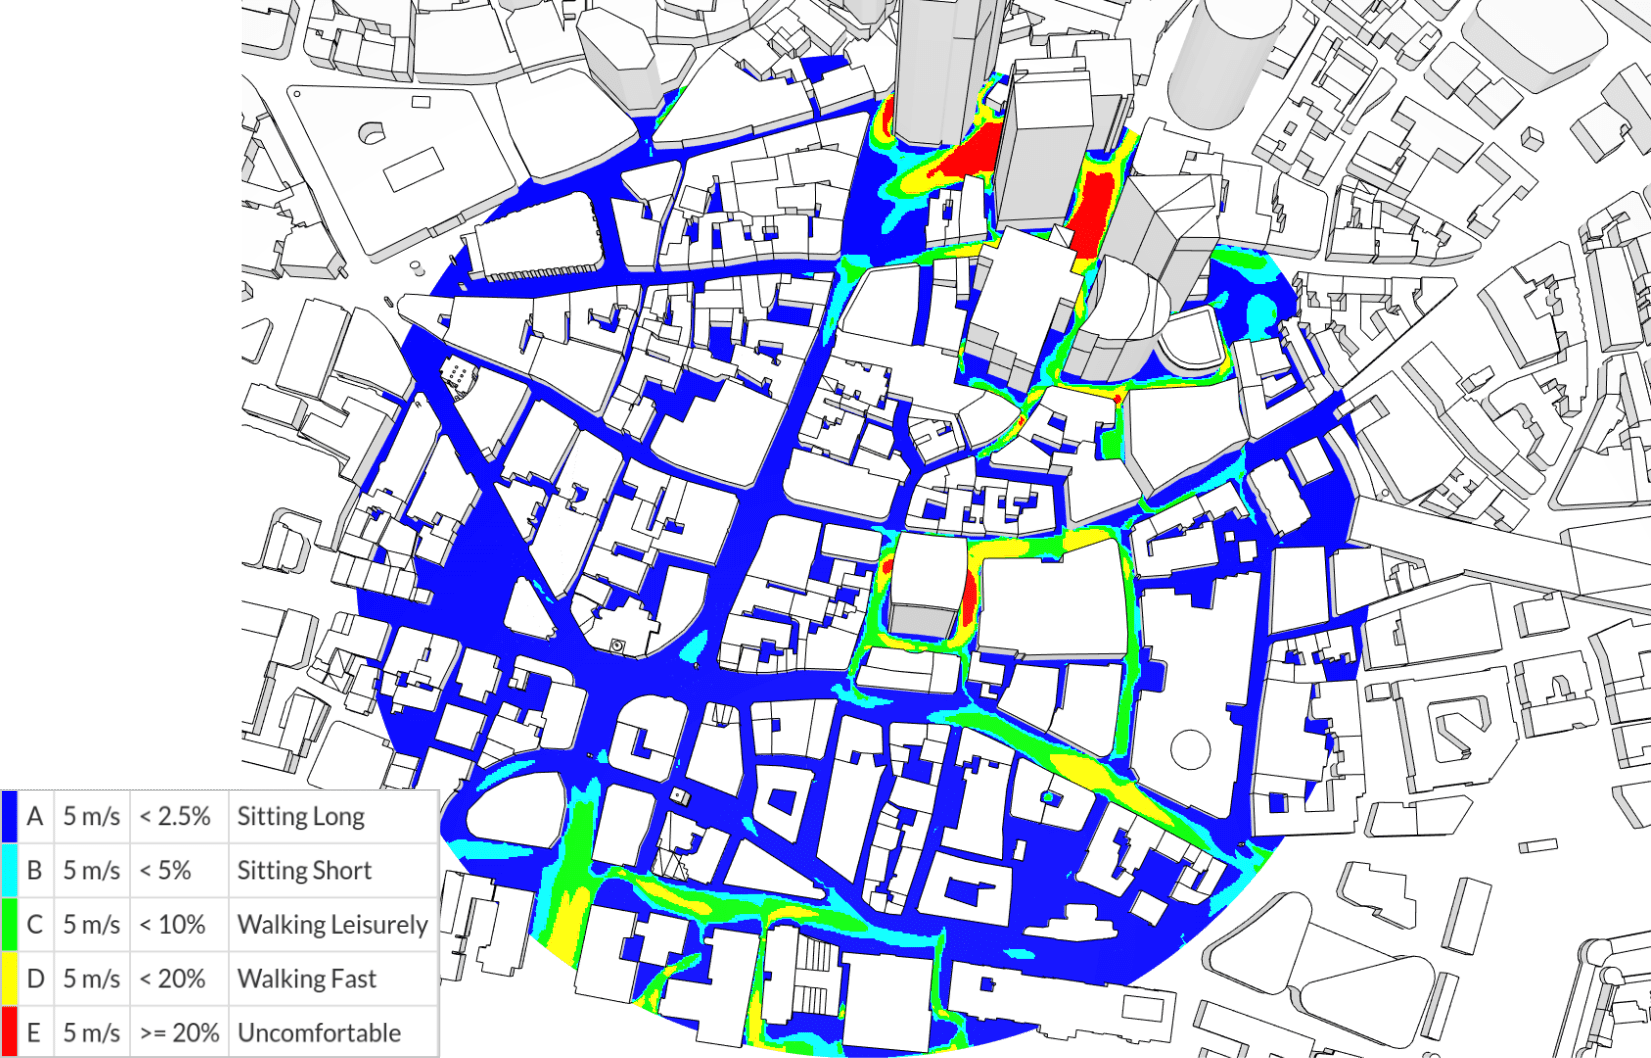
- Air temperature at pedestrian level and at neighboring windows and openings.
- Static pressure at each intake and discharge, checked against the fan’s operating range.
The pressure check matters for noise as well as airflow. As the Element Design case study puts it, “A greater pressure differential means louder fans.” SimScale’s urban microclimate simulation covers air-source heat pump dispersion on city-scale models.

Heat pump design: coil airflow, fans and electronics cooling
For manufacturers, CFD answers unit-level questions that a cycle model treats as uniform. Air velocity across the evaporator coil face depends on fan position, shroud geometry and the casing. The parts of the coil that see less air contribute less capacity. Heat pump design software at the cycle level can’t show this, because it doesn’t model where the air goes inside the casing.
Typical unit-level studies:
- Coil face velocity distribution and the pressure drop the fan has to overcome. See heat exchanger simulation.
- Fan operating point inside the casing, using the manufacturer’s fan curve. See fan simulation.
- Cooling of the inverter drive and compressor compartment, using conjugate heat transfer (CHT) across the electronics, heat sinks and air.
- Discharge air pattern, which sets the minimum clearances you publish to installers.
Indoor side: low-temperature emitters and thermal comfort
Low-temperature emitters make indoor comfort depend on air movement and the vertical temperature difference between floor and ceiling. Heat pumps use these emitters because they run most efficiently at low flow temperatures. A zone model averages both effects out. CFD resolves them and reports comfort as PMV and PPD against ASHRAE 55 and ISO 7730, using SimScale’s thermal comfort parameters.
Fusion Modulair, whose modular HVAC units include reverse-cycle heat pump capability, combined both kinds of tool on a 55,000 m² warehouse. An IES-VE thermal model supplied annual surface temperatures to the CFD. That model “assumes a completely uniform and homogenous air distribution throughout the entire occupied space.” SimScale CFD of the mechanical ventilation scenario showed airflow eddies of up to 6.7 m/s in some locations. The case study notes that thermal modeling software is generally limited to 1 m/s for PMV and PPD assessment. The 47 million-cell model returned results in 10 hours.
How to use system models and CFD together
Run the system model first to size the plant and select the units. Then use CFD to check the air assumptions the system model made, and feed the corrected values back into it.
- Size and select with the system model. Use weather data and the load profile to choose capacity, bivalent point and unit count.
- Model the site or the room in 3D. Run the design condition and the wind directions most likely to cause recirculation, including any direction that puts a building upstream of the units.
- Calculate the recirculation fraction for each unit. This is the same metric Rogié et al. use, rearranged:
$$ \varphi = \frac{T_\infty – T_{in}}{T_\infty – T_{out}} $$
Here \( T_\infty \) is ambient air temperature, \( T_{in} \) is the area-averaged intake temperature and \( T_{out} \) is the discharge temperature. \( \varphi = 0 \) means the intake sees ambient air. \( \varphi = 1 \) means the unit takes in only discharge air.
- Correct the system model. Replace the source temperature with \( T_{in} \), or apply a COP and capacity correction from the manufacturer’s performance map, and rerun the seasonal calculation.
- Change the layout if \( \varphi \) is too high, then repeat step 2. Typical changes are wider spacing, a higher discharge, ducted discharge, a more porous screen or a different roof position.
Fusion Modulair worked in the other direction: the annual thermal model fed boundary conditions into the CFD. Both directions work. What matters is that each tool covers the quantity the other one assumes.
How to set up a heat pump siting simulation in SimScale
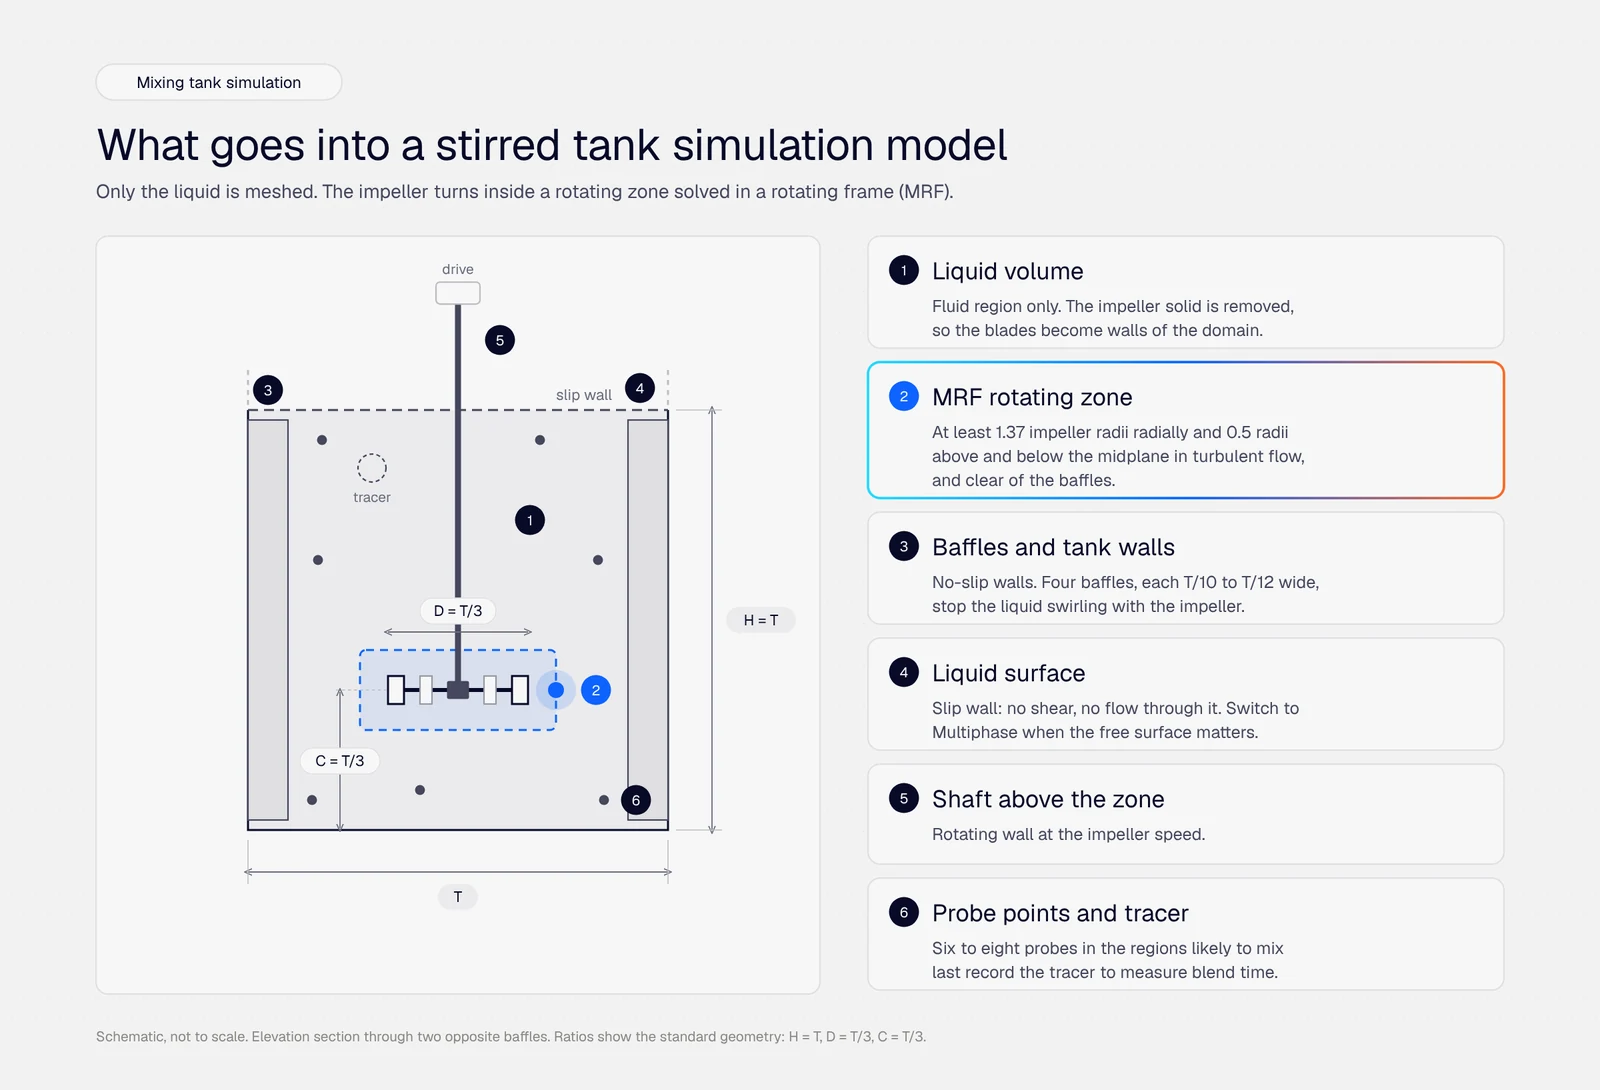
A heat pump siting study in SimScale models each unit as a simplified box with a fixed temperature drop, applies wind from an atmospheric boundary layer profile, and solves with gravity switched on so buoyancy is resolved. This follows the approach used in published air-source heat pump siting studies.
- Build the site model. Include the buildings that can affect flow around the units, and model each unit as a box with separate intake and discharge faces. Fins, tubes and fan blades aren’t needed at site scale. Size the domain following urban CFD best practice (Franke et al., COST Action 732): at least 5H above and beside the tallest building of height H, 15H downstream, and a blockage ratio below 3%.
- Choose the analysis type. Use convective heat transfer with gravity enabled. If you need humidity at the intakes, use conjugate heat transfer with relative humidity modeling switched on.
- Set the wind. Apply an atmospheric boundary layer profile at the inlet, with ambient temperature at the design condition. Set up one simulation per wind direction and run them in parallel. Cover the prevailing directions and any direction that puts a building upstream of the units.
- Define the heat pump boundary conditions. Set the discharge face as an inlet at \( T_\infty – \Delta T \), and the intake face as an outlet with the same volumetric flow. Alternatively, use the fan boundary condition with the manufacturer’s fan curve, so the solver finds the operating point under the pressures on site. Derive \( \Delta T \) from the data sheet:
$$ \Delta T = \frac{\dot{Q}_{heat}\,(1 – 1/COP)}{\rho\, c_p\, \dot{V}} $$
Take an illustrative unit that delivers 50 kW at a COP of 3.0 with 4.0 m³/s of airflow. The evaporator absorbs 33 kW, and the air cools by about 6.5 K. This counts sensible heat only. When moisture condenses on the coil, part of the 33 kW is latent and the real temperature drop is smaller. The estimate overstates the cooling, which gives a conservative intake temperature.
If you model airflow through the casing, represent the coil as a porous medium using the pressure loss curve from the manufacturer’s data. Place at least 5 mesh cells across its thickness.
- Add a tracer. Place a passive scalar source at the discharge faces. The concentration at each intake, normalized by the discharge concentration, gives the share of discharge air that returns. It’s an independent check on the temperature-based \( \varphi \).
- Set up result outputs. Add area averages of temperature, passive scalar and pressure on every intake and discharge face. Add a plane or probe points 1.5 m above ground for pedestrian-level temperature. Check convergence on the intake temperature monitors as well as the residuals.
For a guided walkthrough, watch the on-demand demo Verifying the Thermal Performance of Heat Pumps Using CFD. It sets up a thermal analysis of a heat pump using performance data supplied by the manufacturer.
Example: siting a heat pump array at Greenwich Peninsula
Element Design and JG Engineers used SimScale CFD to secure planning approval for a rooftop air-source heat pump array at the Greenwich Peninsula Energy Center in London. The array will replace gas-fired boilers, and the project is expected to save 90,000 tons of CO2 over its 15-year lifetime.
The team ran a combined thermal and airflow analysis with OpenFOAM in SimScale. It used prevailing wind conditions plus ambient temperature and humidity, and extracted:
- Outlet air velocity and temperature for each heat pump.
- Cold air plume length and location.
- Downdraft onto pedestrian level.
- Pressure drop across the heat pumps.
- Average temperatures at the heat pump inlets and outlets.
The model also included proposed developments nearby, so the assessment covers the buildings that will surround the energy center once they’re built.


Sam Bromley
Founder and Design Lead at Element Design

“As with all ASHP installations in dense urban environments, our job is to ensure good dispersion of rejected cold air into the ambient environment, reduce the risk of air recirculation, and provide confidence in the ASHP’s performance. Using SimScale to simulate these complex urban airflow interactions has been pivotal in proving their performance leading to project success and planning approvals.”
Choosing heat pump simulation software
Pick the tool by the question you need to answer.
| Question | Tool class |
|---|---|
| What capacity, unit count and bivalent point do I need? | System model |
| What seasonal performance and running cost will the plant achieve? | System model |
| Will this compressor, coil and refrigerant reach the rated capacity? | Refrigerant cycle model |
| Will units in this array take in their own discharge air? | 3D CFD |
| Is fan pressure within the operating range at this location? | 3D CFD |
| Will the cold plume reach pedestrians or neighboring windows? | 3D CFD |
| Will low-temperature emitters keep this room within ASHRAE 55 limits? | 3D CFD, with boundary conditions from a zone model |
For the CFD questions, SimScale runs thermal and airflow simulation in the browser on a cloud-native platform, with no local hardware to size.
Frequently asked questions
It depends on the question. For sizing, seasonal performance and running cost, use a system model such as GeoT*SOL, Polysun, TRNSYS or EnergyPlus. For refrigerant cycle and component matching, use a cycle modeling tool. For airflow around the unit, recirculation, plume dispersion and indoor comfort, use 3D CFD.
Not directly in a siting study. CFD predicts the air temperature and flow at the evaporator. You then read COP and capacity from the manufacturer’s performance map at that intake temperature, or pass the intake temperature to a system or cycle model.
Yes. In a CFD study of a 5 MW air-source heat pump with 20 evaporators in Denmark, Rogié et al. (2020) found recirculation for every wind direction modeled, caused by turbulence around the evaporators. A building directly upstream increased it.
Site or room geometry, wind and temperature data for the design condition, and the manufacturer’s data: airflow, heating capacity and COP at the design point, the fan curve, and the coil pressure drop if you model flow through the casing.
CFD shows planners and clients that discharge air disperses, that cold plumes stay clear of pedestrian areas, and that the units can operate at an acceptable COP on the chosen site. Element Design used SimScale CFD to secure planning approval for a rooftop heat pump array at Greenwich Peninsula in London.
Run a heat pump siting study in your browser
Model the site, the units and the wind in SimScale, and check intake temperatures and plume paths before the units are installed.