
Diagnosing pump cavitation normally means reading damage that has already happened.
Pitting on a pulled impeller, a suction gauge reading taken after a year of noise, a head curve that has drifted off the datasheet, a bearing that started running warm: by the time any of these is conclusive, the metal has already gone.
CFD moves the same question to the point where the impeller is still a CAD model and the eye diameter costs nothing to reshape.
On a pump that already exists, that evidence still decides the repair, and the damage location carries most of it:
- Pitting on the suction side of a vane near the eye points to NPSH-driven cavitation.
- Pitting on the pressure side of the same vane points to suction recirculation, and adding NPSH there changes nothing.
Five mechanisms produce the same noise and the same lost head, and re-piping the suction line addresses only one of them.
See cavitation before your pump does
Run a cavitation-enabled CFD study on your own impeller in the browser. No HPC headaches, no install.
What cavitation does to a pump
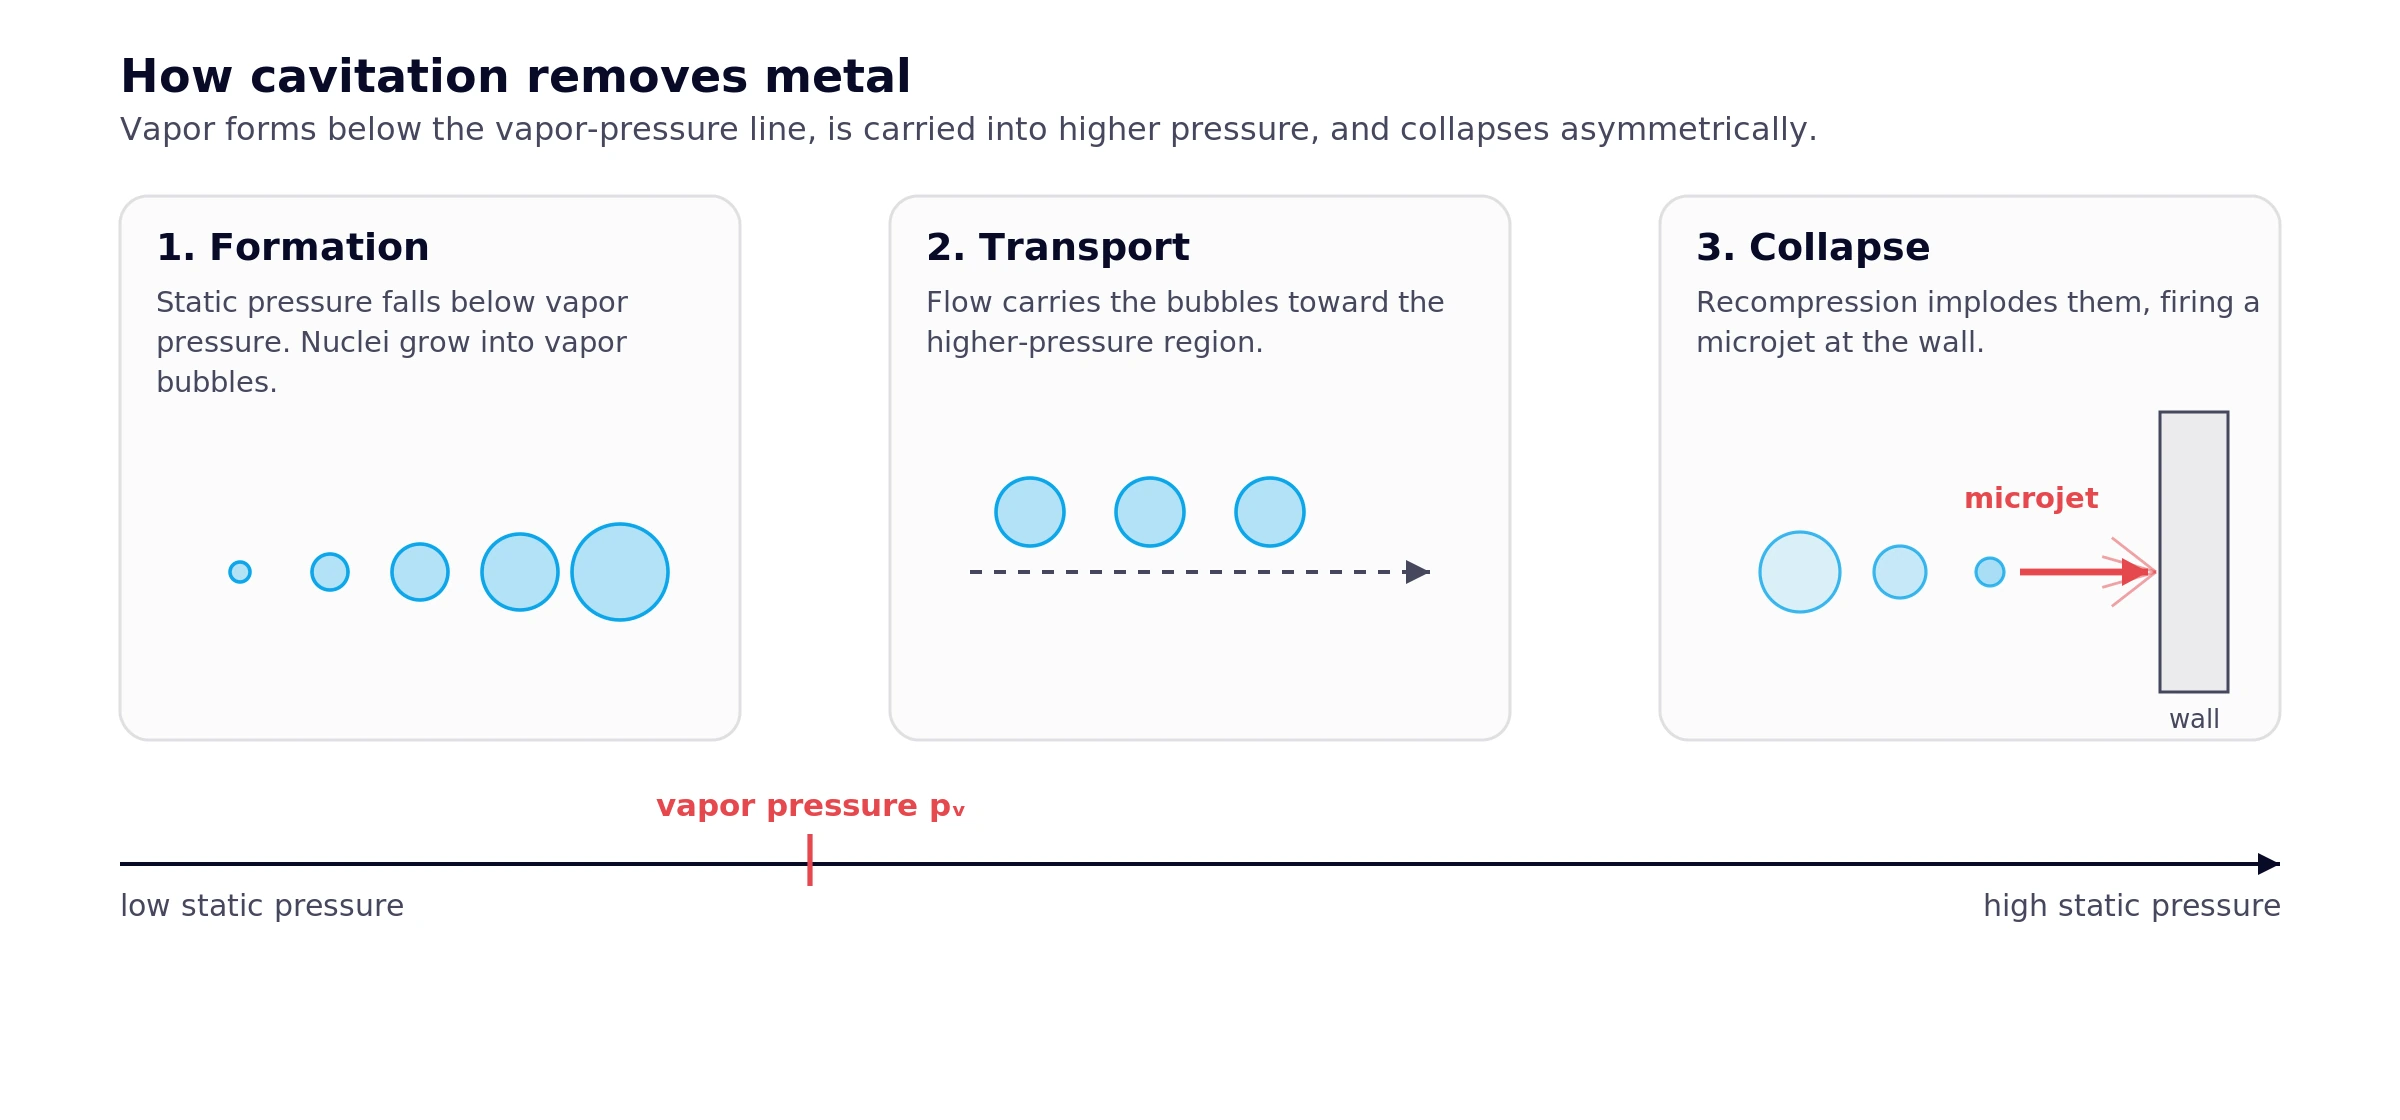
Cavitation affects a pump in several ways at once. Each bubble collapse drives a jet of liquid into the nearest surface at 1 to 2 GPa, several times the yield strength of a stainless impeller. Vapor also occupies part of the flow passage, so head and efficiency fall. Uneven bubble collapse loads the impeller asymmetrically, which pushes vibration into the bearings and seals. Power draw rises to hold throughput, and over time the pitting develops into cracks.
The five ways a pump cavitates
Each mechanism leaves damage in a different place, which makes damage location the cheapest diagnostic available.
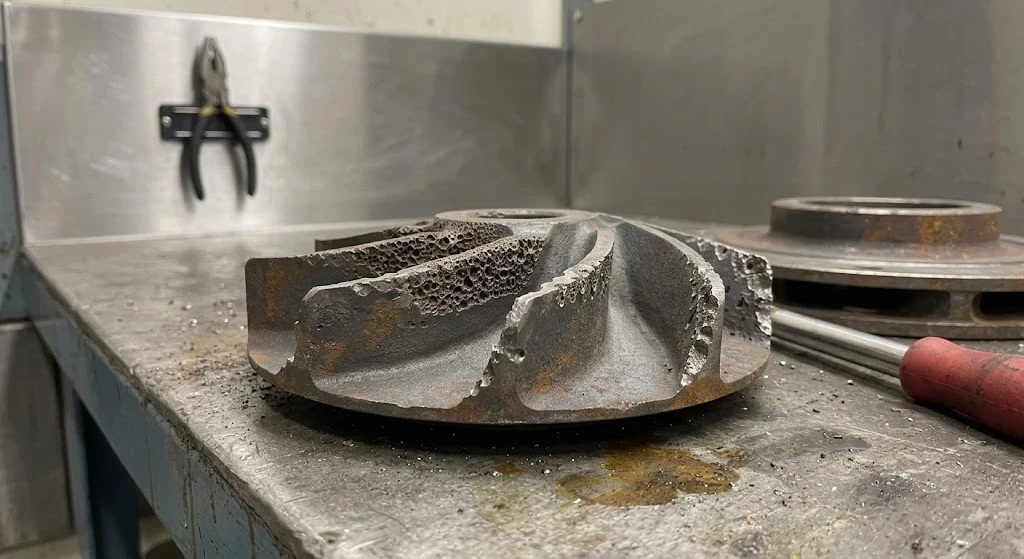
- Classic suction cavitation starts at the impeller eye. NPSH available has fallen below what the pump needs, so the liquid flashes as it accelerates around the vane leading edge. Damage appears on the low-pressure side of the vane near the inlet, and a badly affected impeller looks like a sponge.
- Discharge cavitation starts at the volute. Discharge pressure that’s too high, or a pump running far to the left of its curve below minimum continuous stable flow, leaves most of the liquid recirculating inside the casing at high velocity instead of leaving it. Pressure drops locally at the cutwater gap. Damage shows up as pitting on the outer edges of the impeller vanes and near the cutwater on the volute. Severe cases break the shaft.
- Suction recirculation is a part-flow instability, and it’s the mechanism most often misdiagnosed. Pumps built for a low NPSH requirement have a large impeller eye. At reduced flow that oversized inlet sets up backflow and swirl at the vane inlet. Damage lands on the pressure side of the vane, the opposite face from classic cavitation, and often on the shroud. Adding NPSH does not help. Minami’s Pitot traverses in 1960 showed the peak in the visual inception curve lines up with the onset of suction recirculation, which is why high suction specific speed pumps have a narrow safe operating window.
- Vane passing is a geometry problem. When the impeller vane tip runs too close to the volute cutwater, the flow between them accelerates hard enough to drop below vapor pressure every time a vane sweeps past. Damage is periodic and localized at the vane tips and the cutwater.
- Air entrainment is not cavitation, and telling them apart saves a wasted repair. Air pulled in through a vortexing sump, a leaking gland or a partly open valve produces similar noise and similar performance loss. The tell is recompression: vapor bubbles condense back into the liquid downstream, while entrained air bubbles do not. If you can see bubbles in transparent discharge tubing, you have air, not cavitation.
Diagnose the mechanism
Match the damage pattern and the operating condition to the mechanism before changing any hardware.
| What you observe | Most likely mechanism | Where to look |
|---|---|---|
| Sponge-like pitting, suction side of vane, near the eye | Classic suction cavitation | Impeller eye, vane leading edge |
| Pitting on impeller outer edges and volute wall | Discharge cavitation | Cutwater, volute periphery |
| Pitting on the pressure side of the vane and the shroud | Suction recirculation | Vane inlet, pressure face |
| Periodic pitting at vane tips and cutwater | Vane passing | Cutwater clearance |
| Bubbles visible in clear discharge tubing | Air entrainment | Sump vortex, gland, suction valve |
| Noise worst when the tank runs low or the liquid is hot | Classic suction cavitation | Check NPSH margin first |
| Noise and damage worst at low flow, quiet at duty point | Suction recirculation or discharge cavitation | Compare to minimum continuous stable flow |
Track what makes the symptoms worse. NPSH-driven cavitation gets loudest when suction conditions are worst: a near-empty tank, a hotter liquid, a clogged strainer, a higher speed. Symptoms that peak at low flow and go quiet at the duty point point away from NPSH entirely.
Then measure before you re-pipe. Fit a gauge at the suction flange, convert the reading to absolute, subtract vapor pressure at the pumping temperature, and compare against the manufacturer’s curve. A calculated NPSH available assumes clean pipe of the correct bore and a fully open valve, which an installed system rarely gives you. Wear, relief valve bypass and aeration all produce the same noise, low flow and vibration.
Quantify it: NPSH margin
Net positive suction head available is the head the liquid has above its own vapor pressure at the pump inlet. From a vented tank:
$$ NPSH_A = \frac{p_{atm}}{\rho g} – h_e – h_L – \frac{p_v}{\rho g} $$
where \(p_{atm}\) is atmospheric pressure in absolute terms (Pa), \(h_e\) is the elevation from liquid surface to pump inlet (m, positive for suction lift and negative for flooded suction), \(h_L\) is total suction-side friction loss (m), \(p_v\) is vapor pressure at the pumping temperature (Pa), \(\rho\) is density at that same temperature (kg/m³), and \(g\) is 9.81 m/s².
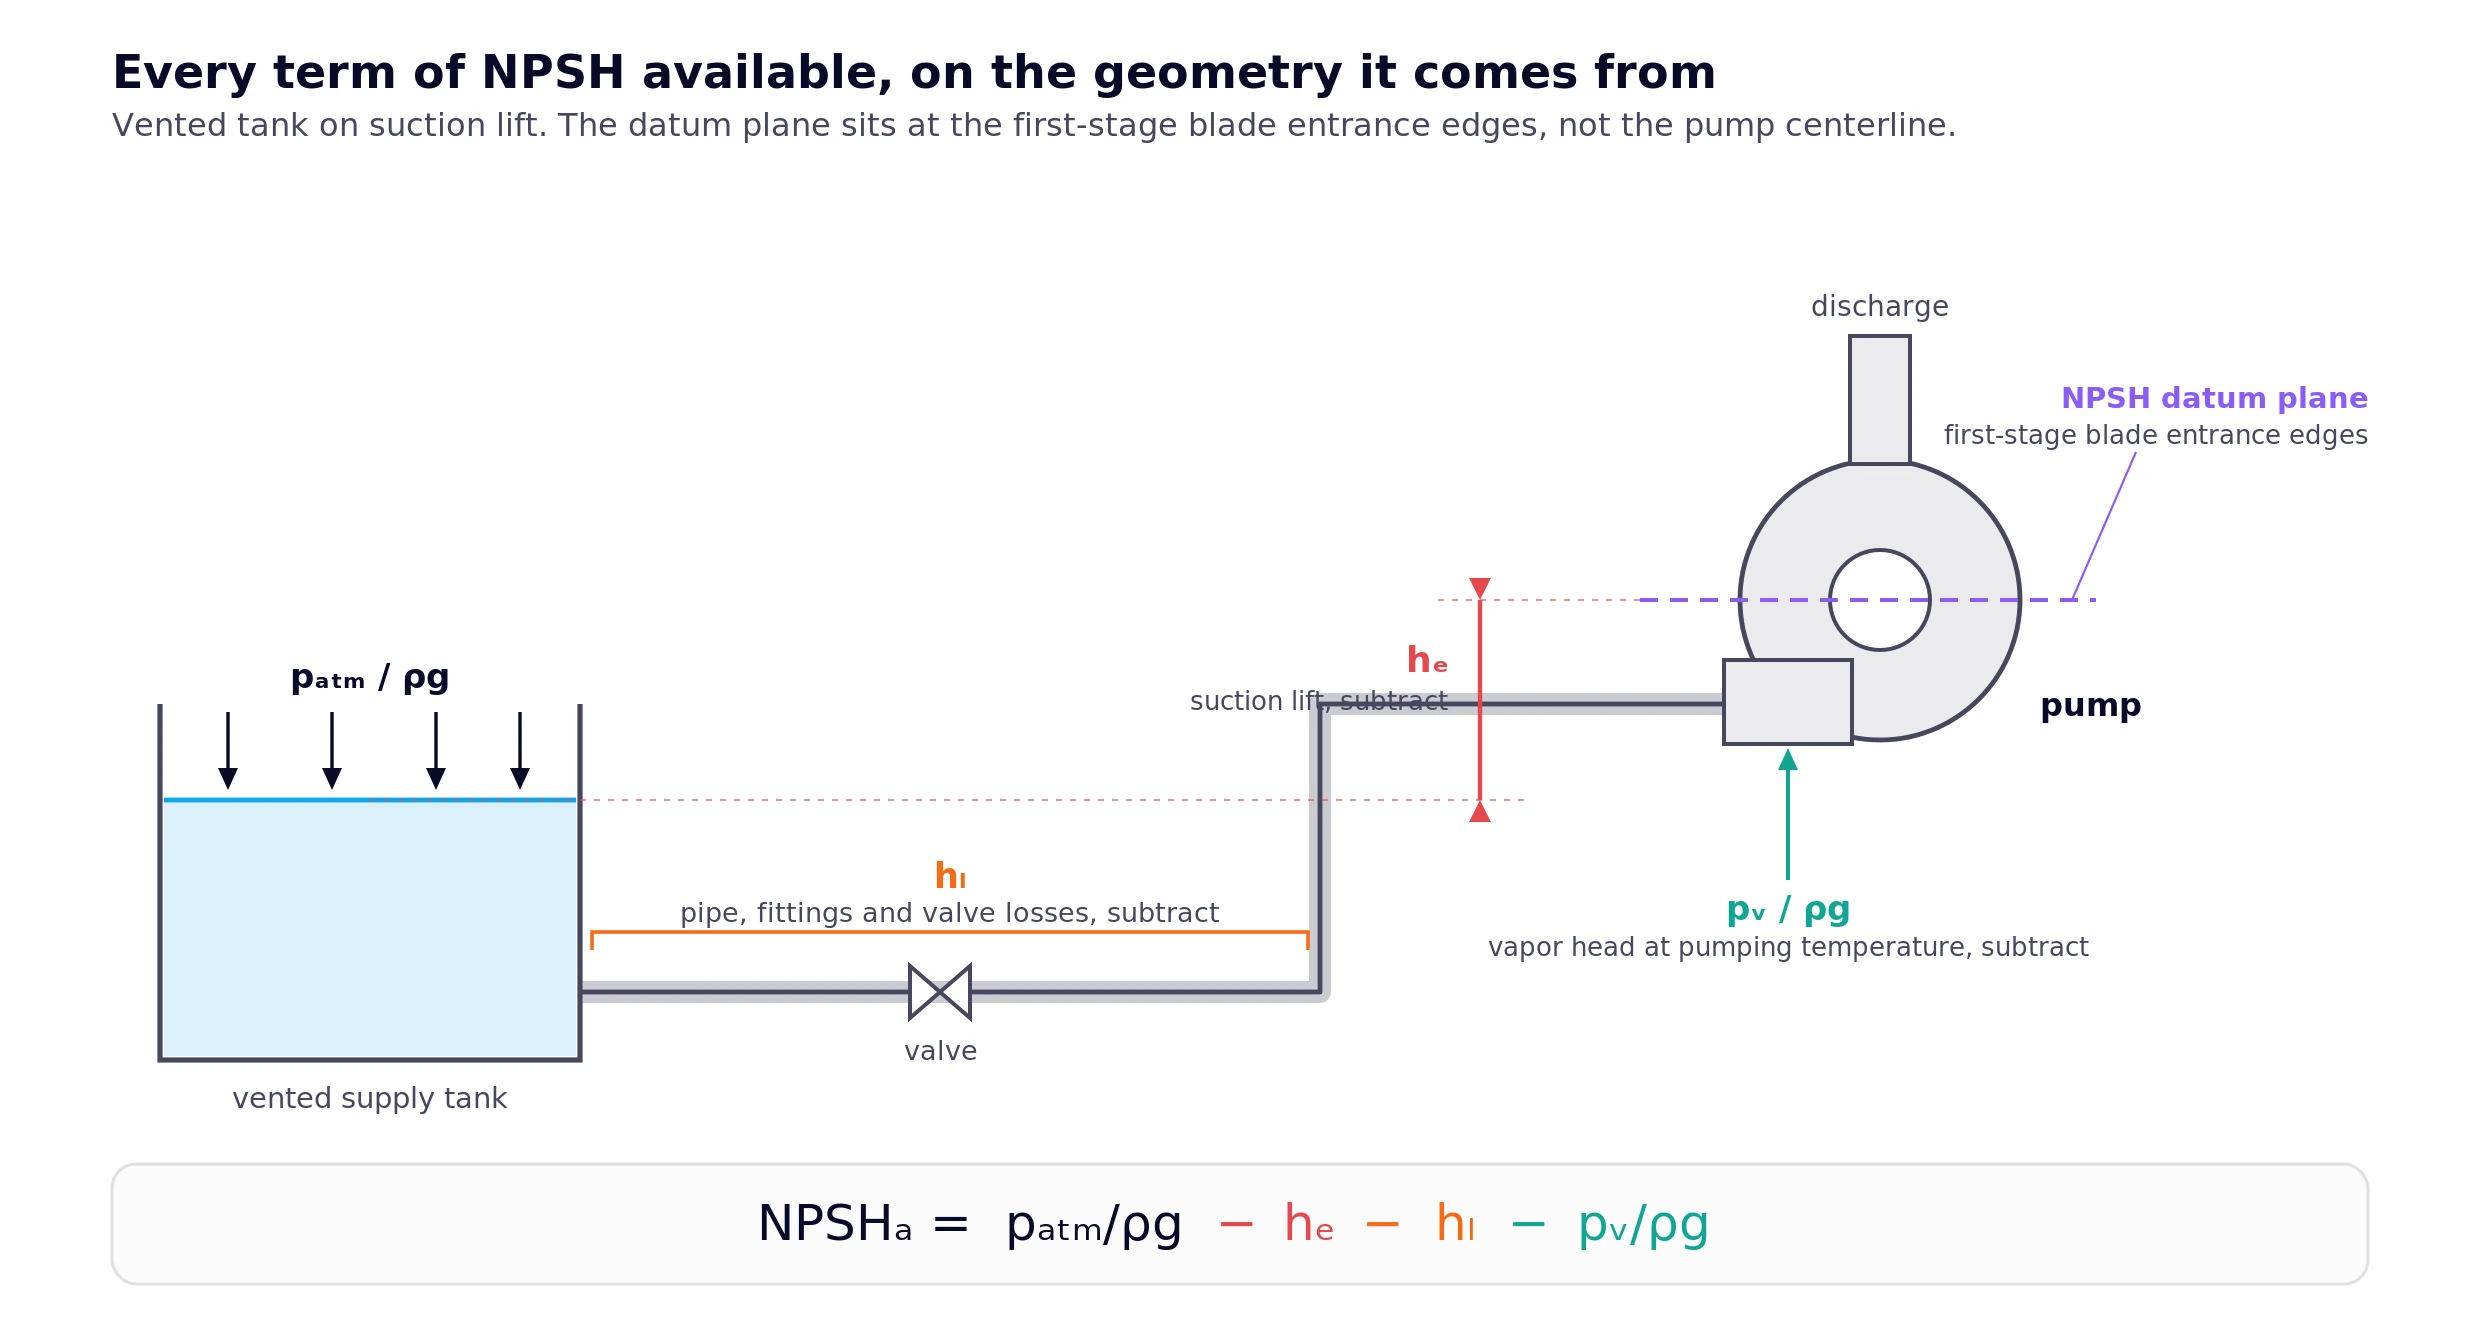
ISO 9906:2012 defines NPSH against a datum plane through the entrance edges of the first-stage impeller blades, not the pump centerline. On a vertical or inclined double-inlet pump that distinction moves the answer.
Trap 1: NPSHr is 3% of first-stage head, not total head
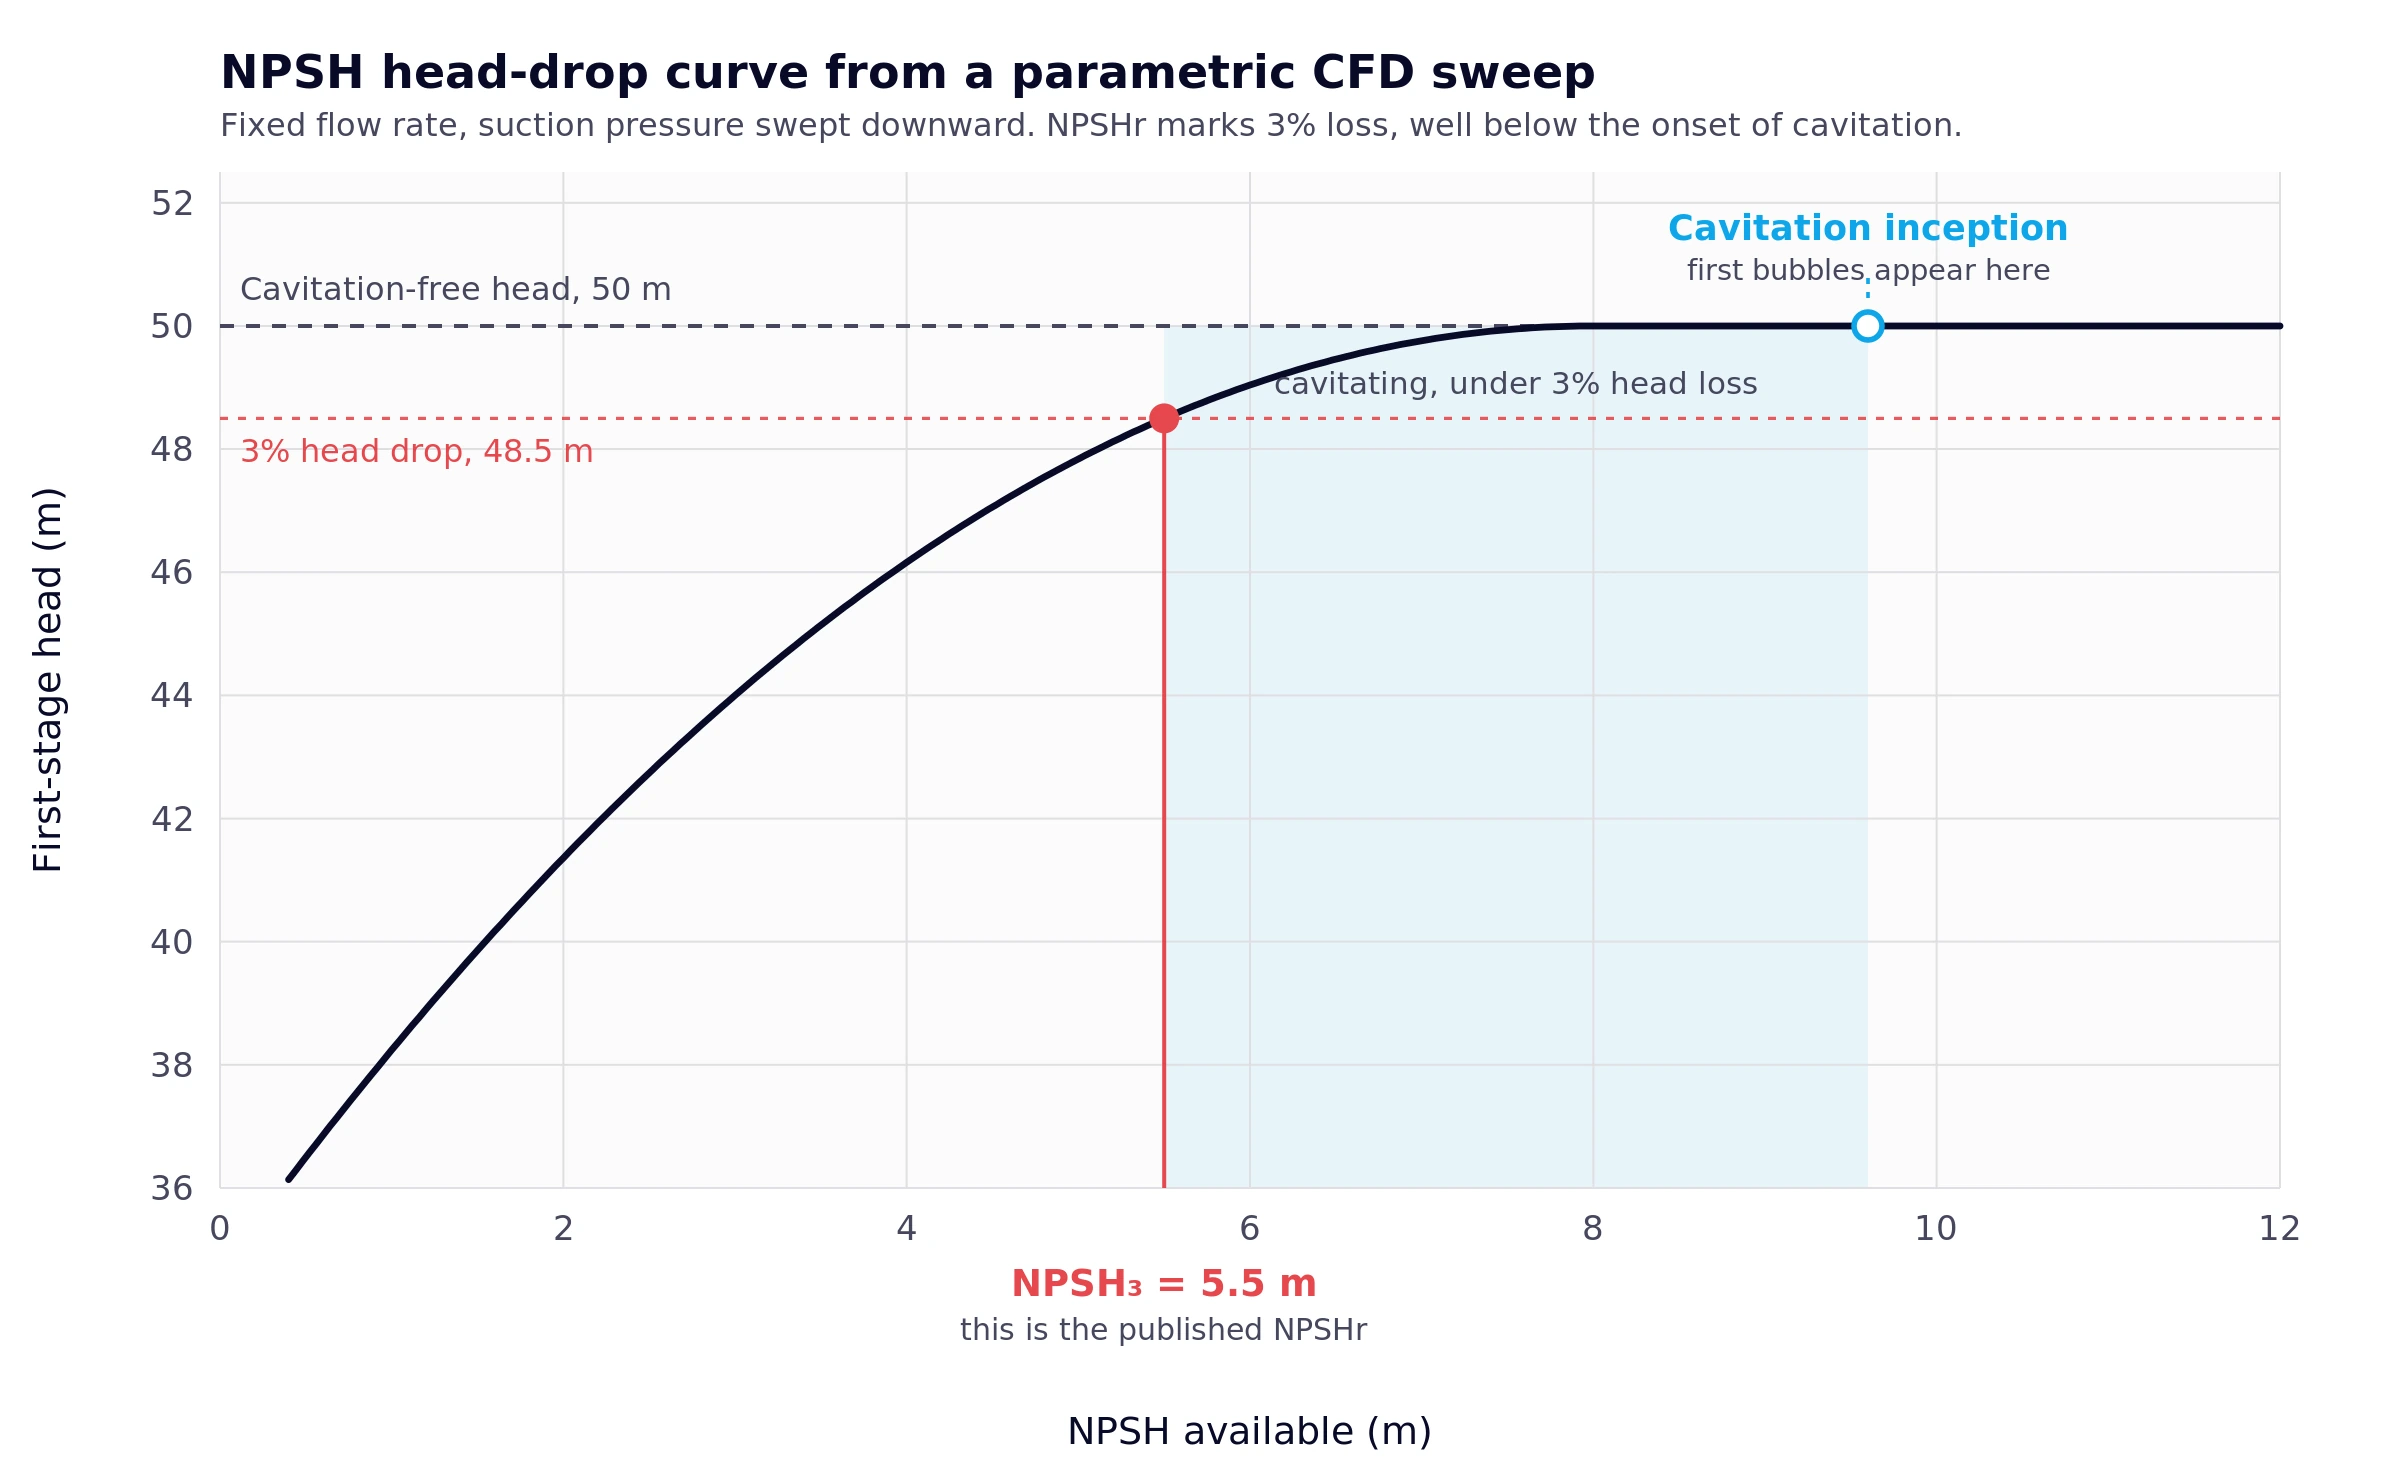
Published NPSHr is almost always NPSH3, which ISO 9906:2012 clause 3.2.23 defines as the NPSH that produces a 3% drop in the total head of the first stage. On a six-stage pump, 3% of first-stage head and 3% of total head differ by a factor of six. Read the multistage curve carefully.
Trap 2: meeting NPSHr does not mean the pump is cavitation-free
NPSHr is the point where cavitation has already grown enough to block 3% of the head. Cavitation begins well above it. ISO 9906 clause 3.2.22 lists incipient cavitation, noise onset and erosion limits as separate and higher criteria. Suppressing cavitation completely takes a margin ratio somewhere between 2 and 10, often above 4, which almost nobody specifies. Most pumps run with some cavitation and acceptable reliability. The question is how much.
Worked example
The install below fails ANSI/HI margin guidance by 0.22 m while showing a margin ratio of 1.23, which is why the ratio alone is not a sufficient check.
Water at 50 °C, vented tank, pump 1.5 m above the liquid surface, 0.9 m of suction-side loss, pump NPSHr 5.5 m at duty flow. At 50 °C, \(p_v\) = 12.33 kPa and \(\rho\) = 988.1 kg/m³, so \(p_v/\rho g\) = 1.27 m and \(p_{atm}/\rho g\) = 10.46 m.
$$ NPSH_A = 10.46 – 1.5 – 0.9 – 1.27 = 6.78\ \text{m} $$
Margin is 1.28 m at a ratio of 1.23. ANSI/HI 9.6.1-2012 guidance for water service with a stainless or aluminum-bronze impeller below 75 kW per stage asks for a 1.1 ratio or a 1.5 m minimum, whichever is greater. The 1.5 m rule needs 7.0 m available. This install has 6.78 m.
Now run the same system on 20 °C water. Vapor head falls to 0.24 m and density rises to 1,000 kg/m³, giving 7.69 m available and a 2.19 m margin. Heating the same water by 30 °C costs 0.91 m of NPSH available and flips a compliant install into a non-compliant one.
Vapor pressure of water
Vapor pressure roughly doubles every 15 °C across normal pumping temperatures, which makes liquid temperature the fastest-moving term in the NPSH balance.
| Temperature | Vapor pressure (kPa abs) | (psia) | Vapor head (m) |
|---|---|---|---|
| 20 °C | 2.34 | 0.34 | 0.24 |
| 50 °C | 12.33 | 1.79 | 1.27 |
| 80 °C | 47.35 | 6.87 | 4.97 |
Use density at the pumping temperature, not cold-water density. At 80 °C water is 2.8% lighter, and a cold-water figure understates vapor head by roughly 0.14 m.
Margin targets by service
Required margin is set by service, and both the ratio and the absolute minimum bind. Take whichever gives the larger number.
| Service | ANSI/HI 9.6.1-2012 margin, allowable operating range (take the greater) |
|---|---|
| Water, SS or Al-bronze impeller, < 75 kW/stage | 1.1 ratio or 1.5 m |
| Petroleum / hydrocarbon process | 1.1 ratio or 1.0 m |
| Chemical process | 1.1 to 1.2 ratio or 0.6 to 1.0 m |
| Boiler feed, < 250 kW/stage | 1.3 ratio |
| Circulating and cooling water | 1.0 m |
| General catalogue pump | 1.1 ratio or 1.0 m |
These values are guidance, not requirements, and HI says so. The 2024 edition of 9.6.1 moved the margin reference from NPSH3 to NPSHR and covers ten market segments, so check the current edition for anything you’re specifying.
Screen the design before you build it
Suction specific speed catches cavitation-prone impellers on paper, before any hardware exists. It flags an impeller eye that has been enlarged too far in pursuit of a low NPSHr:
$$ N_{ss} = \frac{N\sqrt{Q}}{NPSHR^{0.75}} $$
In US units (N in rpm, Q in gpm per impeller eye at best efficiency point, NPSHr in ft), values above roughly 11,000 call for a closer look at operating range. IOGP JIP33 S-615, a supplementary specification to API 610, caps it at 11,000. A figure near 8,500 circulates widely as a conservative rule of thumb.
The units matter more than the threshold. US customary \(N_{ss}\) is about 51.6 times the metric value computed in rpm, m³/s and m, and “metric \(N_{ss}\)” means at least three different things depending on whether flow is in m³/s, l/s or m³/h. A limit quoted without its unit set can reject a perfectly good pump.
Take the worked example above: 3,550 rpm, 800 gpm single suction, NPSHr 5.5 m (18.0 ft). That gives \(N_{ss}\) ≈ 11,470, over the limit. The pump will hit its NPSHr number and still have a narrow window before suction recirculation starts.
Find it before the test rig: cavitation in CFD
CFD predicts cavitation in a pump that hasn’t been built. Damage location, NPSH margin and \(N_{ss}\) all require existing hardware, which puts them downstream of the decisions that are cheap to change.
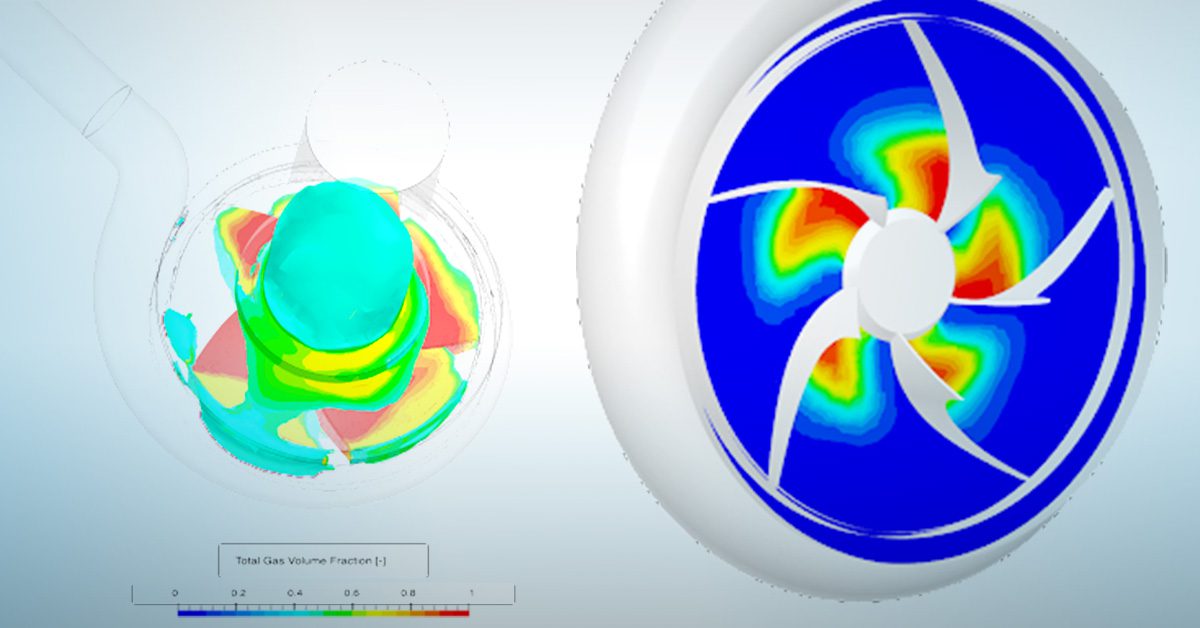
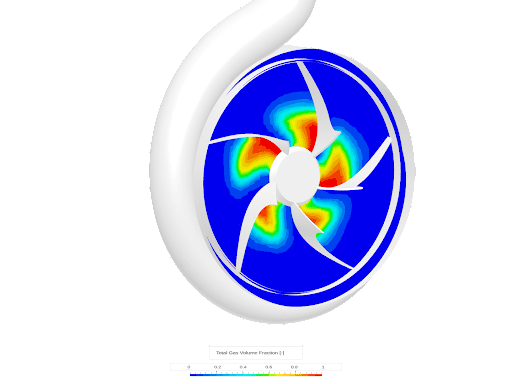
A pump is a closed system, so operators can’t see cavitation happening and quantifying its extent from external symptoms is guesswork. Simulation resolves the vapor field directly: where bubbles form, how much of the passage they block, and which vane surface they collapse against.
Setting up a cavitation simulation
Cavitation runs as a toggle on the turbomachinery solver, with the vapor field reported as gas volume fraction. Our cavitation model implements the Full Cavitation Model of Singhal et al. inside the Multi-purpose analysis type, a turbomachinery-specific solver with a full cavitation model for pump NPSH characterization. Practical notes:
- Materials. Cavitation needs five properties beyond the usual density and viscosity: vapor molecular weight, liquid bulk modulus, liquid reference pressure, saturation pressure and liquid temperature. Water is already in the library. Anything else gets defined once and saved.
- Results field. Cavitation is reported as gas volume fraction, so it post-processes like any other field. Iso-volumes beat cutting planes here, because the question is how much of the passage the vapor occupies in three dimensions, not what it looks like on one slice.
- Mesh. The body-fitted Cartesian mesh resolves the vane leading edge, which is where inception happens. Refine there rather than uniformly.
- Sweeps. Parameterize the suction condition and run the points concurrently. That’s what turns a single run into an NPSH head-drop curve.
Walkthrough: How to Run CFD of a Centrifugal Pump.
Generating an NPSH head-drop curve
A parametric sweep produces the full head-drop curve for your geometry. Fix the flow rate, sweep suction pressure downward across parallel runs, and record first-stage head at each point. Where head has fallen 3% you have computed NPSH3 for that geometry, on the same basis the manufacturer’s published figure uses. Sweep flow rate as well and the cavitation-limited operating window falls out.
This is the same parametric machinery behind a pump curve, pointed at suction conditions. Designing custom gear-driven pumps, Guerreiro Romani ran 21 steady-state simulations in parallel to get a full characteristic curve in 2 hours at 30 core hours per operating point, cutting analysis turnaround from two weeks to two hours and saving an average of €10k in design and prototyping costs per project. Cavitation characterization is the next phase of that work.
How far to trust it
Published validation puts the solver within 6% of experiment on cavitating flow and within 3% of test data on pump curves.
Our choked flow validation case runs water through a thick orifice plate at 5,000 psi inlet pressure against the experimental data of Ebrahimi et al., on a 1.14 million cell hexahedral mesh with k-epsilon turbulence and the cavitation model active. Predicted volumetric flow rate sits within -4.1% to +5.9% of measurement across six outlet pressures from 345 to 2,813 psi, and the solver reproduces the choking transition below about 2,050 psi.
On rotating hardware, Hazleton Pumps benchmarked three pumps against their own test data. A 75 kW vertical pump came within 2 to 3% of in-house test results once manufacturing differences and pipe head loss were accounted for. A 250 kW pump too large to test on site went to the South African Bureau of Standards, where each physical test cost about $3,000; the simulation ran in 23 minutes and landed inside a 3% error margin.
For comparison, their previous OpenFOAM workflow needed 3 to 6 days per data point, so a six-point pump curve took up to a month. The same curve for a 5.5 kW submersible took 7 minutes in SimScale.

Benjamin van der Walt
Engineering Manager, Hazleton Pumps

“I can’t speak more highly of the SimScale simulation software. I am an avid believer in open source, but this just blew me over.”
Eliminate it
Group the fixes by which term in the NPSH balance you’re moving. Failed repairs usually move a term that wasn’t the constraint.
Raise NPSH available (system side). Raise the minimum tank level or lower the pump. Shorten the suction line and increase its bore. Remove elbows, strainers and partly-closed valves. Cool the liquid, since vapor pressure is the term that moves fastest with temperature. Pressurize the supply vessel where the process allows. Little can be done about atmospheric pressure, and altitude works against you: roughly 0.30 m of suction lift is lost per 250 m of elevation.
Lower NPSH required (pump side). Slow the pump, accepting the flow reduction, or fit a larger pump running slower to hold the duty point. Reshape the impeller inlet: eye area and inlet blade angle set the acceleration that triggers inception. Add an inducer ahead of the first stage. Move to double suction to halve flow per eye.
Move the operating point. Discharge cavitation and suction recirculation are operating-range problems. Trim the impeller, change speed, or fix the control scheme that is holding the pump below minimum continuous stable flow.
Accept it and manage the consequence. Sometimes the practical choice. Diinef faced cavitation in hydraulic motor valves running at pressure differences of several hundred bar. CFD cut pressure drop on the slightly open valve by 80%, bringing it into the target operating range, and showed the potential cavitation zone shifting several millimeters away from the wall. Physical tests confirmed the pressure-drop reduction and still showed cavitation. Knowing where it would strike, the team added material in the risk zone.
Each of these changes is a geometry or boundary condition edit in simulation, and a hardware modification on an installed pump. Testing the impeller inlet angle, the eye area and three volute variants in parallel costs an afternoon of setup, which is why refining a centrifugal pump design is where cavitation gets designed out.
Frequently Asked Questions
Noise usually comes first: a crunching or gravelly sound from imploding vapor bubbles, loudest when suction conditions are worst. Flow and head fall below the curve, and vibration rises. None of these is conclusive on its own, since wear, relief valve bypass and air entrainment produce the same symptoms. Confirm with a suction gauge reading before acting.
No. Published NPSHr is normally NPSH3, the point at which cavitation already blocks 3% of first-stage head. Cavitation starts well above it. Fully suppressing it takes a margin ratio of 2 to 10, so specify against ANSI/HI 9.6.1 margin guidance for your service rather than against NPSHr alone.
Often, if the mechanism is classic suction cavitation. Raising tank level, shortening and widening the suction line, cooling the liquid or slowing the pump all help. Suction recirculation and discharge cavitation are operating-range problems, so they need the duty point or the impeller changed, and adding NPSH will not touch them.
Our choked-flow validation case predicts flow rate within -4.1% to +5.9% of published experimental data across a wide pressure range, including the choking transition. Hazleton Pumps matched SABS pump curve test data within 2 to 3%. Accuracy depends on mesh resolution at the vane leading edge and on correct saturation pressure and bulk modulus for the liquid.
Vapor bubbles form from the liquid itself when pressure drops below vapor pressure, and they condense back when pressure recovers. Entrained air comes in from outside through a vortexing sump, a leaking gland or a valve, and it does not redissolve downstream. Visible bubbles in clear discharge tubing point to air. Cavitation happens and finishes inside the pump.