A bad coordinate file costs you a day. Points in the wrong order, a trailing edge that doesn’t close, or a section scaled to 1 when your CAD model works in millimeters, and the mesh fails before the first iteration.
This NACA airfoil generator builds any 4- or 5-digit section from its designation and exports clean coordinates in the format your tool expects. Type a code or move the sliders. The plot, the section properties and the coordinate file update as you go.
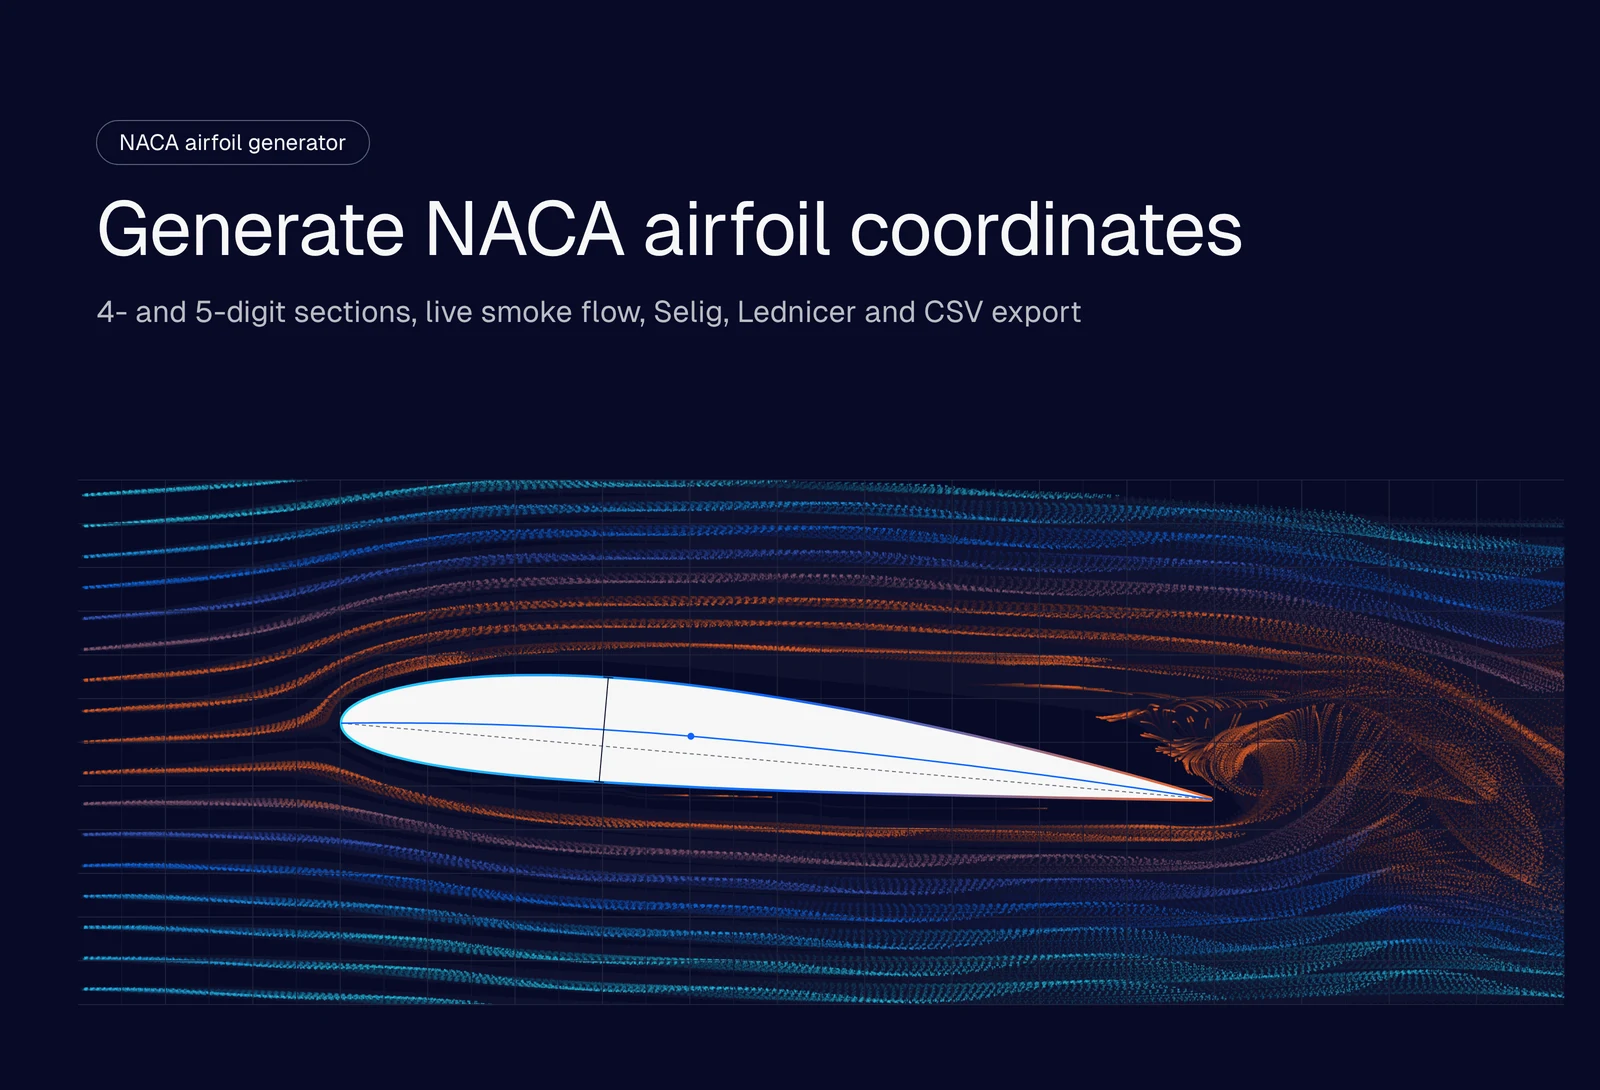
Interactive NACA airfoil generator: enter a 4- or 5-digit NACA designation to plot the airfoil, view thin-airfoil section properties and export coordinates as Selig .dat, Lednicer .dat or CSV. Enable JavaScript to use the tool.
How to use the NACA airfoil generator
- Enter a designation, for example 2412 or 23012, or click one of the common airfoils.
- Fine-tune the shape with the sliders: max camber, max camber position and max thickness for the 4-digit series, or design lift coefficient and camber position for the 5-digit series.
- Set the point distribution. Keep cosine spacing unless your tool needs evenly spaced points. 100 points per surface is plenty for CAD; go higher for a panel code.
- Pick the trailing edge. Use a closed trailing edge if you plan to mesh the section.
- Scale it. Enter the chord length and units so the file drops straight into your CAD model.
- Choose the export format (Selig, Lednicer or CSV) and click Copy coordinates.
Hover over the plot to read the upper and lower surface coordinates and the local thickness at any chord position. The angle of attack slider pitches the section about its quarter chord and updates the lift coefficient.
What the NACA airfoil numbers mean
NACA stands for the National Advisory Committee for Aeronautics, the US agency that became NASA in 1958. In the 1930s it defined airfoil families by equation, so every digit in the name describes the geometry. That’s why a generator can rebuild any section from its four or five digits.
NACA 4-digit airfoils
A 4-digit code describes the camber line and the thickness separately. Take the NACA 2412, the section on the Cessna 172 wing:
| Digit | Value in 2412 | Meaning |
|---|---|---|
| 1st | 2 | Max camber of 2% of the chord |
| 2nd | 4 | Max camber at 40% of the chord (in tenths) |
| 3rd and 4th | 12 | Max thickness of 12% of the chord |
When the first two digits are 00, the section is symmetric. The NACA 0012 is the classic example and the standard case for validating CFD solvers. Every 4-digit section reaches its max thickness at 30% of the chord.
NACA 5-digit airfoils
The 5-digit series moves the max camber further forward, which raises max lift and gives a lower pitching moment. Its camber line is defined by a design lift coefficient instead of a camber percentage. Using the NACA 23012:
| Digit | Value in 23012 | Meaning |
|---|---|---|
| 1st | 2 | Design lift coefficient of 2 × 0.15 = 0.3 |
| 2nd | 3 | Max camber at 3 × 5 = 15% of the chord |
| 3rd | 0 | Standard camber line (1 = reflexed) |
| 4th and 5th | 12 | Max thickness of 12% of the chord |
A reflexed camber line curves back up near the trailing edge. That cancels most of the pitching moment, which is why reflexed sections show up on flying wings and tailless aircraft. The generator supports reflexed lines for camber positions 2 to 5, the range NACA published constants for.
How the generator builds the coordinates
Every section is a thickness distribution wrapped around a camber line. The 4-digit thickness distribution, as a fraction of the chord \(c\) with \(x\) from 0 at the leading edge to 1 at the trailing edge, is:
$$ y_t = 5t\left(0.2969\sqrt{x} – 0.1260x – 0.3516x^2 + 0.2843x^3 – 0.1015x^4\right) $$
Here \(t\) is the max thickness as a fraction of the chord (0.12 for a 12% section). The 4-digit camber line is two parabolas that meet at the max camber point. The 5-digit series uses a cubic forward of the max camber point and a straight line behind it, with the constants \(r\) and \(k_1\) tabulated by Abbott and von Doenhoff for a design lift coefficient of 0.3 and scaled linearly for other values.
The generator offsets the upper and lower surfaces normal to the camber line, which is how NACA defined them. Adding the thickness straight up and down is a common shortcut, and it distorts the leading edge of cambered sections.
Cosine spacing
Curvature is highest at the leading edge, so that’s where you need the most points. Cosine spacing places points at \(x = \tfrac{1}{2}(1 – \cos\beta)\) for evenly spaced \(\beta\) from 0 to π. You get dense points at both the leading and trailing edges and fewer along the flat mid-chord. Uniform spacing leaves the leading edge under-resolved and is only worth picking when another tool needs it.
Open or closed trailing edge
The original NACA equation leaves a small gap at the trailing edge, about 0.25% of the chord for a 12% section. Changing the last coefficient from −0.1015 to −0.1036 closes it to a point. Most meshers handle a closed trailing edge with less cleanup, so pick it for CAD and CFD. Keep the open version when you need to match published NACA ordinates exactly.
Which export format to use
| Format | Point order | Use it for |
|---|---|---|
| Selig .dat | One loop: trailing edge, over the upper surface to the leading edge, back along the lower surface to the trailing edge | XFOIL, XFLR5 and most airfoil databases |
| Lednicer .dat | Upper surface leading edge to trailing edge, then lower surface leading edge to trailing edge, with a point-count header | Older analysis codes and the Lednicer files on the UIUC database |
| CSV (x, y, z) | Same loop as Selig, with z = 0 and scaled to your chord and units | Importing a curve into SolidWorks, Fusion, Onshape or another CAD tool |
For CAD, export CSV at your real chord length, import it as a curve through points, then extrude or loft it into a wing.
Section properties from thin-airfoil theory
The section properties come from thin-airfoil theory, which models the airfoil as its camber line in inviscid, incompressible flow. It predicts:
- Lift curve slope of 2π per radian, about 0.11 per degree
- Zero-lift angle \(\alpha_{L0}\), which depends only on the camber line (−2.08° for the NACA 2412, 0° for any symmetric section)
- Lift coefficient \(C_l = 2\pi(\alpha – \alpha_{L0})\), with α in radians
- Moment coefficient about the quarter chord, constant with angle of attack (−0.053 for the NACA 2412)
These numbers are good for comparing sections and sanity-checking a design at low angles of attack. Thin-airfoil theory ignores thickness, viscosity and stall, so it overpredicts lift near stall and gives no drag at all. You need a viscous CFD simulation or wind tunnel data for max lift, stall angle and drag.
The generator also reports the leading-edge radius (\(r_{LE} = 1.1019\,t^2\)), the trailing-edge gap and the cross-section area, which you can use for mass and volume estimates.
Common NACA airfoils
| Airfoil | Type | Where you’ll see it |
|---|---|---|
| NACA 0012 | Symmetric, 12% thick | Tail surfaces, rotor blades, CFD validation |
| NACA 2412 | Cambered, 12% thick | Light aircraft wings, including the Cessna 172 |
| NACA 4412 | Cambered, 12% thick | High-lift wings, wind tunnel and CFD teaching cases |
| NACA 4415 | Cambered, 15% thick | Wings and small wind turbine blades that need more structural depth |
| NACA 6409 | Highly cambered, 9% thick | Low-speed, low Reynolds number designs such as model aircraft |
| NACA 23012 | 5-digit, 12% thick | General aviation wings that need higher max lift |
| NACA 23015 | 5-digit, 15% thick | Thicker wing roots |
All seven are presets in the generator.
What the smoke animation shows
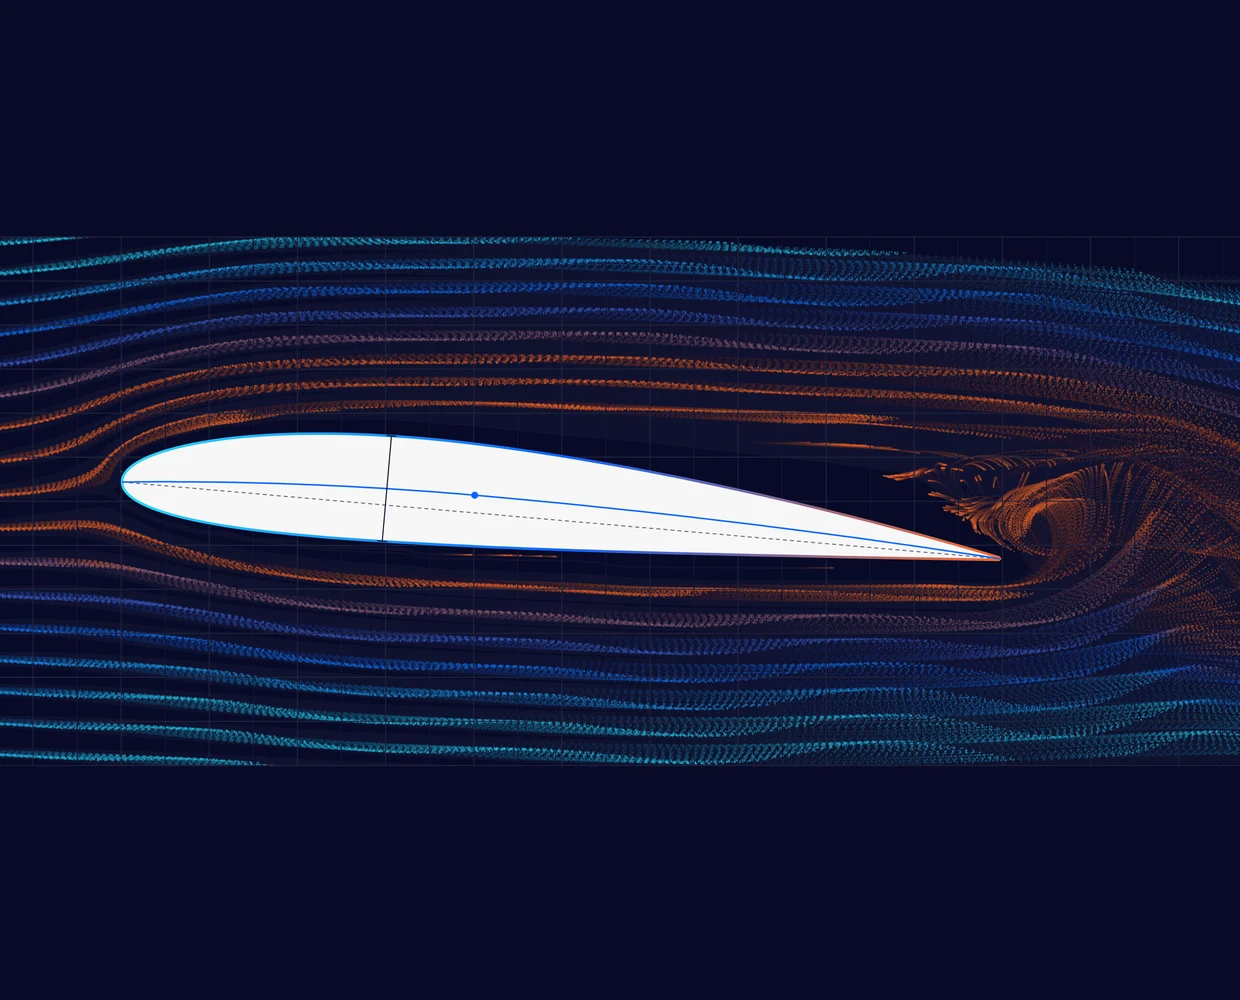
The smoke over the plot comes from a small 2D lattice Boltzmann simulation running in your browser at a Reynolds number of about 5,000. Color shows local speed: orange where the body slows the flow, through blue to aqua at freestream speed. The inflow wobble adds a slow swing to the oncoming flow, like wind tunnel turbulence, which triggers vortex shedding in the wake.
Use it to build intuition, for example how the stagnation point moves and the wake thickens as you increase the angle of attack. Real wings fly at Reynolds numbers in the millions, and this lattice is far too coarse for force predictions. SimScale’s own Lattice Boltzmann solver runs the same method at production scale.
From airfoil coordinates to a CFD simulation
Coordinates give you a shape. A CFD simulation tells you how it performs: lift and drag polars, stall angle, pressure distribution and the separated flow behind it. You can run that in SimScale from a browser, with no install and no HPC to manage.
- Export the CSV at your real chord length.
- Build the geometry in CAD. Extrude the curve for a 2D-style section or loft several sections into a 3D wing, then upload it to SimScale.
- Set up an incompressible flow analysis with the k-omega SST turbulence model and a flow domain several chord lengths around the section.
- Sweep the angle of attack to build the lift and drag polar, running the angles in parallel.
You can check the method against a reference first. SimScale’s NACA 0012 validation case compares OpenFOAM results at a Reynolds number of 6 million with Ladson’s experimental lift and drag data. At 10° angle of attack, the moderate mesh predicts a lift coefficient within 0.5% of the measurement. The same airfoil-to-performance workflow works for blades: Designcraft cut its turbine size by 30% at the same effectiveness using CFD on SimScale.
To see a finished setup, open a public project such as this NACA 4412 airfoil simulation and copy it into your workspace. For the aerodynamic terms behind the results, see lift, drag and pitch, the lift coefficient and the drag coefficient.
Run CFD on your airfoil
Get lift and drag polars, stall angle and pressure distributions for any section, straight from your browser.
Frequently asked questions
NACA stands for the National Advisory Committee for Aeronautics, the US federal agency for aeronautical research from 1915 to 1958, when it became NASA. Its airfoil series are still the standard reference sections in aerodynamics.
NACA 2412 is a 4-digit airfoil with a max camber of 2% of the chord, located at 40% of the chord, and a max thickness of 12% of the chord. It’s the wing section of the Cessna 172.
Both use the same thickness distribution. The 5-digit series has its max camber further forward and defines the camber line by a design lift coefficient, which gives higher max lift and a lower pitching moment. 4-digit sections are simpler to describe by camber and thickness alone.
For CAD, 80 to 100 points per surface with cosine spacing gives a smooth curve. Panel codes such as XFOIL usually work best with 150 to 250 points in total. More points don’t help a CFD mesh, because the mesher re-samples the surface anyway.
Use a closed trailing edge for CAD and CFD meshing, because it avoids a tiny blunt face that meshers struggle with. Use the open trailing edge when you need to match NACA’s published ordinates exactly.
They come from thin-airfoil theory, which is accurate for comparing sections at low angles of attack but ignores viscosity, thickness and stall. For max lift, stall angle and drag, run a viscous CFD simulation or use wind tunnel data.
Yes. Export as CSV with your chord length and units, then use your CAD tool’s curve-through-XYZ-points feature. The z column is 0, so the curve sits on the XY plane, ready to extrude or loft.