A centrifugal pump performance curve is a tool that shows how a pump will perform in terms of head and flow rate as well as efficiency. Pumps can generate high volume flow rates when pumping against low-pressure head or low volume flow rates when pumping against high-pressure head. Reading a pump curve often presents a challenge, particularly to engineers that are new to pumps and turbomachinery. In the following article, we offer a step-by-step overview and a webinar that describe the meanings and how the quantities can be obtained from computational fluid dynamics (CFD) simulation with SimScale.
Pump Curve What is a Pump Curve?
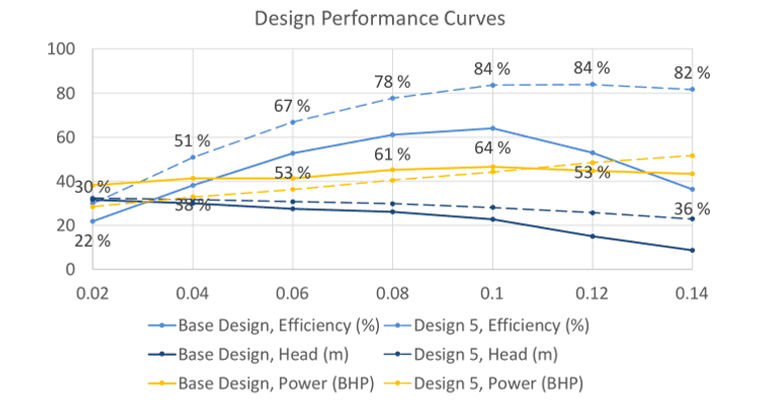
Performance curves usually include three things—an efficiency curve, a pressure curve, and a power curve, and these all have use and meaning when analyzing a system that includes pumps.
Pump Curve Efficiency Curves
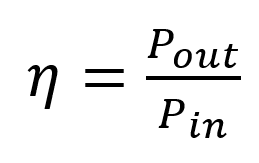
Efficiency curves describe the efficiency at each operating point of the pump; where the peak efficiency of the pump will produce the most power output with the least power input. The efficiency of turbomachinery depends upon whether it is recovering energy or providing it. In this case, a pump is providing energy to a fluid and therefore the efficiency is the ratio of power out of the system and power into the system.
Pump Curve Power Out and Pressure Difference Curve
The power out of the system is measured from the flow. To measure this, power is the volumetric flow rate multiplied by the pressure difference across the system. In terms of recovering this information from CFD, we can monitor the average pressure at the inlet and outlet boundaries to obtain the pressure difference, and then observe an area integral to calculate the flow rate if it is unknown.

Pump Curve Power Curves
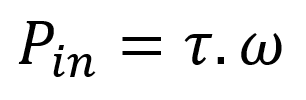
Power, in this case, is the shaft power (measured sometimes in brake horsepower or BHP) of the pump required by the driving mechanism to maintain the specified flow rate. This is usually provided by a motor or engine. The power into the system is the amount of power applied to the shaft of the pump to generate the pressure difference.
Rotational power is calculated by multiplying the torque, or moment force about the center (the shaft rotational axis), and the spin speed of the shaft in radians per second.
Torque is obtained from CFD results using the surface pressures. SimScale automatically calculates the torque about a point and axis by selecting the faces of interest (the impeller) and specifying the rotational axis and point. Torque is taken directly from the platform and is available under result controls as forces and moments.
Pump Curve How to Read a Pump Curve
Pressure head shows the reader what flow rate can be maintained at a given pressure head, i.e., if the pump needs to supply flow to a tank at pressure 1 from a tank at pressure 2, what flow rate can it maintain? This defines the operating point a pump has to operate at, and pump curves can define the efficiency, flow rate, and power required at this condition. Different pump curves can be compared to select the correct pump for the application at hand.
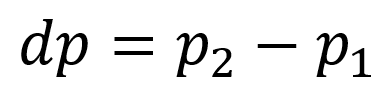
The pressure difference is usually described as head—where the head is height—and can be obtained from pressure. This may be in feet or meters, and the units will be displayed.
Our Case: Pump Curve through CFD
The objectives of our simulation case were to analyze the pump’s design, as well as obtain enough information about its operating capabilities to create a pump curve characteristic. Through CFD evaluation of the pump CAD model, we were able to achieve this in the process stated below.
The Simulation Setup
The CFD simulation used a steady-state incompressible flow, with turbulence model k-omega SST model, with a rotating zone model.

Next, the mesh was set up using a hex-dominant parametric, with added refinements to the layers, surface, volume, and cell zone.

For this simulation, various fixed flow rates were applied rather than testing at different pressure differences. This produced more reliable data for the pump curve. The simplest way to assess whether the pump is producing high pressure or low pressure is setting the pressure at the outlet at 0 Pascals (Pa). The pressure outlet is not of particular relevance to this case, as it is an incompressible flow simulation. Anything above 0 Pa is high, anything below this is low.
A centrifugal pump is essentially an impeller pump, meaning it includes a rotating impeller at its core. To properly simulate this, a rotating zone should be established where anything inside this volume is “spinning”. Dealing with internal geometries, it can sometimes be difficult to fit this zone perfectly within the main geometry. For this reason, the rotating zone extends outside to avoid problems such as poor mesh quality. At this stage, it is important to ensure the center of rotation is accurate and equal to the defined center of rotation in the rotating zone. Instead of rotating the geometry inside, the rotational force should be applied at the wall and fluid domain to give a reliable approximation. In our case study, the force rotates around the rotating axis at 157 radians per second.
How to Read a Pump Curve: Which Results Are Relevant?
In the results control, the key focus when assessing efficiency is the ratio of power entering the inlet and power exiting the outlet. The pressure difference between the pressure at the inlet and pressure at the outlet shows the power that the pump is pushing out, in terms of flow. This is obtained through area averages, and monitoring average pressures at regular intervals such as every 10 seconds. This CFD simulation provides a vast amount of data in the force plot. Looking at the force plot, the pressure moment in the rotating axis reveals the necessary torque applied to the impeller to maintain conditions at the given angular velocity.
Using these key results in the characteristic pump curve enables a reliable reading of the pump’s performance efficiency. This enables you, or your customer, to better understand how the centrifugal pump will perform in a turbomachinery application or compare it to other products or pump designs.
To learn more about how to read pump curves, fill out this short form and watch the webinar here now.
Other Turbomachinery Resources:
- Learn more about centrifugal pump design
- Learn more about simulation-driven pump optimization
- Learn more about water turbines like the Francis turbine
- Learn about water turbine vs. impeller pump design
- Learn how to optimize your propeller design
- Turbomachinery CFD & FEA
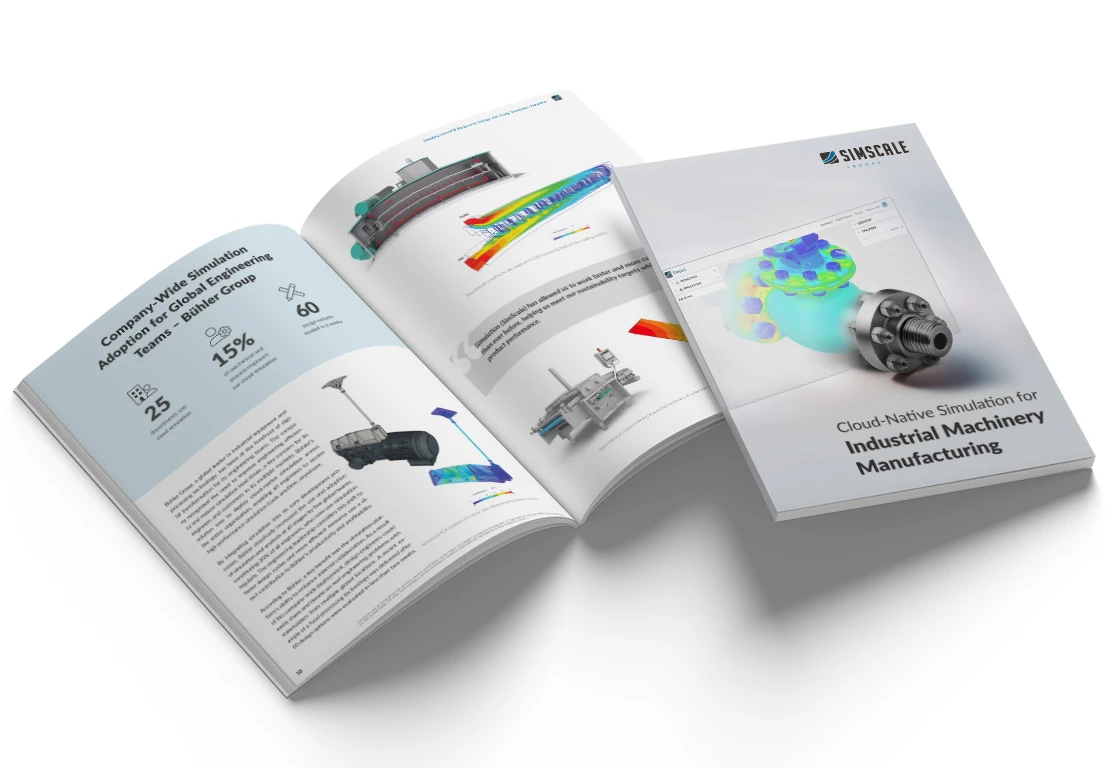
Cloud-Native Simulation for Industrial Machinery Manufacturing
Our latest eBook explores how cloud-native simulation is transforming industrial machinery manufacturing challenges into opportunities. Download it for free by clicking the button below.