
ASHRAE 90.4 does not ask whether your data center stays cool. It sets a ceiling on how much energy the mechanical and electrical systems may burn per unit of IT load, then leaves you to demonstrate that your design stays under that ceiling across a full year of weather. Those are different questions, and a design can pass the second one on a spreadsheet while failing the first one in the room, with the top third of every rack running hot because the return path recirculates.
This article covers what the current edition of 90.4 obliges you to calculate, what ASHRAE TC 9.9 says about the air you deliver to the equipment, and how to test a cooling layout against both before the slab is poured.
Data center cooling standards: ASHRAE 90.4, 90.1 and TC 9.9
Three documents govern a data center’s thermal design in the US and they divide the work between them. ASHRAE 90.4 sets the energy limits for the mechanical and electrical systems, in Sections 6 and 8. ASHRAE 90.1 remains a normative reference to it and still governs the envelope, lighting, service water heating and the minimum equipment efficiencies your cooling plant has to meet. ASHRAE TC 9.9 publishes the thermal guidelines that tell you what conditions the IT equipment actually needs, and unlike the other two it is guidance rather than code.
Until recently, this was a challenging task due to the fact that the industry standards used to assess the energy efficiency of data centers and server facilities were inconsistent. To establish a governing rule for data center HVAC energy efficiency measurements, The Green Grid introduced power usage effectiveness (PUE) in 2006. However, it is a performance metric rather than a design standard and still failed to address relevant design components, so the problem remained.
Does ASHRAE 90.4 apply to your project?
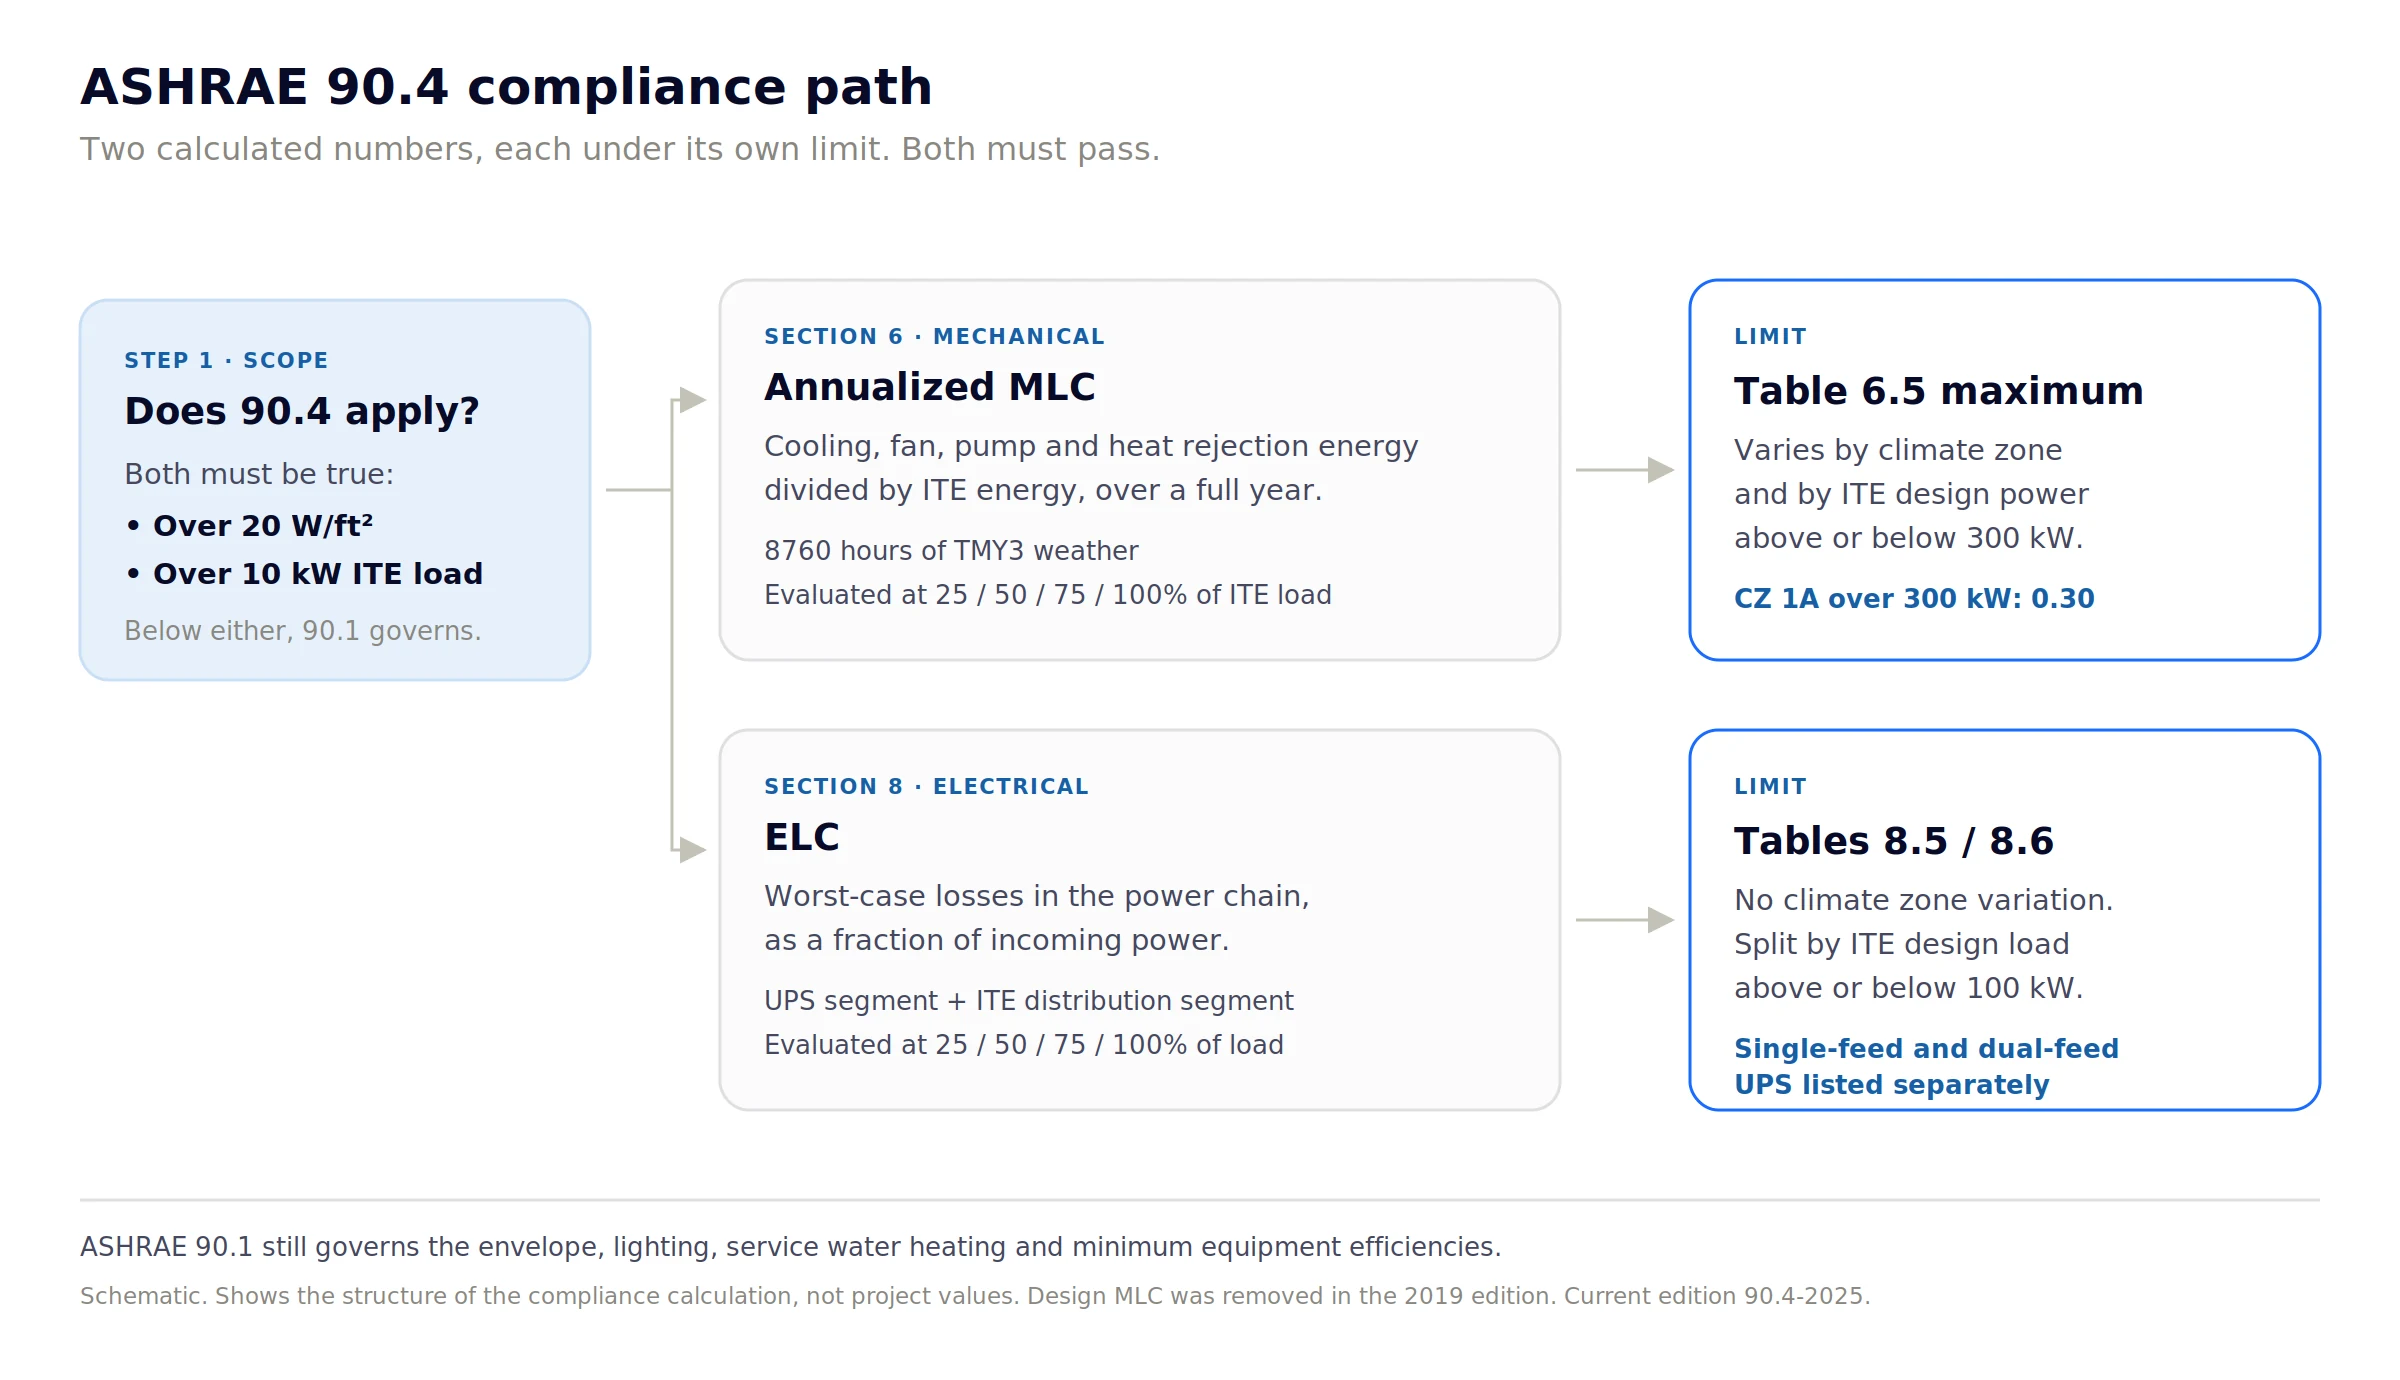
90.4 applies where conditioned floor space exceeds 20 W/ft² and the IT equipment load exceeds 10 kW. Both conditions have to be true. Below that threshold the space is a computer room and 90.1 governs it. Those numbers have held since the first edition, and they are the fastest way to work out which standard you are designing to. One caveat: the 2022 addenda redefined conditioned floor area to follow 90.1’s gross conditioned floor area, so how you compute the 20 W/ft² has moved even though the figure has not.
Two further thresholds sit inside the standard itself. A design ITE power of 300 kW splits the mechanical limits into two bands, with larger facilities held to tighter targets. A design ITE load of 100 kW splits the electrical limits.
Which edition are you designing to?
| Edition | Published | Status |
|---|---|---|
| 90.4-2016 | 2016 | First edition, superseded |
| 90.4-2019 | 2019 | Superseded. Removed the design MLC path |
| 90.4-2022 | 2022 | Superseded, but referenced by 2024 IECC |
| 90.4-2025 | 2025 | Current published edition |
The published edition and the enforceable edition are rarely the same. 2024 IECC requires compliance with Sections 6 and 8 of 90.4-2022, and 2021 IECC substituted its own efficiency tables. Outside the US, EN 16798 plays the equivalent role for building ventilation and indoor climate. Check what your jurisdiction has adopted before you calculate anything, because the limits moved between editions in both directions.
What ASHRAE 90.4 requires
Compliance rests on two calculated numbers, one for the cooling plant and one for the power chain, each with a maximum you have to stay under. Everything else in Sections 6 and 8 exists to define how you produce them.
Mechanical load component (MLC)
The MLC is cooling overhead per unit of IT energy. ASHRAE defines it as the sum of all power required for cooling, fans, pumps and heat rejection equipment, divided by the data center’s IT equipment design power.
The maximum allowable MLC varies by ASHRAE climate zone, across all 19 zones defined in Standard 169, and by whether design ITE power is above or below 300 kW. The spread is the design story: a facility over 300 kW in hot-humid climate zone 1A may spend up to 0.30 kWh of mechanical energy per kWh of IT energy, while the same facility in zone 8 is held to 0.15. Economizer-friendly climates get roughly half the allowance of the tropics, which is why free cooling stops being an efficiency nicety and becomes the compliance path in cold climates.
Addendum g, approved in January 2024 and carried into the 2025 edition, split the MLC into three segments: process cooling, process ventilation and process heating, with heat recovery subtracted from the mechanical term. Partial renovations only have to meet the limit for the segments being modified, and trade-offs between the three are allowed.
Electrical loss component (ELC)
The ELC is the fraction of incoming power lost in the distribution chain before it reaches the IT equipment, calculated from the worst-case losses of each segment of the power chain.
Two things changed here and both catch people working from older references. The incoming electrical service segment was removed, because federal transformer and feeder rules already cover it, leaving the UPS segment and the ITE distribution segment. And losses now have to be evaluated at four load points, 25%, 50%, 75% and 100%, where the earlier method used only 25%, 50% and 100%. The tables still separate single-feed UPS configurations (N, N+1) from active dual-feed (2N, 2N+1). From the 2025 edition, UPS efficiency has to be based on total available capacity including redundant online modules.
Unlike the MLC, ELC limits do not vary by climate zone. Electrical losses do not care about the weather.
The annualized compliance path
There is one mechanical compliance path left, and it is a full-year energy model. The design MLC option, a peak-condition snapshot evaluated at 100% and 50% load, was removed in the 2019 edition. ASHRAE’s own addendum describes it as a temporary provision dropped in favor of the more accurate annualized calculation.
What you have to demonstrate now is an annualized MLC, computed from TMY3 weather data using 8760 hourly bins (or bins of dry-bulb and wet-bulb at 1°C resolution), with HVAC energy calculated at 25%, 50%, 75% and 100% of the ITE load. The result has to come in at or below the Table 6.5 value for your climate zone and size band.
That shift matters for how you design. An annualized, part-load calculation rewards a system that keeps delivering air where it is needed at 40% load on a mild March afternoon, not just one that meets its numbers at design day. Nameplate efficiency will not answer that question, and neither will a load calculation.
ASHRAE TC 9.9 temperature and humidity requirements
TC 9.9’s Thermal Guidelines for Data Processing Environments, now in its 5th edition, sets the inlet conditions your cooling design has to deliver. The recommended envelope is 18 to 27°C for classes A1 through A4. The allowable envelope is wider and class-dependent, and running inside it rather than the recommended range is a deliberate trade of equipment risk against economizer hours.
| Class | Allowable dry-bulb | Allowable humidity | Allowable dew point |
|---|---|---|---|
| Recommended (A1-A4) | 18 to 27°C | 70% RH max, or 50% max where corrosive gases are present | -9 to 15°C DP |
| A1 | 15 to 32°C | 8% to 80% RH | -12 to 17°C DP |
| A2 | 10 to 35°C | 8% to 80% RH | -12 to 21°C DP |
| A3 | 5 to 40°C | 8% to 85% RH | -12 to 24°C DP |
| A4 | 5 to 45°C | 8% to 90% RH | -12 to 24°C DP |
| H1 (high density) | 5 to 25°C | 8% to 80% RH | -12 to 17°C DP |
Class H1 arrived in the 5th edition for high-density air-cooled deployments, and it runs in the opposite direction to everything else on that table. Its recommended range is 18 to 22°C, with an allowable upper limit of 25°C. A hall designed to run at 27°C to maximize free cooling hours cannot host H1 equipment without dropping supply temperature, which costs back the economizer hours the design was built around.
The 5th edition also tied recommended humidity to measured pollutant levels: up to 70% RH in low-pollutant environments, under 50% where corrosive gases are present, with 50% as the default if you are not running corrosion coupons.
Types of data center cooling equipment
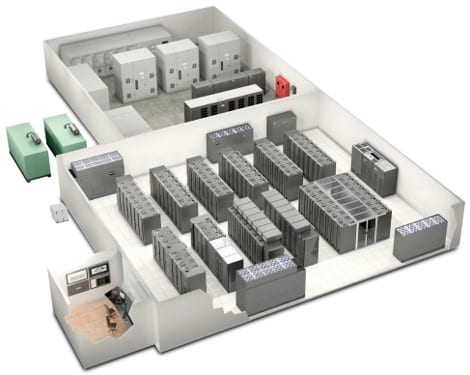
HVAC simulation covers all three families below. Cooling equipment splits by how far it sits from the heat: room-level units pushing air across a hall, row-level units sitting between racks, and chip-level systems moving liquid to the die. Density decides which one you can use.
CRAC and CRAH units
The most common types are an air conditioner (AC) or computer room air handler (CRAH) units that blow cold air in the required direction to remove hot air from the surrounding area.
The two acronyms are CRAC, a computer room air conditioner, and CRAH, a computer room air handler, and the distinction between them is the cooling source. A CRAC has its own refrigeration circuit and a compressor in the unit. A CRAH is a coil fed by a central chilled water plant, with no compressor, so it moves the refrigeration work to a chiller that can run more efficiently at scale and can be paired with a water-side economizer. CRACs suit smaller halls and retrofits where there is no plant to tie into. CRAHs suit anything large enough to justify a chilled water loop.
In-row and rack-level cooling
In-row units sit in the rack line and cool the aisle they face, shortening the air path from metres to centimetres. That shorter path is what keeps them working at densities where room-level supply starts losing the fight against mixing. Rear-door heat exchangers go one step further and put the coil on the back of the cabinet, so the rack exhausts room-temperature air.
Direct-to-chip liquid cooling and CDUs
Direct-to-chip cooling puts a cold plate on the processor and a coolant distribution unit (CDU) between the facility water loop and the technology cooling loop. TC 9.9 classifies the facility water loop by supply temperature, from W17 through W45 and W+ above that, because the CDU sits between the two loops and the technology-side temperature runs warmer than the facility water feeding it.
Immersion cooling
Immersion removes air from the thermal path completely by submerging the hardware in a dielectric fluid, which is why it scales past the densities air can reach. Submer validated its immersion tank designs this way.
Liquid cooling systems provide an alternative way to dissipate heat from the system. This approach includes air conditioners or refrigerants with cold water close to the heat source.
Airflow management and containment
Airflow management is where most air-cooled halls lose their efficiency, because supply air that never reaches an inlet still costs the same to produce. Three failures account for most of it: bypass air returning to the CRAH without doing work, recirculation pulling hot exhaust back to an inlet, and stratification leaving the top of the rack starved.
Hot aisle and cold aisle
The cold air (or aisle) is passed to the front of the server racks and the hot air comes out of the rear side of the racks. The main goal here is to manage the airflow in order to conserve energy and reduce cooling cost.
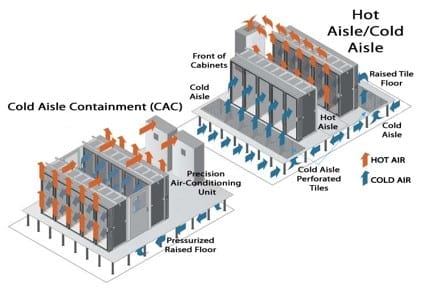
Containment
Containment of the hot/cold aisles is done mainly to separate the cold and hot air within the room and remove hot air from cabinets.
Containment is what converts an aisle arrangement into an actual air path. Without it, the aisle layout is a convention that buoyancy can overrule, which is exactly what the case study below shows happening.
Raised floor and underfloor plenum
A raised floor turns the void into a supply plenum, with cold air entering the room through perforated tiles in front of the racks. Its capacity is finite and it sets a hard limit on rack density, because a floor tile can only pass so much air.
Free cooling and economizers
Economizers are the mechanism that makes the 90.4 mechanical limits achievable in most climate zones. ASHRAE’s own fact sheet for the 2022 edition lists compliance without economizers as possible where TC 9.9 guidelines are followed, so the annualized calculation decides, not a prescriptive rule.
Green cooling (or free cooling) is one of the sustainable technologies used in data centers. This could involve simply opening a data center window covered with filters and louvers to allow natural cooling techniques. This approach saves a tremendous amount of money and energy.
Three approaches carry most projects. Air-side economizers bring in filtered outside air directly, which is the cheapest option and the one most exposed to the pollutant and humidity limits above. Water-side economizers use a cooling tower to make chilled water without running the compressor, keeping the air loop closed. Evaporative and adiabatic systems trade water for electricity, which is a live trade-off now that 90.4-2025 has widened its purpose to balance energy against water consumption and greenhouse gas emissions.
Where air cooling stops working
Air cooling runs out at around 40 to 50 kW per rack, and the constraint is airflow rather than any thermal limit. ASHRAE TC 9.9 makes the argument in cfm: a 40 to 50 kW rack needs up to 5,000 cfm, while a best-of-breed raised floor delivers roughly 1,900 cfm per floor tile. Containment tightens the path, it does not manufacture supply air.
Most halls are nowhere near that line. Uptime’s 2025 survey puts the average of operators’ most common rack densities at nearly 9 kW, with 4 to 5 kW the single most frequent answer, and 82% of facilities peaking below 30 kW even in their densest racks. Air cooling with good containment covers that estate comfortably.
The other end of the range is where the constraint bites. An NVIDIA GB200 NVL72 rack runs at a nominal 132 kW with a peak draw near 192 kW, which is what the busway has to be sized for, and a GB300 NVL72 rack draws 132 to 140 kW with roughly 90% of that heat going to liquid and 10% to air. These ship liquid-cooled by design, which is why a facility taking on AI workloads is planning a hybrid hall rather than choosing between air and liquid.
Four engineering teams that have already built for these densities describe what simulation caught first, including the move to 50 kW GPU racks. The awkward middle is where CFD earns its place. Between about 15 and 50 kW per rack, whether air cooling works depends on the specific geometry: tile placement, containment integrity, ceiling height, return path. That is a question about your room, and no rule of thumb answers it.
Measuring data center cooling efficiency: PUE and MLC
PUE is total facility energy divided by IT equipment energy, and it is the number the industry benchmarks on even though it is not a compliance metric. A PUE of 1.5 means half a watt of overhead for every watt of computing.
Uptime Institute’s 2025 survey puts the measured industry weighted average at 1.54, the sixth consecutive year it has effectively stood still. Facilities commissioned within the last five years average 1.48, and large facilities above 20 MW reach 1.44.
The same modelling approach is what lets a team reduce data center power consumption without cutting capacity. PUE and MLC answer different questions and both are worth tracking. PUE covers all overhead, mechanical plus electrical, and is measured in operation. MLC covers the mechanical share only, is calculated at design stage, and has a limit attached. A design can hit a good PUE target and still fail its MLC if the cooling plant is carrying more of the overhead than the climate zone allows.
Water usage effectiveness (WUE) is the companion metric, and it matters more since 90.4-2025 brought water consumption into the standard’s stated purpose.
How to size a data center cooling load
Data center cooling load is dominated by IT equipment, which converts effectively all of its electrical draw into heat. Start there and the rest is a set of adders.
- IT load. Sum the design power of the equipment, not the nameplate rating of the PDUs. Nameplate typically overstates real draw by a wide margin, and sizing to it is the most common route to an oversized plant that runs badly at part load.
- Electrical losses. UPS and distribution losses land in the room as heat. Your ELC calculation already produced this number.
- Envelope and infiltration. Small in a windowless core, non-trivial in a converted space.
- Lighting and people. Small next to the IT load, but not zero in a staffed hall.
- Redundancy. N+1 or 2N changes the equipment count and the part-load profile, not the load itself. It is the part-load profile that decides your annualized MLC.
The sum gives you a design-day load. It does not give you an air path, a temperature distribution, or an answer to whether every inlet stays inside the TC 9.9 envelope. That is the gap the next two sections close.
Design strategies to reduce data center energy consumption
Three decisions carry most of the energy outcome: where you put the facility, how you structure the infrastructure, and which cooling strategy you run. The first two are usually settled before the HVAC engineer arrives, which leaves the third doing the work.
Designing a new data center facility or changing an existing one to maximize cooling efficiency can be a challenging task. Design strategies to reduce the energy consumption of a data center include:
- Positioning data centers based on environmental conditions (geographical location, climate, etc.)
- Design decisions based on infrastructure topology (IT infrastructure and tier standards)
- Adapting best cooling system strategies
Improving the data center cooling system configuration is a key opportunity for the HVAC design engineer to reduce energy consumption. Identifying the right combination of the cooling techniques above can be challenging. Here’s how CFD simulation can make this task easier.
Verifying ASHRAE 90.4 compliance with CFD
CFD answers the question the compliance calculation assumes: whether the air you paid to cool actually reaches an equipment inlet. Layout changes that leave total capacity untouched can move rack inlet temperatures by tens of degrees, and the case study below is one of them.
Any number of different cooling system design strategies or floor layout variations can affect the results, thereby changing efficiency, creating hotspots or altering the amount of infrastructure required for the design. Computational fluid dynamics (CFD) offers a method of evaluating new designs or alterations to existing designs before they are implemented in accordance with ASHRAE data center standards.
The annualized MLC path is what makes this more than a nice-to-have. A part-load, full-year calculation depends on how the air actually moves at every operating point, and a spreadsheet cannot tell you that a containment gap is short-circuiting 15% of your supply air at 40% load. Sensor-based monitoring will tell you, but only after the room is built and the hardware is in it.
CFD can help HVAC engineers and data center designers to model a virtual data center and investigate the temperature, airflow velocity and pressure fields in a fast and efficient way. The numerical analysis presents both 3D visual contouring and quantitative data that is highly detailed yet easy to comprehend. Areas of complex recirculating flow and hotspots are easily visualized to help identify potential design flaws. Implementing different design decisions and strategies into the virtual model is relatively simple and can be simulated in parallel.
Design Management Group runs exactly this way, and reports a 35% reduction in project costs from moving its data center work to cloud-native CFD. With a cloud-native platform there is no workstation to specify and no solver license to schedule around, so comparing four containment strategies means running four simulations at once from a browser rather than four in sequence overnight. Data center cooling simulation covers the workflow from CAD or BIM import through to rack-level inlet temperatures.
Watch: designing a data center cooling system for ASHRAE 90.4
See how CFD is used to test cooling strategies and validate a raised floor design against ASHRAE 90.4.
Case study: improving data center cooling systems
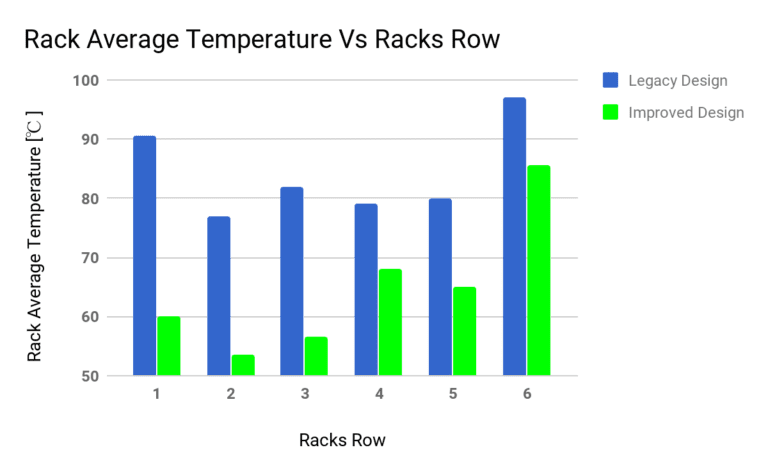
Adding hot aisle containment and a lowered ceiling to a raised-floor hall cut average rack temperature by 23% and cooling energy by 63% in simulation. The mechanism behind both numbers is the same: containment stops buoyancy-driven recirculation from starving the top of the rack.
Project overview
The study compares two data center cooling system designs, their cooling efficiency, and energy consumption.
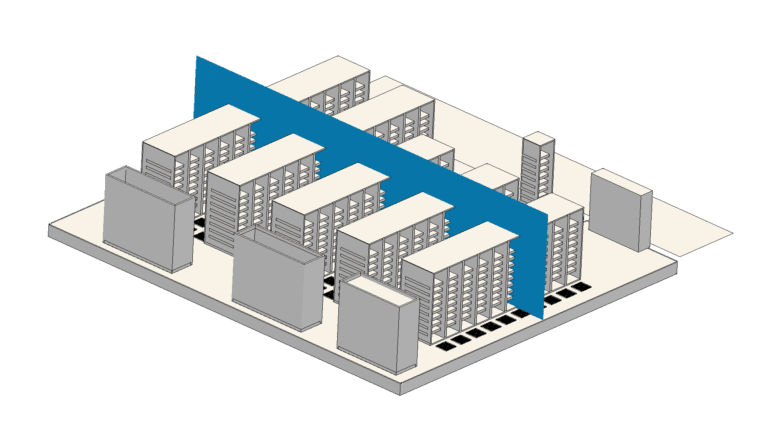
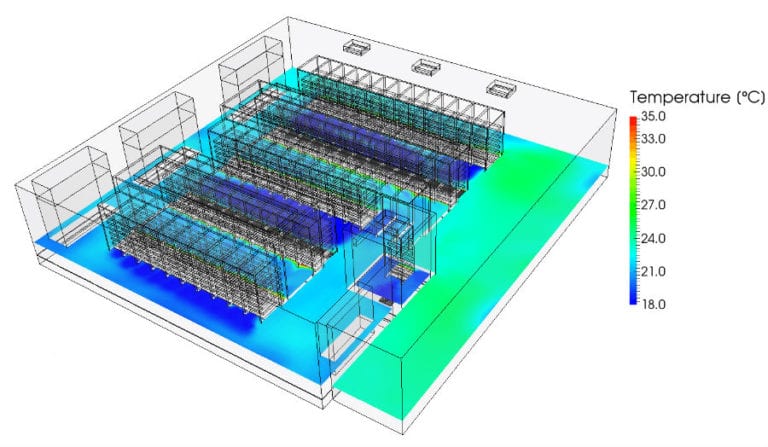
The first design that we will consider uses a raised floor configuration, a cooling system that is frequently implemented in data centers. When this technique is used, cold air enters the room through the perforated tiles in the floor and in turn cools the server racks. Additionally, the second model uses hot aisle containment and lowered ceiling configuration to improve the cooling efficiency. We will use CFD to predict and compare the performance of the two designs and determine the best cooling strategy.
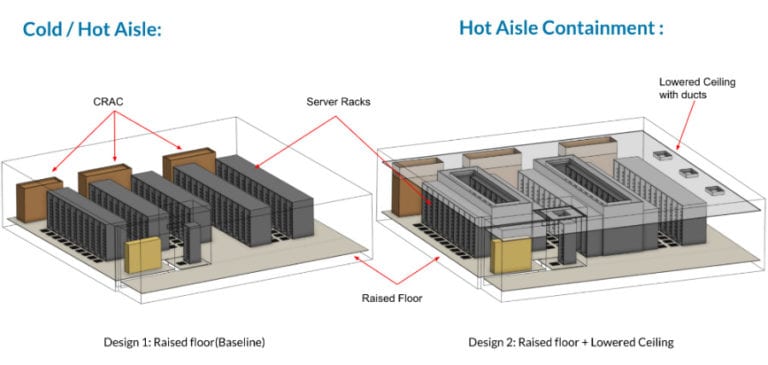
Baseline design
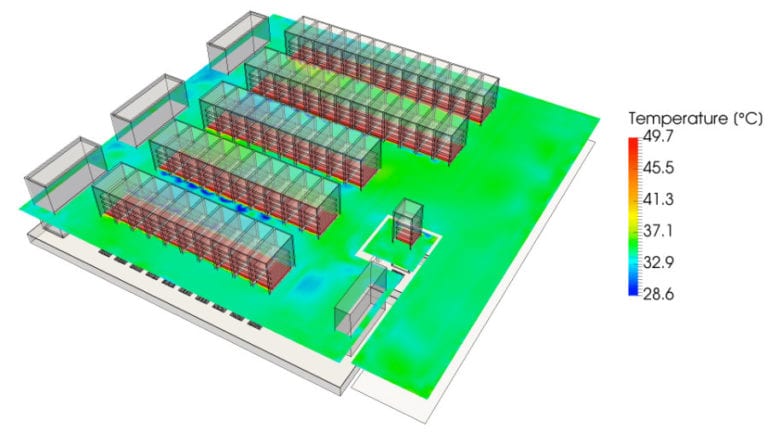
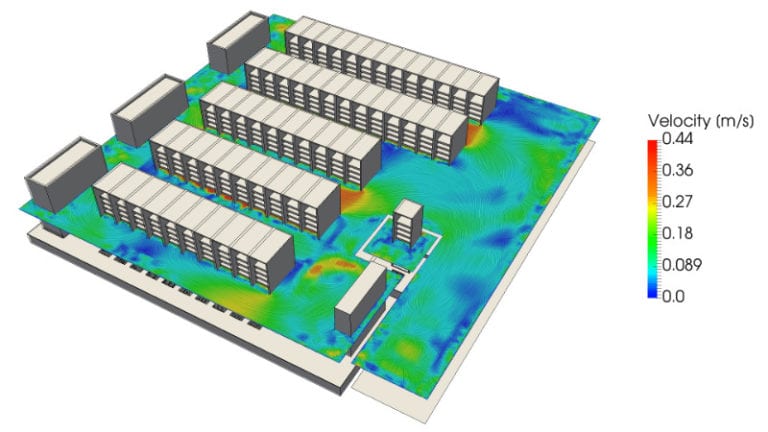
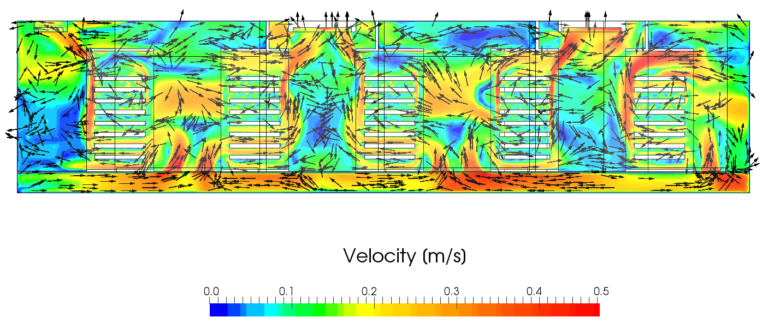
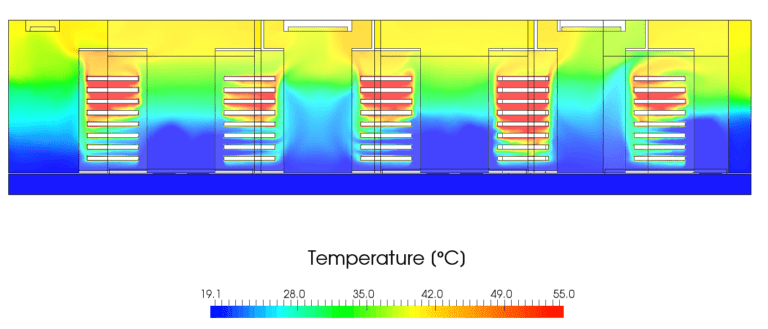
The baseline hall runs at a maximum velocity of 0.44 m/s with a temperature range of 28.6 to 49.7°C, and hot air is present in the cold aisle.
We investigated the temperature distribution and the velocity field inside of the server room for both design configurations. The post-processing images below show the velocity and temperature fields for the midsection of the baseline design. It can be observed that the hot air is present in the region of the cold aisle. This is due to the mixing of both the cold and hot aisles within the data center surrounding.
The temperature contour shows that the zones between the two server racks are much more cooled in comparison with the others. The reasons for this can be understood by looking at the flow patterns.
It is evident in the above image that in the server rows where inlets are present, the top of the racks sees a descending flow direction, instead of the desirable ascending flow from the inlets themselves. This is due to the strong recirculation currents driven by thermal buoyancy forces. This effect is very undesirable, as it reduces the cooling effectiveness specifically for the top shelves of the server racks. This effect could be minimized by allowing for proper airflow above the racks, either by increasing the ceiling height, placing more distributed outlets on the ceiling, or using some kind of active flow control system (fans) to direct the flow above the server racks. Or more simply, by preventing the hot air coming from the racks from freely circulating.
The temperature plot shows a significant temperature stratification which is to be expected given the large recirculation currents. We can observe that only the lowermost servers are receiving appropriate cooling.
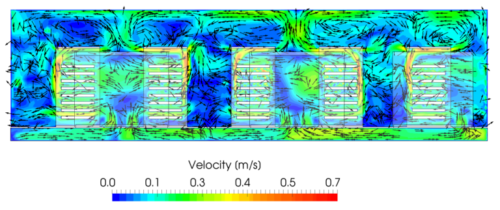
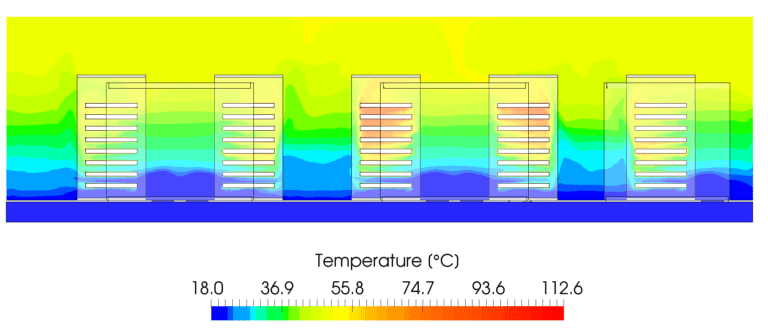
At 49.7°C, the top of the baseline rack sits above the allowable ceiling of every TC 9.9 air-cooled class, including A4 at 45°C, and far above the recommended 18 to 27°C range. A design-day load calculation would not have shown that, because the total cooling capacity was never the problem.
Improved design
Containment removes the recirculation path, and both the temperature distribution and the energy number follow from that.
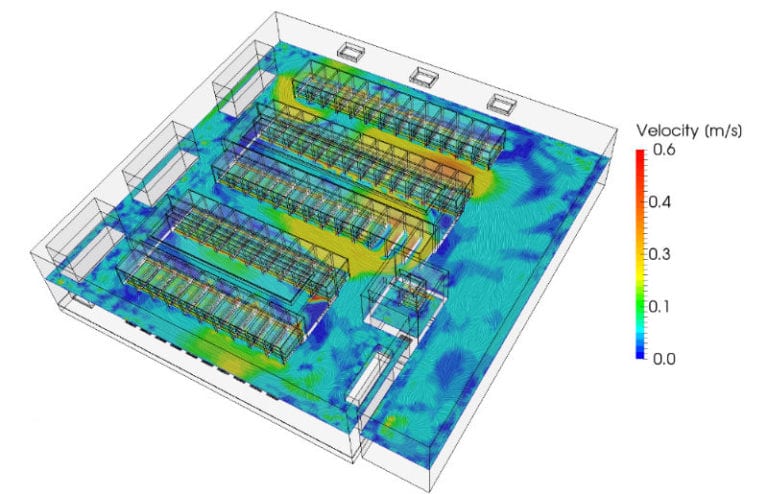
The velocity field shows that the flow is now driven to the outlets. This is due to the presence of containment on top of the racks. This also results in a better temperature distribution. The cold zones between the server racks are particularly extended.
The above image shows how the hot containment prevents the ascending flow from recirculating back to the inlet rows. This results in a cleaner overall flow pattern compared to what was seen in the previous design. It is also evident that the new design reduces temperature stratification, particularly in the contained regions between the servers.
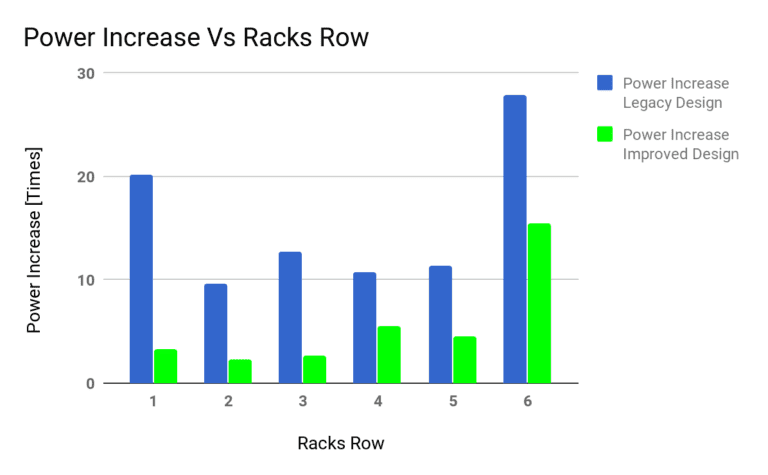
The average temperature calculated for each rack is lower for the improved design by about 23%.
This is also reflected in the decrease in the amount of power that has to be supplied to the server to prevent overheating. On average, energy savings of 63% for the data center cooling system have been achieved.
Conclusions
Compliance with ASHRAE 90.4 is an annual energy calculation, and the design that passes it is the one that delivers air where it is needed at every load point, not just at design day. The two numbers the standard asks for, MLC and ELC, are outputs of the design rather than checks you apply to it.
This case study was just a small illustration of how CFD simulation can help designers and engineers validate their design decisions and accurately predict the performance of their data center cooling systems to ensure no energy is wasted, and in accordance with ASHRAE data center standards. The whole analysis was done in a web browser and took only a few hours of manual and computing time.
Frequently asked questions
References
ANSI/ASHRAE Standard 90.4, Energy Standard for Data Centers, currently in its 2025 edition. It applies where floor space exceeds 20 W/ft² and IT load exceeds 10 kW. ASHRAE 90.1 still governs the envelope, lighting and service water heating, and ASHRAE TC 9.9 publishes the thermal guidelines for equipment inlet conditions.
ASHRAE TC 9.9 recommends 18 to 27°C at the equipment inlet for air-cooled classes A1 through A4. Allowable ranges are wider and class-dependent, from 15 to 32°C for A1 up to 5 to 45°C for A4. High-density class H1 equipment needs a narrower 18 to 22°C.
A CRAC unit has its own refrigeration circuit with a compressor inside the unit. A CRAH unit is a coil fed by a central chilled water plant and has no compressor. CRAHs suit larger facilities with a chilled water loop and can be paired with a water-side economizer; CRACs suit smaller halls and retrofits.
Start from the design power of the IT equipment, which converts effectively all of its draw to heat, then add UPS and distribution losses, envelope gains, and lighting and occupancy. Use design power rather than PDU nameplate ratings, which overstate real draw and lead to plant that runs poorly at part load.
Around 40 to 50 kW per rack, where the required airflow of up to 5,000 cfm exceeds what a raised floor can deliver at roughly 1,900 cfm per tile. Current AI racks draw 125 to 140 kW and ship liquid-cooled by design.
Power usage effectiveness is total facility energy divided by IT equipment energy. The measured industry average is 1.54. PUE is an operational benchmark, not a compliance metric; 90.4 uses MLC and ELC instead.
- ANSI/ASHRAE Standard 90.4-2025, Energy Standard for Data Centers
- ASHRAE Standard 90.4-2022 fact sheet, ASHRAE Government Affairs
- Addendum g to ANSI/ASHRAE Standard 90.4-2022, approved 31 January 2024
- Addendum h to ANSI/ASHRAE Standard 90.4-2019, approved 8 November 2022
- ASHRAE TC 9.9, Thermal Guidelines for Data Processing Environments, 5th edition, 2021
- ASHRAE TC 9.9, Emergence and Expansion of Liquid Cooling in Mainstream Data Centers, 2021
- International Energy Agency, Energy and AI, 2025
- Lawrence Berkeley National Laboratory, 2024 United States Data Center Energy Usage Report, December 2024
- Uptime Institute, Global Data Center Survey 2025