
ASCE 7 will give you a wind load number for almost any building you design, and for a rectangular tower on flat ground that number is good enough to build from. The problem starts when the geometry stops being rectangular. Tapered facades, setbacks, podium roofs, a neighboring tower 100 ft (30 m) upwind: the code’s pressure coefficients were never derived for any of it. The further your design sits from the shapes in the tables, the less those coefficients tell you about the pressures the building will actually see, in either direction. Wind load analysis is how you find out.
This article covers both halves of the job. First the code procedure, in full, with a worked example you can check your own numbers against. Then the cases where the code hands off to physical testing, and where simulation earns its place before that.
Run your first wind load analysis today
Compare shape options before you commit to a tunnel campaign. No hardware to provision, no license to check out.
What is wind load analysis?
Wind load analysis is the evaluation of the pressures and forces wind exerts on a structure, and of the structural response those forces produce. It has two outputs: a set of design pressures for the structural frame and the facade, and an assessment of how the building moves under fluctuating wind.
Two things drive whether you need to go beyond a code calculation. The first is height. As buildings get taller and more slender, crosswind response and occupant acceleration start to govern the design, and the static pressure check stops being the binding one. The second is location. In coastal and hurricane-prone regions, even a conventional low-rise has to be checked against design wind speeds that inland sites never see.
The work sits with architects and structural engineers together, because the two changes that reduce wind load most are both architectural: the shape of the building and the treatment of its corners. Settle them during massing and building aerodynamics stays a design conversation. Leave them and it becomes a remedial one.
How wind load acts on a building
Wind produces positive pressure on the windward face, suction on the side walls, the leeward face and most roof surfaces, and a fluctuating crosswind force from the vortices shedding off the building’s sides. Design has to answer for all three.
Pressure loads on the structure and facade
Pressure analysis, mean and peak, identifies the positive and negative pressures on the envelope, which sets facade and cladding specification and shows where reinforcement is needed. Peaks concentrate at corners, parapets, roof edges and any discontinuity in the facade, and they can run several times higher than the pressure averaged over a wall. Peak suction is a gust quantity, so it comes either from the code’s gust-inclusive coefficients or from an unsteady analysis.
For simple rectangular forms the code tables give these pressures directly. For complex shapes, wind tunnel testing or numerical analysis is the only way to get them with any confidence, because the tabulated coefficients come from a small family of test geometries that your building probably is not part of.
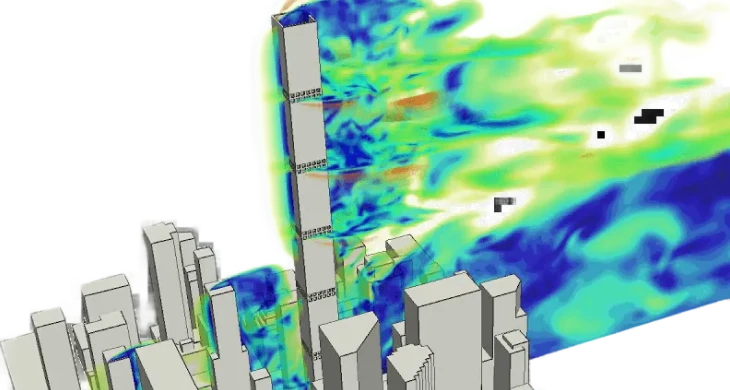
Dynamic wind loads and vortex shedding
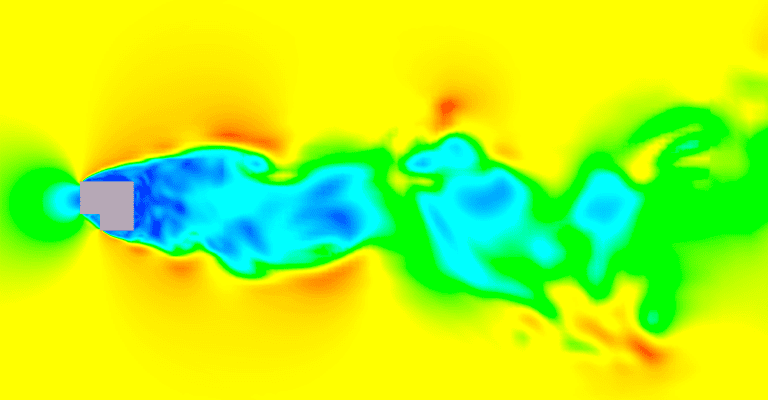
For slender towers with low damping, crosswind response from vortex shedding often governs. Vortices peeling alternately off each side of the building induce an oscillating crosswind force at a shedding frequency set by the wind speed and the building width. If that frequency approaches the structure’s natural frequency, the response amplifies, and the outcome ranges from occupant discomfort to structural damage.
This is why slender towers get a lock-in check on top of the peak pressure check. ASCE 7-16 makes this explicit: Section 27.1.2 sends buildings whose response is subject to across-wind loading, vortex shedding, galloping or flutter to Chapter 31 rather than the analytical procedures. A tower can satisfy every static pressure requirement in the code and still generate motion complaints on every windy afternoon.
How to calculate wind load on a building to ASCE 7
ASCE 7-16 calculates design wind pressure in two stages: convert the site wind speed into a velocity pressure at height, then multiply by pressure coefficients for the surface and system you are designing. The full procedure is five steps.
A note on editions before the formulas. Everything below is written to ASCE 7-16, the edition referenced by the 2018 and 2021 IBC. The 2024 IBC references ASCE 7-22, which moved the directionality factor K_d out of the velocity pressure equation and into the design pressure equations, revised the wind speed maps in hurricane-prone regions, and revised the terrain exposure constants. Check which edition your jurisdiction has adopted before you use these expressions.
Step 1: Risk category and basic wind speed
Assign a risk category (I to IV) from the building’s occupancy and consequence of failure, then read the basic wind speed V for your site from the map for that risk category. ASCE 7-16 publishes four maps, one per risk category, at mean recurrence intervals of 300, 700, 1,700 and 3,000 years respectively. The 3,000-year Risk Category IV map is new in ASCE 7-16; through ASCE 7-10, Risk Categories III and IV shared the 1,700-year map.
V is a 3-second gust speed at 10 m (33 ft) above ground in Exposure C. The maps are contour plots, so use the ASCE 7 Hazard Tool on the actual site coordinates. A published range will not do. As a rough sense of scale for Risk Category II: mid-90s mph across much of the non-hurricane West, 107 to 115 mph over most of the interior and eastern US, rising to roughly 170 to 180 mph on the coastal South Florida contours. Special wind regions need site-specific analysis.
One trap worth naming. From ASCE 7-10 onward the maps are strength-level, so the wind load factor in LRFD combinations is 1.0. The 1.6 factor belongs with the service-level maps in ASCE 7-05. For an allowable-stress-level speed, ASCE 7 gives V_asd = V_ult × √0.6.
Step 2: Exposure category and the velocity pressure exposure coefficient K_z
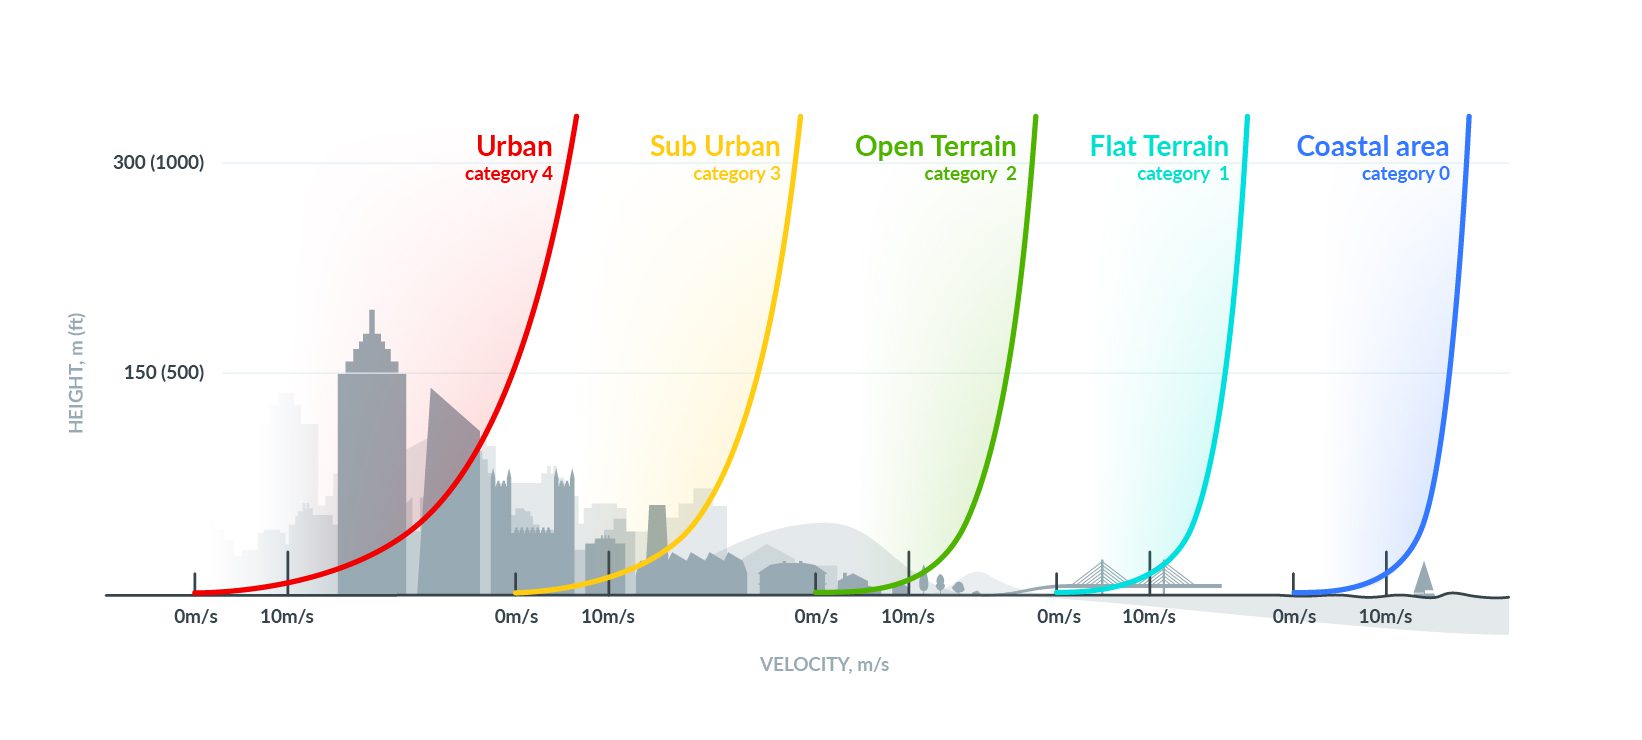
Pick the exposure category from the upwind surface roughness and fetch, then compute K_z to scale the velocity pressure from the 33 ft Exposure C reference condition to the height and exposure you care about.
- Exposure B: urban and suburban terrain, wooded areas, or other terrain with closely spaced obstructions the size of single-family dwellings or larger. Requires that roughness upwind for at least 2,600 ft or 20 times the building height, whichever is greater (1,500 ft for buildings 30 ft or shorter)
- Exposure C: open terrain with scattered obstructions under 30 ft, including flat open country and grassland. The default where neither B nor D applies
- Exposure D: flat unobstructed areas and water surfaces, including smooth mud flats, salt flats and unbroken ice. Requires that roughness upwind for more than 5,000 ft or 20 times the building height, whichever is greater
The 20h fetch clause is the one people miss. A 400 ft tower needs 8,000 ft of Exposure D roughness upwind, not 5,000 ft. Exposure A, for large city centers, was eliminated in ASCE 7-02; ASCE 7-98 was the last edition to carry it. If a reference still lists Exposure A, that reference is out of date.
K_z comes from ASCE 7-16 Table 26.10-1, or from the equation in its footnotes:
$$ K_z = 2.01 \left( \frac{z}{z_g} \right)^{2/\alpha} \quad \text{for } 15\ \text{ft} \le z \le z_g $$
$$ K_z = 2.01 \left( \frac{15}{z_g} \right)^{2/\alpha} \quad \text{for } z < 15\ \text{ft} $$
Terrain exposure constants come from Table 26.11-1. For ASCE 7-16: Exposure B, α = 7.0 and z_g = 1,200 ft; Exposure C, α = 9.5 and z_g = 900 ft; Exposure D, α = 11.5 and z_g = 700 ft. These constants were revised in ASCE 7-22, so do not carry them across editions.
Step 3: Velocity pressure q_z
Velocity pressure is dynamic pressure scaled by K_z for height and exposure, then corrected by three site factors. In ASCE 7-16:
$$ q_z = 0.00256 \, K_z K_{zt} K_d K_e V^2 \quad [\text{lb/ft}^2,\ V \text{ in mph}] $$
The four factors:
| Factor | Name | Typical value | Source |
|---|---|---|---|
| K_z | Velocity pressure exposure coefficient | roughly 0.57 to 1.9 across the range of the table | Table 26.10-1 |
| K_zt | Topographic factor | 1.0 on flat terrain; higher on hills, ridges and escarpments, where K_zt = (1 + K_1 K_2 K_3)² | Figure 26.8-1 |
| K_d | Wind directionality factor | 0.85 for buildings, MWFRS and C&C alike | Table 26.6-1 |
| K_e | Ground elevation factor | 1.0 at sea level, and permitted to be taken as 1.0 at any elevation | Table 26.9-1 |
K_e is the newest of the four. It was carried in the Commentary of earlier editions and brought into the body of the Standard in ASCE 7-16.
Use q_z evaluated at height z for the windward wall, and q_h evaluated at mean roof height h for the side walls, leeward wall and roof.
Step 4: Design pressure for the main wind force resisting system
For the Directional Procedure in ASCE 7-16 Chapter 27 Part 1, which applies to enclosed, partially enclosed and open buildings of all heights, rigid or flexible:
$$ p = q G C_p – q_i (GC_{pi}) $$
- G, the gust effect factor, is permitted to be taken as 0.85 for rigid buildings, meaning a fundamental frequency of 1 Hz or higher
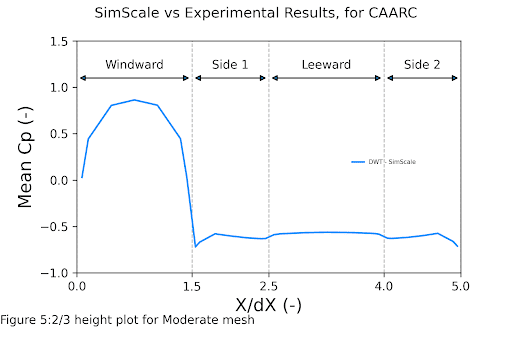
- C_p, the external pressure coefficient, comes from Figure 27.3-1: +0.8 windward wall, -0.7 side walls, and for the leeward wall -0.5 at L/B of 0 to 1, -0.3 at L/B of 2, and -0.2 at L/B of 4 or more, interpolating linearly between
- GC_pi, the internal pressure coefficient, is ±0.18 for enclosed buildings and ±0.55 for partially enclosed buildings, from Table 26.13-1. Both signs have to be checked, because internal pressure adds to the worst case on one surface and subtracts on another
Low-rise buildings have the option of the Envelope Procedure in Chapter 28, where p = q_h[(GC_{pf}) – (GC_{pi})] and the pressure coefficients are already gust-inclusive. ASCE 7 defines low-rise as mean roof height of 60 ft or less and no greater than the least horizontal dimension, so a 50 ft tall, 20 ft wide building is not low-rise.
Step 5: Components and cladding
Components and cladding use higher pressure coefficients than the MWFRS. C&C coefficients are keyed to effective wind area, so a window or a single fastener picks up the full local peak, while MWFRS coefficients are whole-surface values that already carry the spatial averaging across the frame. Chapter 30 covers this:
$$ p = q_h[(GC_p) – (GC_{pi})] \quad \text{for low-rise buildings, Chapter 30 Part 1} $$
$$ p = q(GC_p) – q_i(GC_{pi}) \quad \text{for buildings over 60 ft, Chapter 30 Part 3} $$
GC_p depends on the effective wind area and on which roof or wall zone the element sits in, with corner and edge zones carrying the highest suction. Skipping the C&C check is how facade failures happen on buildings whose frames were designed correctly.
Worked example: 120 ft office tower, Exposure C, 115 mph
Take an enclosed office building 120 ft tall with a 40 ft by 80 ft plan, on flat open terrain at sea level, wind normal to the 80 ft face.
Inputs: Risk Category II, V = 115 mph, Exposure C, K_zt = 1.0, K_e = 1.0, K_d = 0.85, G = 0.85, GC_pi = ±0.18.
K_z at mean roof height (120 ft, Exposure C):
$$ K_z = 2.01 \left( \frac{120}{900} \right)^{2/9.5} = 1.315 $$
Table 26.10-1 gives 1.31 at 120 ft, so the formula and the table agree to within a rounding step.
Velocity pressure:
$$ q_h = 0.00256 \times 1.315 \times 1.0 \times 0.85 \times 1.0 \times 115^2 = 37.8\ \text{lb/ft}^2 $$
Windward wall at z = h, C_p = +0.8:
$$ p = 37.8 \times 0.85 \times 0.8 = 25.7\ \text{lb/ft}^2 \ \text{(external)} $$
With internal pressure at ±0.18 × 37.8 = ±6.8 lb/ft², the windward wall design pressure at roof height is 32.5 lb/ft² with internal suction, or 18.9 lb/ft² with internal pressure. This is the top-of-wall value. K_z and therefore q_z are smaller at every level below, so applying 32.5 lb/ft² over the full height is conservative.
Leeward wall, L/B = 40/80 = 0.5, so C_p = -0.5:
$$ p = 37.8 \times 0.85 \times (-0.5) = -16.1\ \text{lb/ft}^2 \ \text{(external)} $$
Net along-wind pressure on the MWFRS: internal pressure cancels between windward and leeward faces, so the net is 25.7 + 16.1 = 41.8 lb/ft², giving a total base shear of 41.8 × 80 × 120 ≈ 401 kip if the pressure is taken uniformly over the full height. In practice windward pressure varies with height through K_z, so the frame is loaded floor by floor with q_z at each level.
Wind load calculation in SI units
The same ASCE 7-16 equation in SI, with q in N/m² and V in m/s:
$$ q_z = 0.613 \, K_z K_{zt} K_d K_e V^2 $$
Running the worked example in SI: V = 115 mph = 51.4 m/s, z = 36.6 m, K_z = 1.315, so q_h = 0.613 × 1.315 × 0.85 × 51.4² = 1,811 N/m², which is 1.81 kPa. That matches 37.8 lb/ft² to the third digit.
Wind load coefficients at a glance
| Symbol | Name | What it accounts for | ASCE 7-16 reference |
|---|---|---|---|
| V | Basic wind speed | 3-second gust at 10 m, by risk category | Figures 26.5-1, 26.5-2 |
| K_z | Velocity pressure exposure coefficient | Height above ground and terrain roughness | Table 26.10-1 |
| K_zt | Topographic factor | Speed-up over hills, ridges and escarpments | Figure 26.8-1 |
| K_d | Wind directionality factor | Reduced probability of peak wind aligning with the worst direction | Table 26.6-1 |
| K_e | Ground elevation factor | Air density reduction with site elevation | Table 26.9-1 |
| G | Gust effect factor | Along-wind dynamic amplification | Section 26.11 |
| C_p | External pressure coefficient | Surface pressure distribution by geometry | Figure 27.3-1 |
| GC_pi | Internal pressure coefficient | Internal pressure from envelope permeability | Table 26.13-1 |
| GC_p | External C&C pressure coefficient | Local pressure peaks by zone and effective wind area | Chapter 30 figures |
Wind load calculation to Eurocode EN 1991-1-4
Eurocode reaches design pressures by a different route: it folds the gust into the pressure itself through a peak velocity pressure, and handles dynamic response separately through the structural factor. The numbers the two codes produce for the same building are not the same, because the reference speeds, averaging times, roughness models and coefficients all differ.
The chain runs basic wind velocity, mean wind velocity, peak velocity pressure, surface pressure:
$$ v_b = c_{dir} \cdot c_{season} \cdot v_{b,0} $$
$$ v_m(z) = c_r(z) \cdot c_o(z) \cdot v_b, \quad c_r(z) = k_r \ln\left(\frac{z}{z_0}\right) $$
$$ q_p(z) = \left[1 + 7 I_v(z)\right] \cdot \tfrac{1}{2} \rho \, v_m^2(z) $$
$$ w_e = q_p(z_e) \cdot c_{pe}, \qquad w_i = q_p(z_i) \cdot c_{pi} $$
Air density ρ is recommended as 1.25 kg/m³, and the terrain factor is k_r = 0.19 (z_0 / z_{0,II})^{0.07} with z_0,II = 0.05 m. The roughness expression holds for z_min ≤ z ≤ 200 m; below z_min, take c_r(z) = c_r(z_min). Terrain roughness and z_min come from Table 4.1:
| Terrain category | Description | z_0 (m) | z_min (m) |
|---|---|---|---|
| 0 | Sea or coastal area exposed to open sea | 0.003 | 1 |
| I | Lakes or flat area with negligible vegetation and no obstacles | 0.01 | 1 |
| II | Low vegetation such as grass, isolated obstacles | 0.05 | 2 |
| III | Regular cover of vegetation or buildings, suburbs | 0.3 | 5 |
| IV | At least 15% of surface covered with buildings over 15 m mean height | 1.0 | 10 |
Two mapping notes for anyone moving between the codes. Eurocode’s c_pe,10 for loaded areas of 10 m² or more is the rough equivalent of ASCE’s MWFRS coefficients, and c_pe,1 for areas of 1 m² or less corresponds to components and cladding. Where internal volume and permeability cannot be assessed reliably, take c_pi as the more onerous of +0.2 and -0.3. Vertical walls of rectangular-plan buildings are divided into pressure zones A to E, and dynamic response is carried by the structural factor c_s c_d.
National Annexes override several of these recommended values, so confirm against the annex for the country you are building in.
Where code calculations stop: wind tunnel and CFD
The code procedures are calibrated on a limited set of building shapes, and ASCE 7 recognizes one alternative when your building falls outside them: the Wind Tunnel Procedure in Chapter 31, with test conditions governed by ASCE 49.
Be clear about what that means for simulation. ASCE 7 does not list computational methods among its permitted procedures for determining design wind loads, and CFD results on their own are not a code-compliant substitute for Chapters 26 to 30 or for a Chapter 31 wind tunnel study. SimScale has written about this in detail: for code submittal, the calculation or the tunnel is what counts.
What CFD is for is the design decision that happens before submittal. The situations where code coefficients are least reliable are exactly the ones where the design levers are still open:
- Tapered, twisted or setback towers, where no tabulated C_p applies
- Interference from neighboring buildings, which ASCE 7 has no explicit provisions for and which EN 1991-1-4 treats only coarsely in Annex A.4
- Crosswind and torsional response on slender forms
- Local peak suction at corners, parapets, balconies and canopies
- Comparing corner treatments or shape options before committing to a tunnel campaign
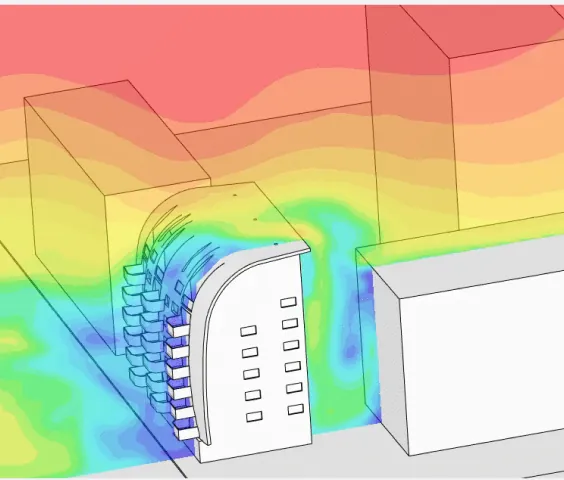
Wind tunnel testing answers the same questions with code standing, at a cost and lead time that means you get one or two geometries, late. CFD answers them for as many geometries as you want, early, and the tunnel then confirms the option you chose. The CAARC facade pressure validation case shows how close the two methods sit on surface pressure for a standard tall-building geometry, and SimScale’s pedestrian wind comfort validation study does the same for the velocity field against wind tunnel and field measurements.
Wind load analysis with CFD
CFD models a virtual wind tunnel numerically, and returns pressure, force and velocity fields across the whole domain. A physical model gives you data only at the pressure taps you instrumented. Separation and recirculation are captured in the flow field, and the atmospheric boundary layer is imposed directly as an inlet profile, which makes multi-direction runs driven by a wind rose a setup choice rather than a new test campaign.
Solver choice matters here. Steady RANS gives you mean surface pressures cheaply and is what you want for a shape comparison. Unsteady shedding, crosswind response and peak suction need a transient run, and the lattice-Boltzmann method is what makes those tractable at building scale on cloud hardware.
For a working engineer the practical difference is iteration count. A virtual wind tunnel running in the browser puts wind load analysis inside a design cycle instead of at the end of one.
Thornton Tomasetti, a global engineering consultancy with more than 1,500 staff, built exactly that into their own workflow. Their CORE Studio team wrapped the SimScale API in an in-house digital wind tunnel app that runs from Rhino, so wind loading is available to designers who are not CFD specialists.

Jeroen Janssen
Associate Director, Thornton Tomasetti

“We wanted to develop and distribute an app within our office, powered by the SimScale API, so more of our users could run a simulation, especially at the earlier design stages. For example, we can look at very tall buildings and use CFD early on to get an understanding of wind loading, then use this in design, go through multiple iterations and feed those results back into the structural analysis.”
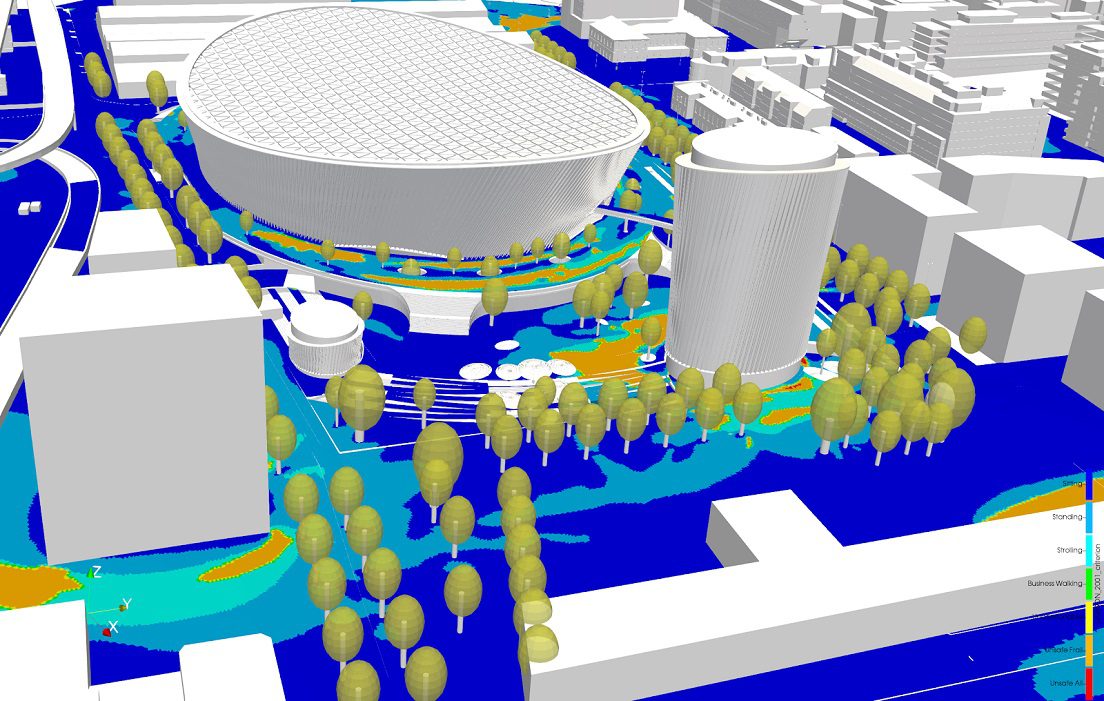
Project spotlight: vortex shedding on a 50-story tower
We ran a 50-story tower at 45 m/s to see how much corner geometry changes the crosswind load. The tower is 150 m tall on a fixed 20 m by 20 m square base. Two designs: an initial version with sharp corners, and a second with the corners rounded. Both use a transient incompressible turbulent flow analysis, because the quantity of interest is unsteady.
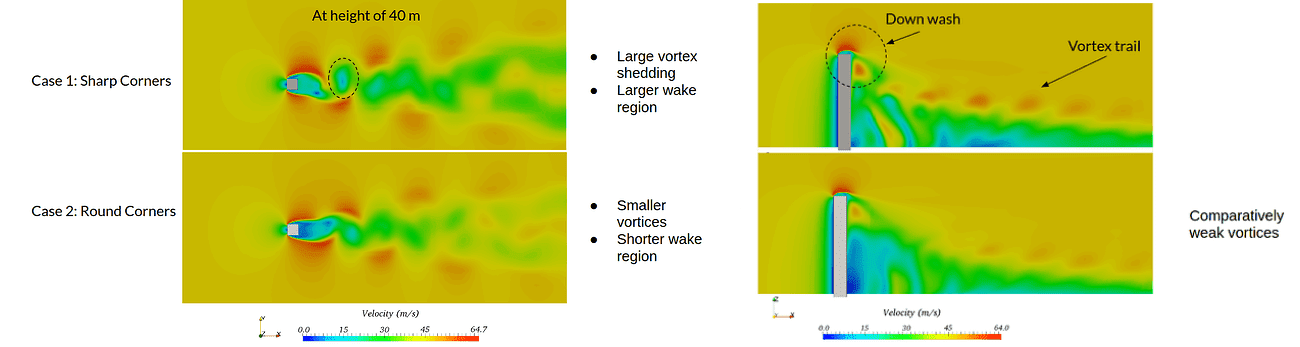

The sharp-cornered design produces strong, organized vortex shedding, and with it high-amplitude periodic crosswind forces. The shedding frequency works out at roughly 0.23 Hz, uncomfortably close to the 0.2 Hz typical natural frequency of a 50-story building [2]. That is a lock-in risk.
The corner-softened design produces weaker vortices and low-amplitude crosswind forces. Rounding the corners cut the wind-induced dynamic forces in the crosswind direction substantially, and with them the risk of damage. The geometry change was free to make at concept stage, before the structural system was fixed. Recovering the same reduction later means supplemental damping, and that comes out of the structural budget and the floor plate.
Project spotlight: wind loads on an oil storage tank farm
Buildings are not the only structures the code struggles with. A tank farm is a cluster of near-identical cylinders packed close together, and the interference between them does something an isolated-structure calculation cannot see.
The case: a 2,600 m2 tank farm at a bayside oil terminal, ten tanks of 15 m height inside a containment dam. Coastal exposure, no upwind obstacles, and a failure mode that ends in an oil spill rather than a broken window. The local construction code gives a gust speed of 36 m/s, which was applied as the inlet condition on a 1.5 million cell hexahedral-dominant mesh, steady state, k-omega SST. The run took 86 minutes.
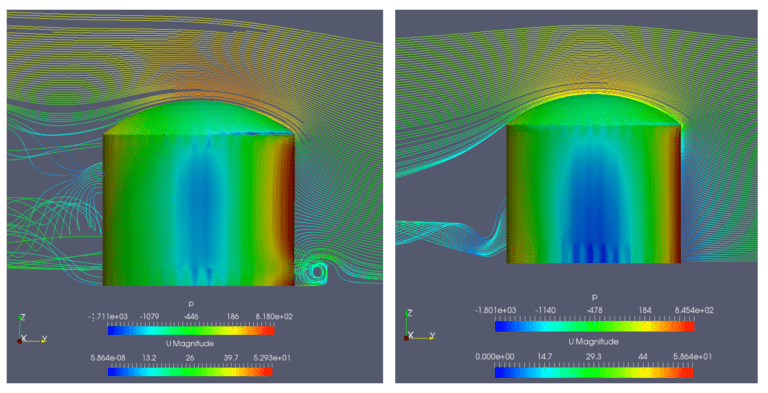
Three results are worth carrying over to any densely packed site:
- Local speed reached 57.5 m/s where the flow was squeezed between tanks, a 60% rise over the 36 m/s gust speed the code specifies.
- Peak pressure was 872 Pa positive and 2,272 Pa suction, and the distribution around each tank was asymmetric. An asymmetric pressure field induces turning moments that a symmetric analytical method does not produce at all.
- Along-wind force on a tank inside the farm was 49% higher than on an identical isolated tank. The largest forces were vertical, lifting the tank roof by suction.
That 49% is the number to remember. It is a direct measurement of the interference effect listed earlier as something ASCE 7 has no explicit provisions for, and it runs in the direction that costs you: the structure in the cluster is loaded harder than the one you would have checked on its own. The natural next step is mapping those pressures onto a structural model to get stresses and safety factors, which is the same platform and a different analysis type.
Wind load design strategies that reduce wind effects
The design modifications that cut wind effects most work by breaking up or suppressing vortex formation:
- Flow spoilers or deliberate surface disturbance
- Corner softening, chamfering or recessing
- Tapering with height, or varying the cross-section shape up the building
- Porosity: open floors, bleed slots, or through-building openings
Studied during the design cycle, these modifications can reduce wind-induced forces by 25 to 60% across the cases Irwin reports [1]. That is a larger reduction in load than the structural system can usually recover afterward, and it is only on the table while the massing is still open.
How much shape actually buys you: a supertall in Shenzhen
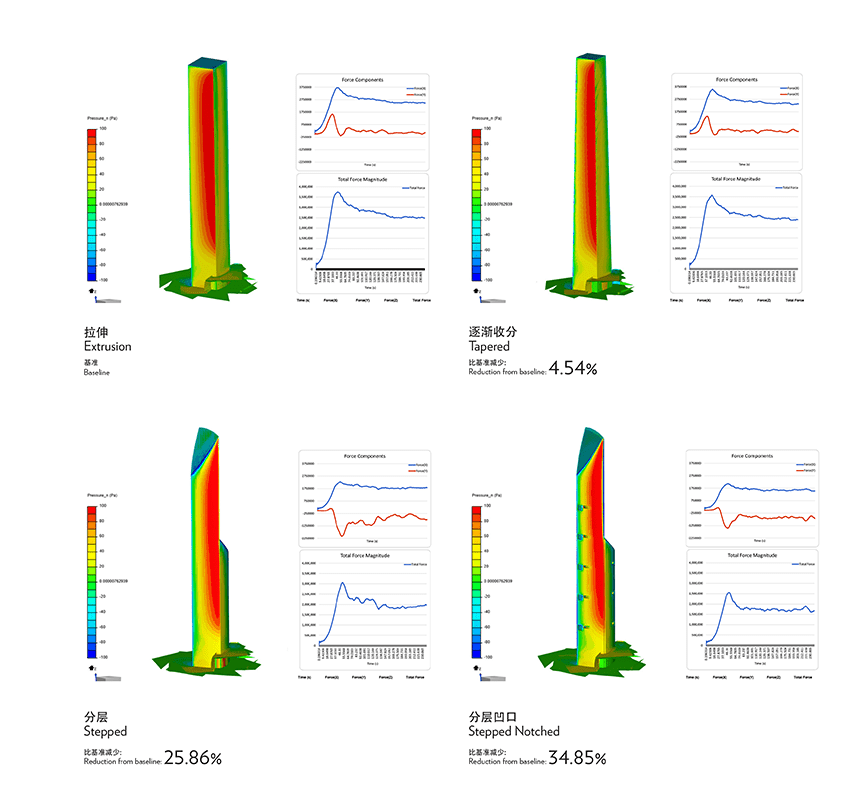
Adrian Smith + Gordon Gill Architecture put numbers on this during a design competition for a supertall tower in Shenzhen. Working from a baseline rectangular extrusion, the team compared forms in SimScale and measured total wind force for each:
| Form | Reduction in total force vs. baseline |
|---|---|
| Rectangular extrusion | baseline |
| Tapered | 4.54% |
| Stepped | 25.86% |
| Stepped with wind relief slots | 34.85% |
The finding that mattered was counterintuitive for that site: stepping back the mass at the top beat tapering by more than five to one. Tapering is the more common instinct, and on this site it bought almost nothing. Adding wind relief slots to mitigate vortex shedding took the total to 34.85%, and the slots doubled as housings for vertical axis wind turbines.
None of that was knowable from a code calculation. It came out of running the options.

Anthony Viola AIA
Architect, Adrian Smith + Gordon Gill Architecture

“When we began using SimScale, we were able to shorten our CFD simulation feedback loop, which in turn allowed us to iterate and evaluate many design options at the earliest design phases of our projects. This proved to be particularly innovative because design changes during this time have the potential for the biggest impact on performance. The more our design team can test and make decisions based on these simulations directly translates to more confidence in meeting the project’s performance goals as well as desired design outcomes.”
Wind load analysis software: what to look for
Wind load software splits into two categories that solve different problems, and buying the wrong one is a common mistake.
Code calculators automate the ASCE 7 or Eurocode procedure: you enter site data and building dimensions, and they return q_z, pressure coefficients and design pressures per surface. They are cheap, fast, and submittable. What they cannot do is tell you anything the code tables do not already contain, which leaves them silent on exactly the geometries where you most need an answer.
Simulation platforms solve the flow field. They handle arbitrary geometry, neighboring buildings, transient response and local peak pressures. They are not a substitute for the code calculation on submittal, and they are the only way to compare shape options at the pace design actually moves.
If you are evaluating simulation tools for wind loading, the criteria that matter are:
- Validation evidence against wind tunnel data for building geometries, published and reproducible
- Transient capability, because vortex shedding and crosswind response are unsteady by definition
- Atmospheric boundary layer and wind profile setup, including multi-direction runs driven by a wind rose
- Parallel runs, so a five-option shape comparison finishes in the wall-clock time of one
- Import from the CAD you already use, Rhino and Revit included, without a remodeling step
- Facade-level pressure extraction as well as global forces, so the C&C conversation is supported
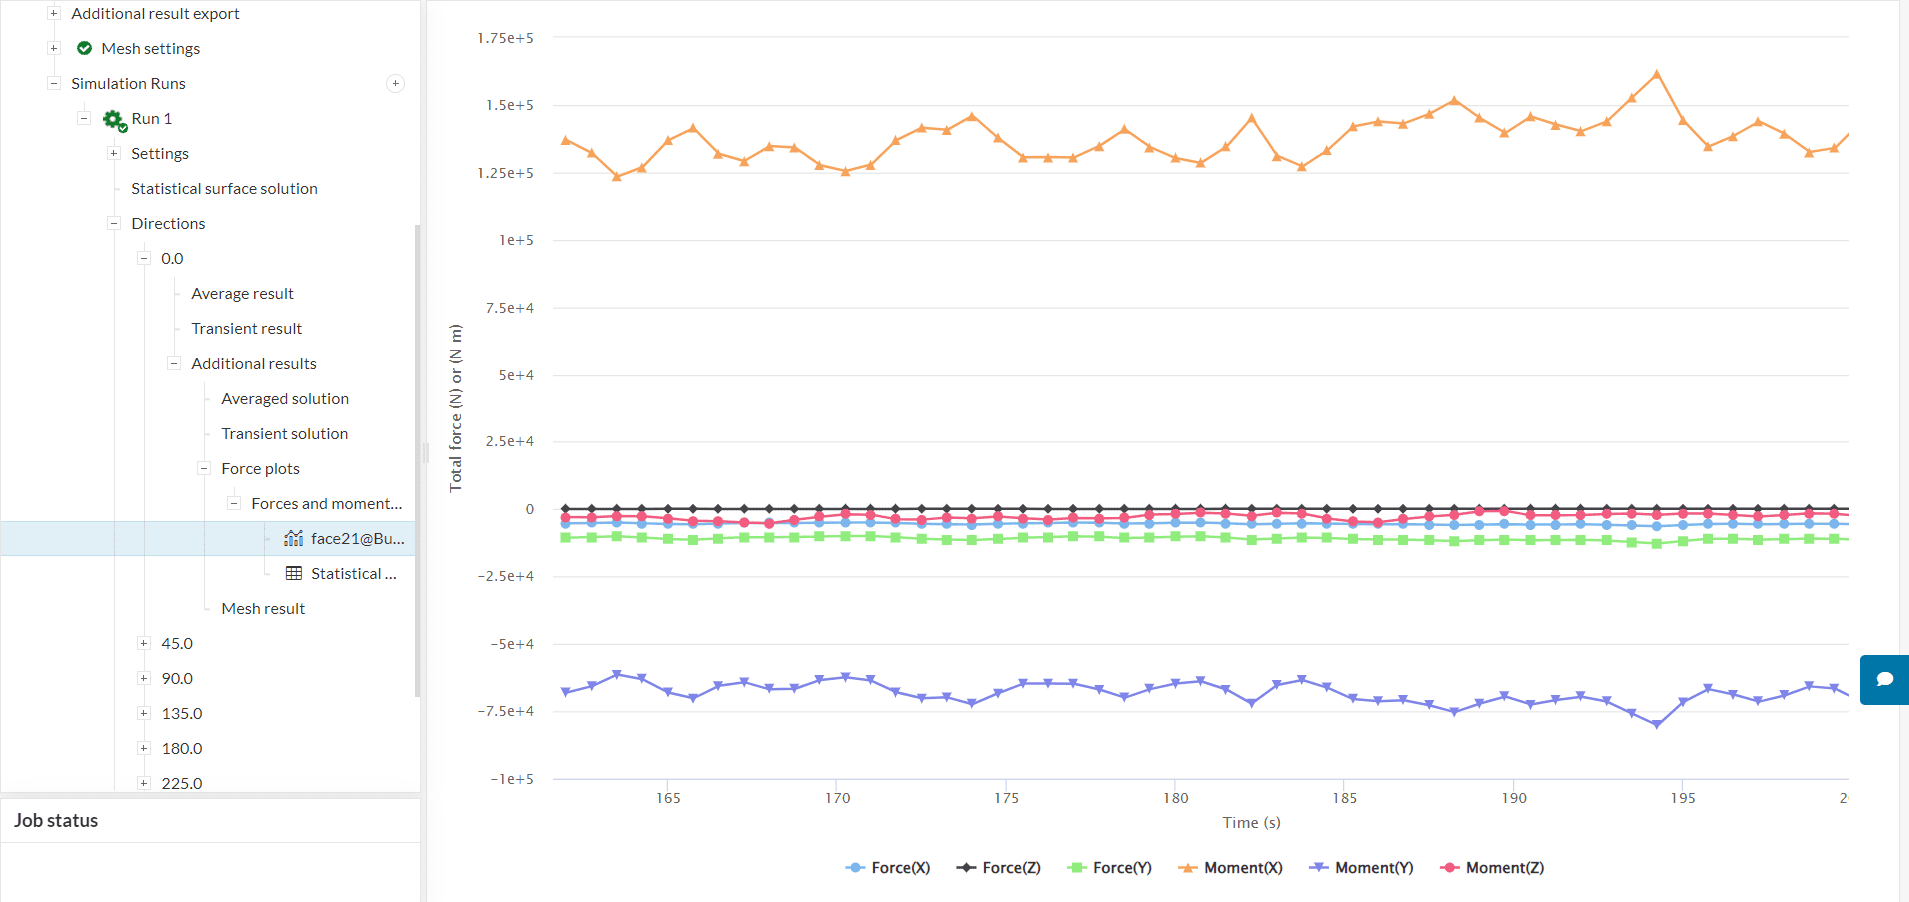
SimScale covers these in the browser on an AI-native cloud platform, with no hardware to provision and no license to check out. Explore wind simulation on SimScale or start a free account and run the first case today.
How to get started with wind load analysis
Start with the code calculation, then simulate the cases the code cannot see. For a rectangular building on flat terrain, Chapters 26 to 30 of ASCE 7-16 will give you defensible design pressures in an afternoon, and the worked example above is enough to check your work.
Once the geometry deviates, add simulation. CFD was once reserved for specialists with access to HPC hardware, and that is no longer true: building simulation now runs from a browser, and the SimScale Public Projects Library carries templates across wind engineering, including pedestrian wind comfort, pollution control and natural ventilation. For a structured walkthrough of mean and peak wind load extraction, the wind loading simulation for structural design session covers the workflow end to end.
Frequently asked questions
Compute the velocity pressure from the site wind speed, then multiply by pressure coefficients for the surface. In ASCE 7-16, q_z = 0.00256 K_z K_zt K_d K_e V² in lb/ft², and the design pressure for the main wind force resisting system is p = q G C_p – q_i (GC_pi). For a 120 ft building in Exposure C at V = 115 mph, q_h at roof height is 37.8 lb/ft² and the net along-wind pressure at that level is 41.8 lb/ft². Windward pressure falls with height below the roof through K_z.
q_z = 0.613 K_z K_zt K_d K_e V², with q_z in N/m² and V in m/s. The constant changes with the unit system; the factors do not.
MWFRS coefficients are whole-surface values that already carry the spatial averaging across the frame, so local peaks smooth out. C&C coefficients are keyed to effective wind area and apply to individual elements such as glazing, panels and fasteners, which pick up the full local peak. C&C pressures are therefore higher, especially in corner and edge zones.
There is no universal number. Design wind pressure depends on the site wind speed, the height, the exposure category and the surface. The worked example above gives 41.8 lb/ft² net at roof height for a 120 ft building at 115 mph in Exposure C. A coastal South Florida site at 175 mph would be roughly 2.3 times that for the same geometry and exposure, and coastal sites are usually Exposure D, which pushes it higher again.
Use the ASCE 7 Hazard Tool with the site coordinates and the risk category. The speed is a 3-second gust at 10 m in Exposure C, and each risk category has its own map at a different mean recurrence interval.
The ASCE 7-10 and later maps are strength-level (ultimate), so the LRFD wind load factor is 1.0. Earlier ASCE 7-05 maps were service-level and used a factor of 1.6. For allowable-stress design, ASCE 7 converts with V_asd = V_ult × √0.6.
No. ASCE 7 permits the Directional Procedure, the Envelope Procedure and the Wind Tunnel Procedure of Chapter 31, tested to ASCE 49. CFD is not among the permitted procedures, and CFD results alone are not code-compliant for wind load submittal. CFD is used for design comparison and shape refinement before a code calculation or tunnel test is performed.
When the building falls outside the geometries the code coefficients were derived for. Common triggers are irregular or tapered massing, high slenderness where crosswind response governs, significant interference from neighboring structures, and unusual roof or facade features.
ASCE 7-22 moved K_d from the velocity pressure equation into the design pressure equations, revised the wind speed maps in hurricane-prone regions, revised the terrain exposure constants, simplified roof GC_p zoning for gable and hip roofs, deleted the Part 2 simplified methods, and added a new Chapter 32 for tornado loads.
Shape modifications studied during the design cycle can reduce wind-induced forces by 25 to 60% across the cases Irwin reports [1]. Corner softening, tapering and porosity move the number most, and they are only available while the massing is still open.
References
- Irwin, P. A. Wind Issues in the Design of Tall Buildings. RWDI, Los Angeles Tall Building Structural Design Council, May 7, 2010.
- Irwin, P. A. Vortices and Tall Buildings: A Recipe for Resonance. American Institute of Physics, 2010. S-0031-9228-1009-350-6.
- ASCE/SEI 7-16, Minimum Design Loads and Associated Criteria for Buildings and Other Structures, Chapters 26 to 31.
- ASCE/SEI 49, Wind Tunnel Testing for Buildings and Other Structures.
- EN 1991-1-4:2005, Eurocode 1: Actions on structures. Part 1-4: General actions. Wind actions.