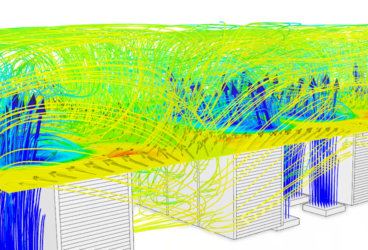
Computational fluid dynamics (CFD) simulations are now being widely used for the prediction and assessment of pedestrian wind comfort environments and high-rise building aerodynamics. There are various types of wind analysis that can be carried out using CFD. Results from CFD wind simulation are now seen as reliable sources of quantitative and qualitative data and are frequently used to make important design decisions. However, to have full confidence in those decisions, extensive verification and validation of the CFD results are necessary.
This paper addresses the topic of pedestrian wind comfort, from origin and
definition to wind comfort analysis, criteria, and example case studies; all meant to
form an in-depth understanding of the field.

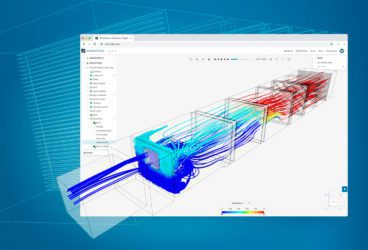
For that reason, the team of application engineers at SimScale make sure to validate all the major features that are rolled out over time, comparing the simulation results to analytical or experimental data. Recently, we used experiments from the Architectural Institute of Japan (AIJ) to validate the results gained from the SimScale platform.
Pedestrian Wind Comfort Architectural Institute of Japan (AIJ) Pedestrian Wind Comfort Experiments
The Architectural Institute of Japan (AIJ) is a Japanese professional organization for architects, building designers, and engineers. It was founded in 1886 and has gathered over 38,000 members since. It publishes several journals, technical standards for architectural design and construction, and research committee studies.
The wind analysis test case for this validation was taken from the “Guidebook for Practical Applications of CFD to Pedestrian Wind Environment around Buildings”, published by AIJ in 2008, which sets the standards for cross-comparison between the results of CFD predictions, wind tunnel tests, and field measurements, and helps validate the accuracy of CFD codes for pedestrian wind comfort assessments.
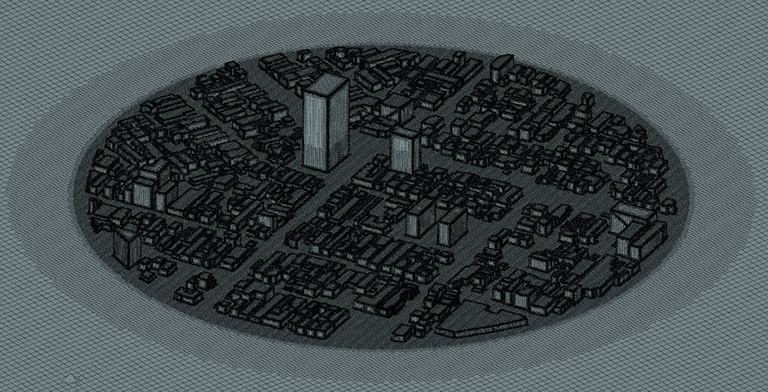
Pedestrian Wind Comfort Case E: Wind Analysis in an Urban Area
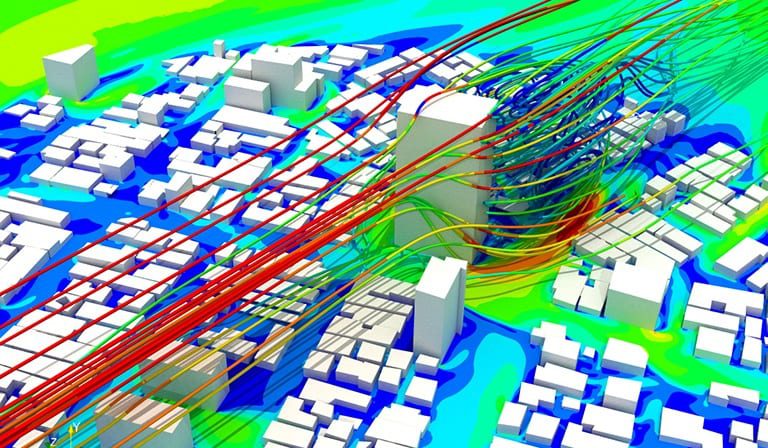
The case being validated is Case E, which is a simplified geometry of a complex of buildings. The urban area model treated here was an actual city block in Niigata city, Japan, with low-rise houses jammed closely together and one target high-rise building at 60m high. Wind tunnel experiments at 1/250 scale were performed on this model in a turbulent boundary layer with a power law exponent of 0.25.
Out of the many scenarios presented in Case E, the impact of the winds from the north, east, south, and west was used to validate the CFD code of SimScale.
The SimScale CFD results were compared to the experimental results and were found to have a good correlation. Some underprediction was seen in the k-epsilon models in the strong wind regions and underprediction in the wake regions, but is a known trait of the k-epsilon model and is within an acceptable range. However, it should be taken into consideration when evaluating results.
Analysis Domain and City Geometry
The geometry was converted into STL using Bear File Converter and imported into SpaceClaim to turn the mesh into solids. The solids were then subtracted from a larger volume which was to be the surrounding fluid domain. To do this, a certain amount of cleaning had to be done, including creating thin cylinders on edges that touched but weren’t intersected. This was the cause of some CAD issues external to SimScale.
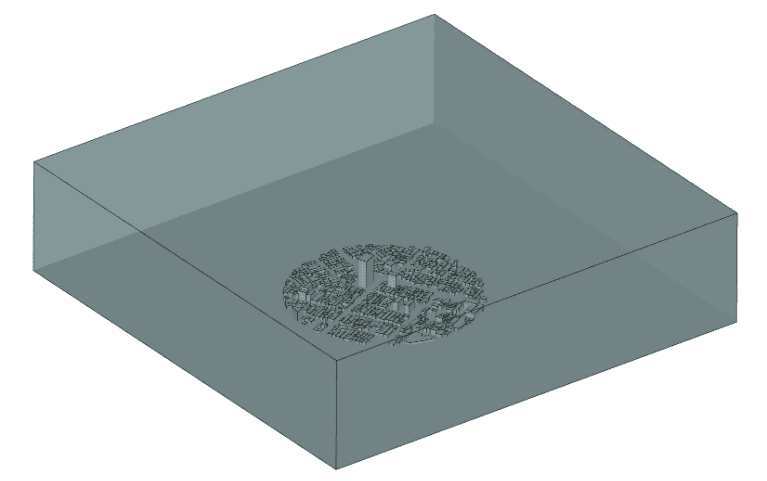
The geometry was then imported to SimScale. The size of the bounding box was 2 x 2 x 1 km.
Mesh
A parametric hex-dominant mesh was used, where region refinements were placed on the city itself and further surface refinements on the building surfaces. The floor was refined with a thin region refinement. The floor and the buildings had two layers inflated relative to the cell size.
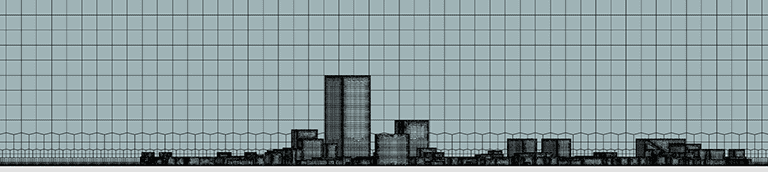
The above images show that the mesh was quite coarse, with a cell density of 50/km. The cell count for the mesh was 30 million cells.
Simulation Setup
The model type was steady-state with the k-epsilon turbulence model. The standard air material was used and the solution was initialized using potential flow.
These validation simulations for each wind direction were all set up similarly, with only the inlet, outlet and side faces altered depending on the direction. The inlet was defined using a CSV upload for velocity, turbulent kinetic energy and dissipation rate, and a zero-gradient pressure condition. The outlet was a zero-pressure outlet and the top and sides were slip walls. The buildings and the ground were no-slip condition walls.
CFD Analysis Results
To compare the CFD wind analysis results to the experimental data, the velocities were normalized with the value of velocity at the inlet at a height of 15.9m. The measurements were taken at points listed in the AIJ guidebook.
The CFD results obtained from the SimScale platform were plotted against the experimental results to see the correlation.
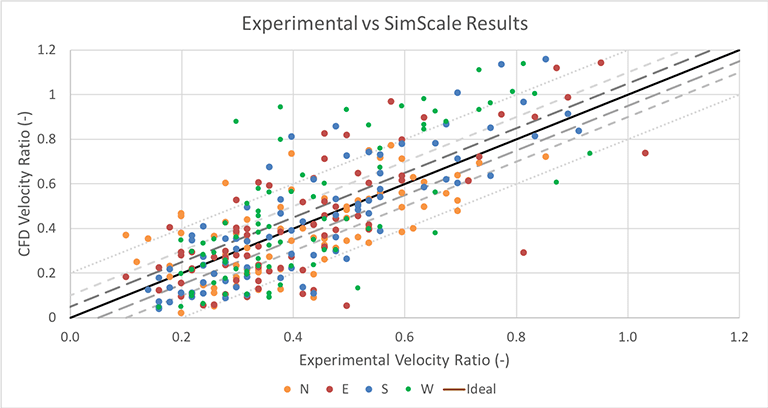
The correlation between the AIJ experiments and SimScale results was highly linear, with a majority of the points being within 0.2 in relative velocity. To see how the results compared in more detail, the results were plotted against the point numbers so they could be compared to the velocity slices.
The images below show the velocity comparison for the case of a strong northerly wind. For a detailed analysis of other cases, please refer to this simulation project in the SimScale Public Project Library.
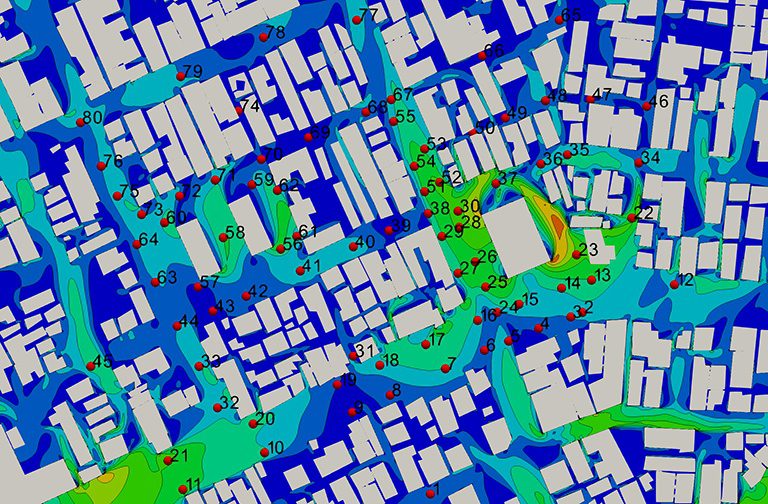
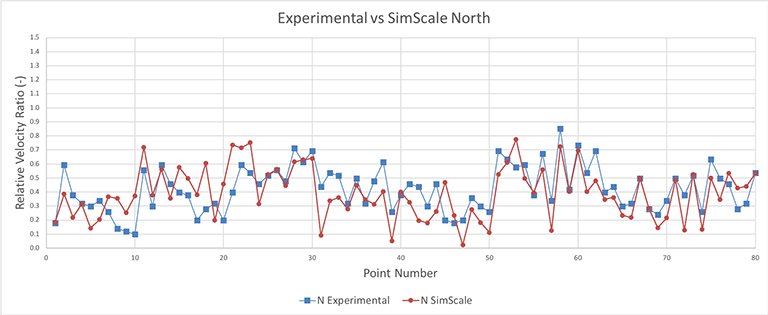
These results show that, as the correlation plot suggested, the CFD simulation with SimScale and the wind tunnel experiments produce very similar data. It can be observed that in regions of particularly high velocity, the simulated results may show a slight overprediction. This, however, is considered more desirable than underprediction, as this is where pedestrian wind comfort is likely to be an issue. On the other hand, the points located in wake regions tend to be underpredicted. This is a known trait of the k-epsilon model, and since pedestrian wind comfort problems rarely occur in the wake regions, this is not normally considered an issue. Examples of this are most strongly seen in the westerly wind scenario.
Ready to run your own pedestrian wind comfort analysis? SimScale’s cloud-native platform lets you simulate up to 36 wind directions in parallel with validated CFD solvers. Try SimScale Wind Simulation →
Conclusion
Buildings in urban areas have complicated shapes and are distributed in an irregular manner, making physical testing difficult and expensive. With the accuracy of CFD codes steadily increasing, simulation has become a viable substitute, and it has been adopted by architecture and construction companies all over the world for assessing pedestrian wind comfort, wind loads on buildings, skyscraper aerodynamics and more. A strict verification and validation of simulation results, however, remains critical for engineers to be able to use the obtained data with confidence and base important design decisions on it.
Download our ‘Tips for Architecture, Engineering & Construction (AEC)’ white paper to learn how to optimize your designs!

If you enjoyed studying this validation project, you might be interested in another CFD simulation based on the AIJ experiments: Case D: High-Rise Building in City Blocks. Both projects can be copied for free from the SimScale Public Projects Library and used as templates for your own analysis. If you’d like to learn more about the SimScale cloud-based platform and its capabilities, download this features overview.
References
- Bear File Converter, DXF to STL conversion. https://www.ofoct.com/3d-model-file-for-3d-printer-converter/dxf-to-stl.html
- AIJ, Guidebook for Practical Applications of CFD to Pedestrian Wind Environment around Buildings. https://www.aij.or.jp/jpn/publish/cfdguide/index_e.htm