
HVAC design gets expensive fast.
A suboptimal duct bend. An undersized diffuser. A mixed-mode strategy that fails thermal comfort at occupancy. Each one means physical prototypes, field tests, and redesigns late in the process, when changes cost the most.
CFD ventilation simulation cuts that loop short.
This guide covers two scales of analysis:
- Component level: AHUs, diffusers, louvres, fans: pressure drop, discharge coefficients, flow optimization
- Spatial level: building IAQ, CO2 distribution, thermal comfort validated against ASHRAE 55, CIBSE, and LEED standards
Launch your own ventilation simulation today!
Real case studies. Quantified results. Workflows engineers run in SimScale today, from a browser, no HPC required.
What Is CFD Ventilation Simulation?
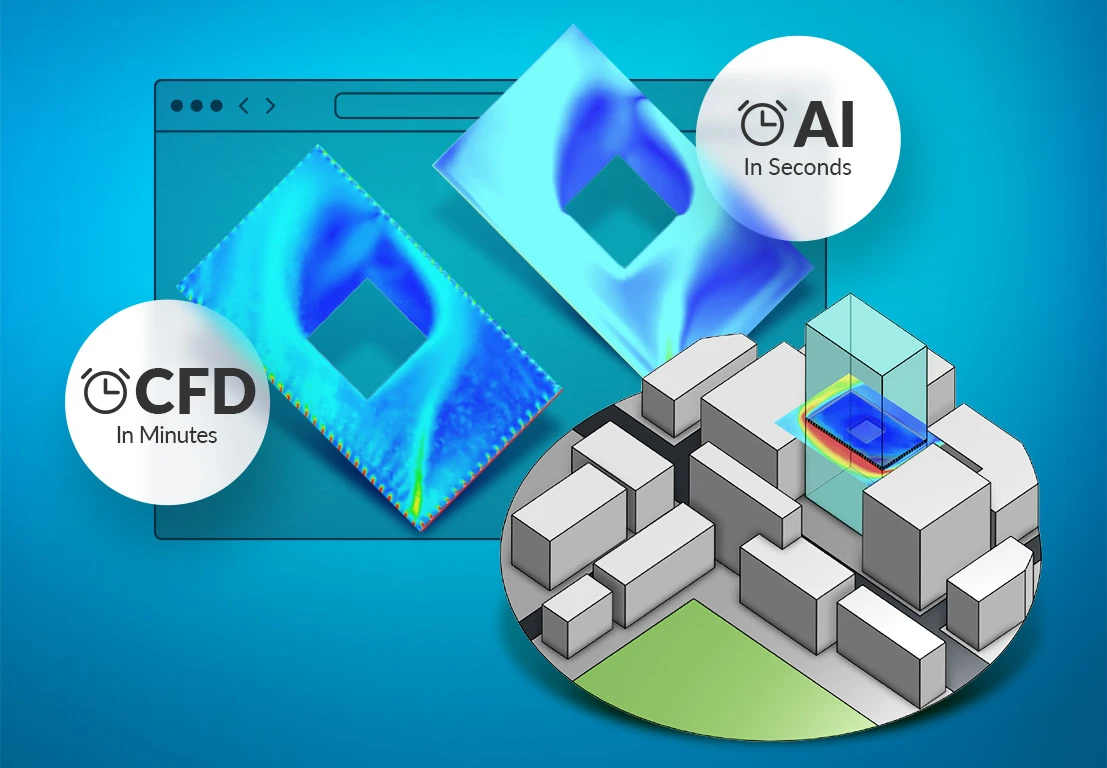
CFD ventilation simulation predicts airflow rates, pressure drop, temperature distribution, CO2 concentration, and thermal comfort across HVAC components and occupied spaces, without physical prototyping. It operates at two scales: component level (AHUs, diffusers, louvres, fans) and spatial level (room air quality, occupant comfort, mixed-mode strategies).
Applying computational fluid dynamics to ventilation means solving the airflow field directly rather than inferring it from a ventilation rate. Ventilation modelling in an energy tool returns one air change figure for a zone. Ventilation analysis in CFD returns velocity, temperature, and concentration at every point in that zone, which is what any spatial acceptance criterion actually requires.
When Ventilation CFD Replaces a Hand Calculation
Use CFD when the design departs from the catalog case the handbook coefficient was measured on. Table-based sizing stays correct for straight runs, standard fittings, and single-point ventilation rates. It stops being correct as soon as geometry, interaction, or spatial distribution carries the answer.
| Design question | Table or handbook method | CFD required |
|---|---|---|
| Sizing a straight duct run for a target friction rate | Sufficient | No |
| Total system pressure drop with standard fittings | Sufficient as a first pass | Only if measured performance disagrees |
| Pressure drop through a non-standard bend, plenum, or transition | Loss coefficients do not exist for the geometry | Yes |
| Discharge coefficient for a bespoke louvre or screen | No published Cd | Yes |
| Where supply air actually reaches occupants | Not answerable | Yes |
| CO2 or contaminant concentration by location | Single-zone average only | Yes |
| PMV and PPD across an occupied plane | Not answerable | Yes |
| Component interaction inside an AHU casing | Not answerable | Yes |
The practical test: if the deliverable is a single number for the whole space, a load calculation is adequate. If the deliverable is a distribution, or evidence for an authority, it is a CFD problem.
For the underlying method rather than the ventilation application, see computational fluid dynamics. For the wider set of HVAC system applications, see CFD for HVAC systems.
The Core HVAC Design Problem
Two factors drive almost every ventilation design challenge:
Pressure drop: each component resists airflow. The losses compound through dampers, grilles, filters, and duct bends. Two mechanisms dominate:
- Friction: air rubbing against duct surfaces loses energy. Duct length, surface roughness, and filter loading all contribute.
- Turbulence: direction changes, particularly 90° bends, produce secondary vortices. Fitting geometry at each bend determines how severe the loss is.
System-level compensation: when one component underperforms its pressure-flow target, adjacent equipment compensates, driving up energy consumption and accelerating wear across the whole system.
CFD exposes exactly where losses originate and lets engineers test fixes in parallel, before any hardware is committed.
Ventilation Simulation for HVAC Components
Air Handling Units (AHUs)
CFD covers three areas of AHU performance analysis:
Flow simulation: modeling air through each component in sequence (dampers, filters, heating coils, mixing chamber, supply fan) reveals true installed performance. Parallel simulations are the fastest way to evaluate component substitutions or assess the effect of varying operating temperatures.
Pressure drop analysis: CFD calculates drop through each component and across the full system at specified flow rates and temperatures. Angle-dependent losses through dampers are reduced by optimizing fin angles or introducing guide vanes to suppress flow separation. Filters are modeled as porous media; their drop is computed directly from permeability coefficients.
Structural and aero-acoustic analysis: pressure loads from blowers and fans map onto structural analysis to identify stress concentrations and noise sources, both of which must be minimized for compliance.
See the air handling unit case study for a full manufacturer workflow, and HVAC components for the component-by-component breakdown.
Case Study: Gas Turbine Air Intake
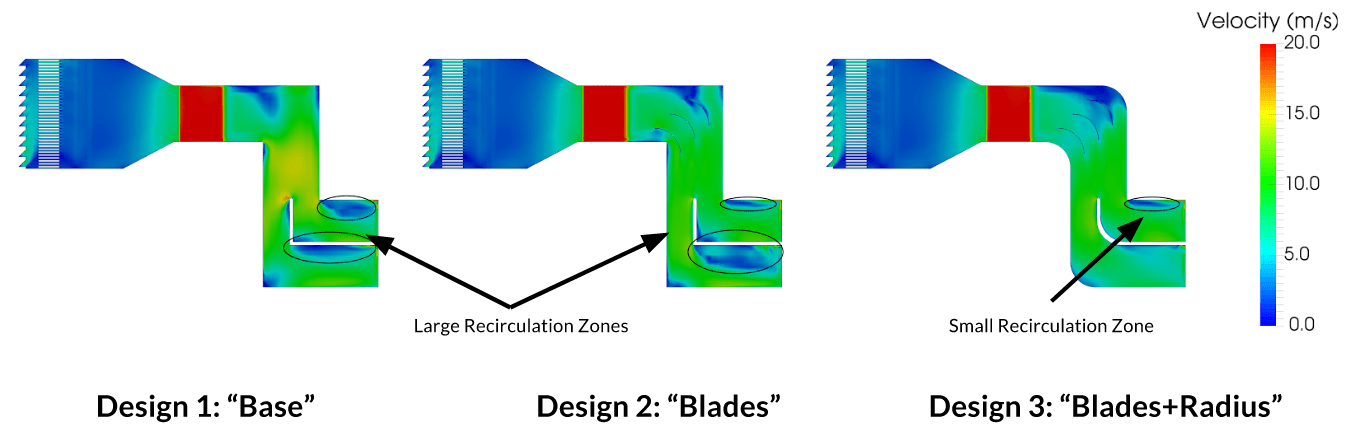
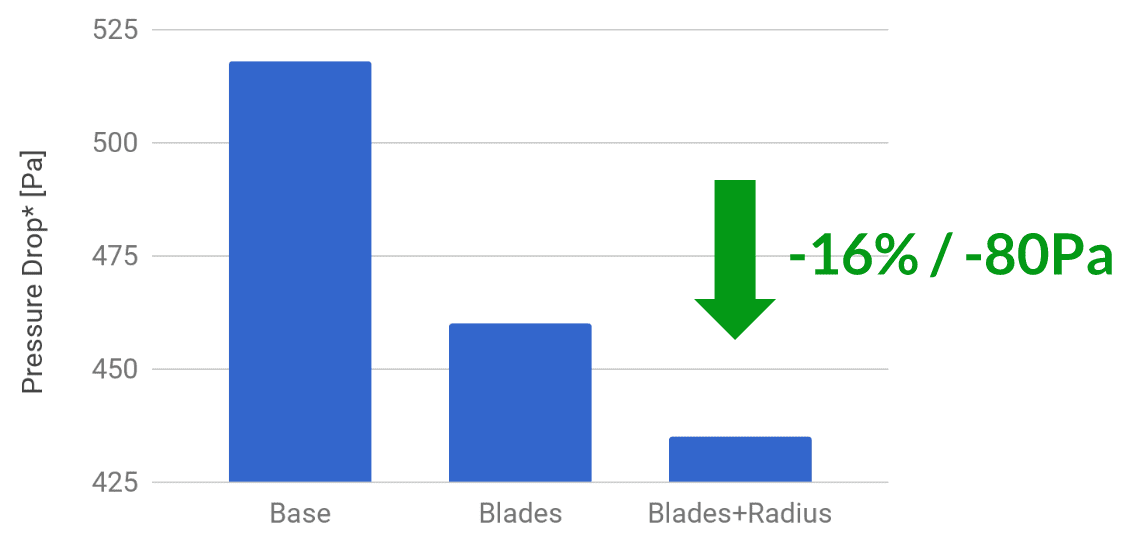
Adding guide vanes and rounding the corners at a single duct bend cut pressure drop across a gas turbine air intake by 16%, over 80 Pa.
The intake runs from a weather hood at the inlet, through the thin grills of a pre-filter section, into a main filter modeled as porous media, then a transition into silencer panels, a bend, and two outlets. Airflow rate of 25.1 m3/s is applied at the outlets rather than the inlet, which reproduces the fact that air is drawn through the system. Steady state, incompressible, turbulent.
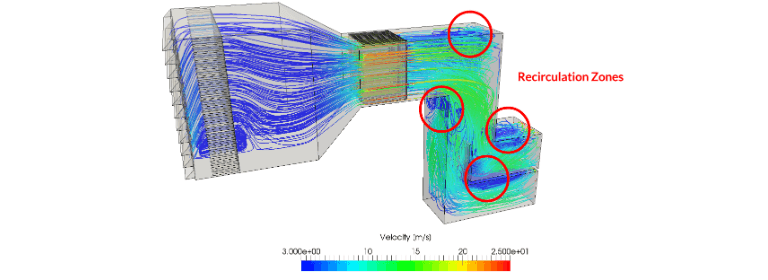
Three bend geometries were compared:
- Conventional design, sharp corners at the bend
- Guide vanes at the bend
- Guide vanes plus rounded corners
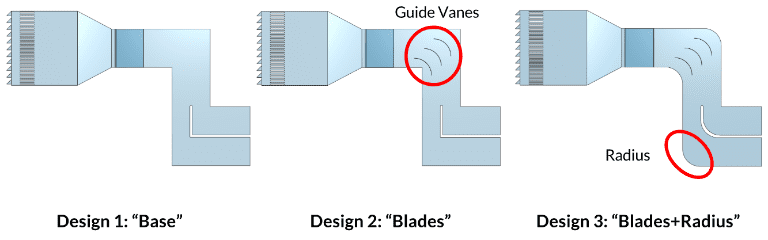
Pressure contours separate the three only between the bend and the outlet. Design 3 is weakest there, and velocity contours show its recirculation zones substantially reduced. The recirculation visible in the baseline, immediately downstream of the silencer, is where the wasted energy was going.
Why 80 Pa is worth chasing. Khorsand et al. estimated that a 250 Pa pressure loss reduction on a Siemens V94.2 gas turbine at 160 MW output yields a 0.355% power output gain, about 0.568 MW. Over twelve months at $0.10/kWh that is roughly $480,000 in additional revenue. The whole study took 2 hours of manual setup, 5 hours of compute, and 180 core hours, because it ran in the cloud.
The same duct geometry principles apply directly to AHU casings, plenums, and building duct networks. There the recovered energy shows up as reduced fan power rather than turbine output, but the mechanism, sharp bends generating counter-rotating secondary flows, is identical.
Source: Khashayar Khorsand, S. M. H. Karimian, M. Varmaziar, S. Sarjami, “Investigation of Flow Pattern and Pressure Loss of a V94.2.5 Gas Turbine Air Intake System Using 3D Numerical Modeling”.
Ventilation Louvres and Grilles
For louvres, CFD determines:
- Discharge coefficient (Cd): efficiency and compliance with design standards
- Aerodynamic behavior: stagnation points, high-velocity zones, flow separation, and wake propagation that identify where pressure loss originates
- Porosity factors: Darcy and Forchheimer coefficients through porous modeling, used to build pressure loss curves for comparative sizing
Case study: Smartlouvre MicroLouvre™
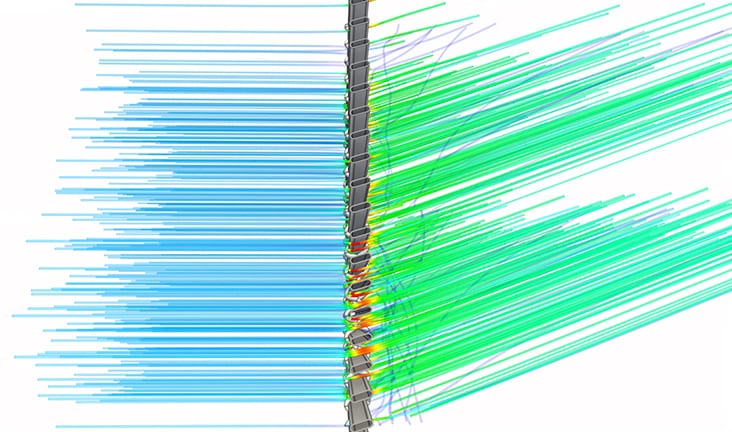
Smartlouvre Technology Ltd used SimScale to characterize their MicroLouvre™ metal fabric, an external window attachment that provides natural ventilation and solar shading. A digital wind tunnel at multiple wind speeds and incidence angles produced a discharge coefficient of Cd = 0.39. That value feeds directly into building simulation and thermal modeling tools used by architects integrating MicroLouvre into their designs, eliminating the need for physical wind tunnel testing.
HVAC Diffusers
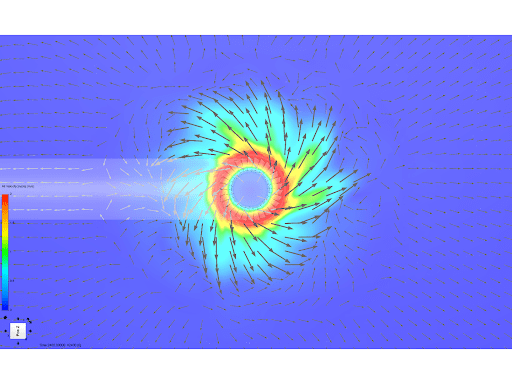
Diffuser geometry, grille orientation, and placement directly determine room air distribution. Building authorities increasingly require quantitative evidence of mixing performance, not handbook estimates.
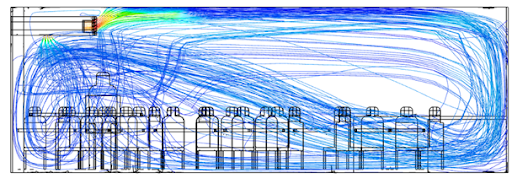
Swirl diffuser: a radial swirl diffuser simulated in SimScale demonstrates the Coanda effect: flow vectors follow the outlet curvature to produce the characteristic outward swirl that improves mixing. Velocity vectors are shown in both plan and section.
Case study: Monodraught HVR Zero
Monodraught used SimScale to develop the HVR Zero, a compact hybrid ventilation and cooling unit. Parallel simulation across multiple internal air path geometries identified and eliminated recirculation zones, reducing fan power consumption by 50%. That reduction compounds across every building deployment.
Building Ventilation and Indoor Air Quality
At the spatial level, CFD answers the questions energy models cannot: where does fresh air actually reach occupants? Where does CO2 accumulate? Where does thermal comfort fall short? SimScale imports geometry directly from Rhino®, Revit®, SketchUp, and AutoCAD®, enabling parametric multi-configuration studies without geometry rebuilds.
To set up a general indoor airflow simulation rather than follow the ventilation methodology below, start from the indoor environment platform page.
Analysis Type: Conjugate Heat Transfer (CHT)
CHT is the correct analysis type for building-scale ventilation. It resolves simultaneously:
- Natural convection: buoyancy-driven and wind-driven airflow
- Forced convection: mechanical supply and extract
- Radiation: solar gains and radiant surfaces
- Passive scalar transport: CO2, aerosols, and VOCs via diffusion coefficient
This covers passive, mechanical, and mixed-mode systems in a single simulation run.
Choosing the Analysis Type
Pick the analysis type from the physics that decides the answer, not from the size of the model. Adding buoyancy or radiation to a case that does not need them costs runtime without changing the result.
| Objective | Analysis type | Why |
|---|---|---|
| Pressure drop, Cd, flow split at constant temperature | Incompressible CFD | Density variation is negligible; no energy equation needed |
| Room air distribution with heat sources and surfaces | Conjugate heat transfer | Buoyancy and solid conduction both affect the flow field |
| CO2, aerosol, or VOC distribution | CHT with passive scalar | Species transport follows the resolved velocity field |
| Solar gain through glazing driving stack flow | CHT with radiation | Radiant surface temperatures set the buoyancy source |
| Facade pressure coefficients, cross-ventilation potential | External wind CFD | Ventilation rate is driven by the external pressure field |
| Smoke movement and tenability | CHT with passive scalar and radiation | Buoyant plume and visibility both matter |
Case Study: Mixed-Mode Ventilation in a Classroom
A parametric classroom model tests three configurations (occupant thermal loads from ASHRAE/LEED/CIBSE guidelines, LED lighting, laptops, display screen, 0.1 ACH adventitious leakage at 15°C ambient):
- Base case: horizontal diffusers only (supply downward)
- Configuration 1: upward-directed diffuser grilles
- Configuration 2: upward diffusers + top-hung windows open (mixed-mode)
The base case creates downdraught at desk level: cold supply air drops due to density difference, leaving upper zones under-ventilated. Configurations 1 and 2 redirect supply upward; Configuration 2 adds cross ventilation from the open windows.
The model carries per-surface U-values, since the room uses different constructions on different elevations, and radiation sources representing solar gains. That matters when the design has to demonstrate Passivhaus energy and environmental metrics rather than comfort alone: the same run has to satisfy air quality and thermal comfort without conceding additional energy loss, so the diffuser change and the window opening are evaluated against both at once. Configuration 1 solves occupant discomfort by pushing supply air along the ceiling with guide vanes and a high wall diffuser. Configuration 2 pairs that diffuser setup with a top-hung window opening, which is what resolves the CO2 problem.
The same mechanical supply strategy is covered in more depth in mechanical ventilation simulation, and the classroom result set is walked through in the SAV Systems classroom ventilation webinar.
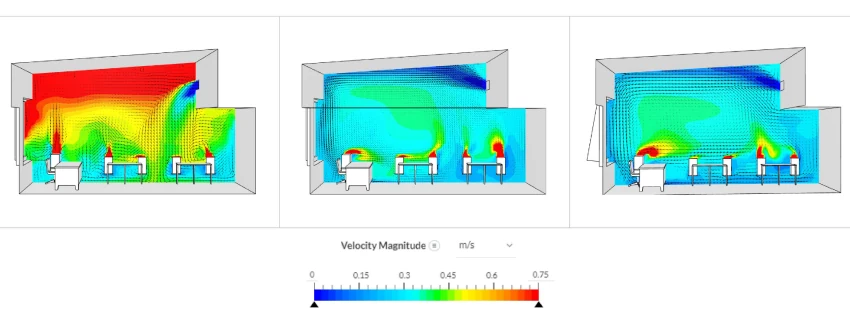
Base Configuration – Diffuser grills are set horizontally at the inlet – Cold air from the supply tends to move downward due to the ambient condition
Configuration 1 & 2 – Upward facing grills creates a better circulation of fresh air inside the room
CO2 and Indoor Air Quality
The passive scalar model tracks CO2 from each occupant’s head position, producing spatial concentration maps that single-point energy models cannot generate.
| CO2 Concentration | Assessment |
|---|---|
| < 800 ppm | Excellent |
| 800–1,000 ppm | Good; acceptable for controlled ventilation spaces |
| 1,000–1,500 ppm | Marginal; permitted for purely naturally ventilated buildings under some codes |
| > 1,500 ppm | Poor; impairs cognitive function |
| > 2,000 ppm | Very poor; significant health risk |
Configuration 2 delivers 22% less CO2 than Configuration 1. Open windows introduce outdoor air at ~400 ppm and drive cross ventilation. The simulation pinpoints stagnant zones, directly informing sensor placement and exhaust positioning.
The same passive scalar approach extends to aerosol tracking, VOC off-gassing, and cleanroom contamination control. For the broader treatment of occupied-space air quality, see how to improve indoor air quality with CFD.
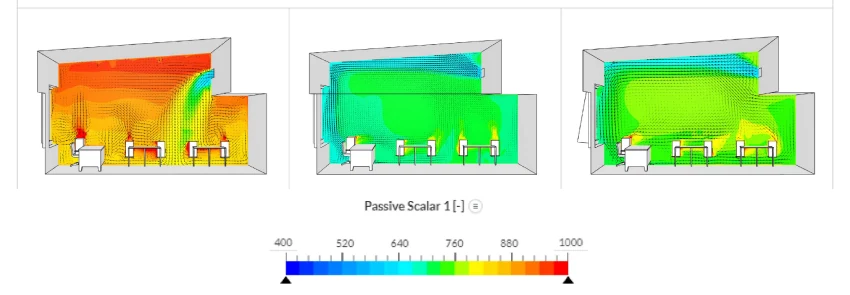
Base Configuration – High concentrations of CO2 at the ceiling level due to improper mixing of fresh air
Configuration 1 & 2 – Better mixing of air, drastically reduces the concentration levels
Thermal Comfort Standards
PMV and PPD outputs are evaluated against ASHRAE 55 and ISO 7730:
| Standard | PMV Range | PPD Limit |
|---|---|---|
| ASHRAE 55 | −0.5 to +0.5 | < 10% |
| ISO 7730 (new buildings) | −0.5 to +0.5 | < 10% |
| ISO 7730 (existing buildings) | −0.7 to +0.7 | < 15% |
The classroom configurations sit within −0.6 to +0.6 PMV. The primary differentiator between configurations is air quality and mixing, not temperature. PMV can be improved further by adjusting supply inlet temperature, fabric thermal performance, or adding heat recovery on extract air.
Both standards are covered in full in what is ASHRAE 55 and what is ISO 7730.

Robert White
Technical Associate and CEPH Designer at Architype

“The SimScale platform has allowed us to develop and test scenarios including ventilation flow paths and understanding the dynamics between building fabric, airtightness, window natural ventilation design, and CO2 concentrations in various utilization scenarios. The platform has given us quality, visually digestible output to inform decision-making and to compare results against our monitored data from our extensive post-occupancy studies. Working with SimScale has allowed us to study our learning spaces in a way we never have before.”
Case Study: Coupling External Wind to Internal Ventilation
Whether a window is enough is decided outside the building, not inside it. An apartment building study answered that by running a pedestrian wind comfort analysis of the building and its surroundings first, then applying the resulting pressure tappings to the windows of the internal model. Internal door leakages were included.
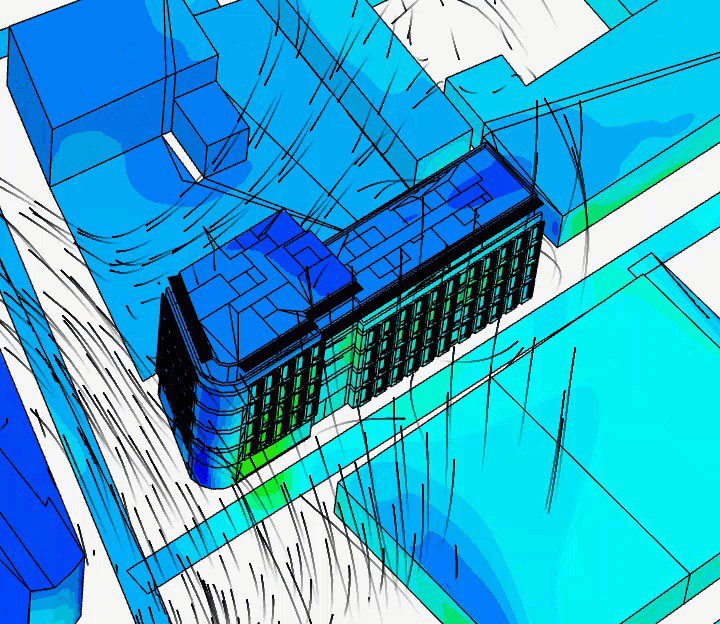
The question was whether natural ventilation through one open window was sufficient for the third floor, with wind from the southwest.
Widening the window opening improved ventilation on one side only, and past a certain angle produced no further change at all. Mean age of air is what exposed why. Corner rooms and the kitchen were well ventilated. Rooms in the middle were not, and two rooms of near-identical geometry behaved differently: one sat where an external recirculation zone ended and the surrounding buildings’ wake began, leaving a dead zone in front of the facade and too little air moving through it.
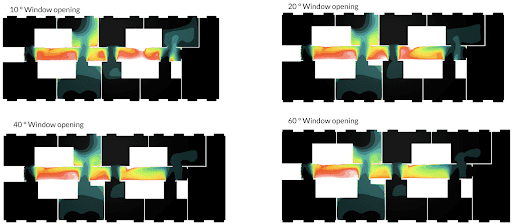
The conclusion was that natural convection was not sufficient for the whole floor. Opening windows worked for most rooms; the corridor and the rooms inside the recirculation zone needed forced ventilation to meet air quality standards.
This is the case for reporting age of air alongside CO2. A CO2 map tells you where the stale air is. Age of air tells you whether fresh air is reaching that zone at all, which is the difference between a diffuser problem and a strategy problem.
Natural Ventilation Simulation
For passive and mixed-mode strategies, SimScale supports external wind CFD for facade pressure coefficients and cross-ventilation potential, alongside CHT for stack-effect and buoyancy-driven analysis. See the natural ventilation validation guide for a full methodology walkthrough.
Stack-driven and buoyancy-driven cases are covered separately in stack effect ventilation and passive ventilation in buildings. For the comparison between active and passive strategies on a real project, see IBEEE’s active compared to passive ventilation study.
How to Run a Ventilation Simulation
A component or room-scale ventilation study runs in seven steps. Steps 1 to 4 take under an hour for a typical room model; the solve is unattended.
- Import the geometry. Upload native CAD from Rhino®, Revit®, SketchUp, or AutoCAD®. For room-scale work, model the air volume and the surfaces that exchange heat with it. Furniture below roughly 0.3 m characteristic size can be omitted unless it blocks a supply path.
- Select the analysis type. Use the table above. Incompressible for isothermal component studies, CHT for anything where temperature or buoyancy affects the flow.
- Assign boundary conditions. Supply inlets as volumetric flow rate or velocity with a supply temperature, extracts as pressure outlets, occupants as combined heat and CO2 sources at head height, equipment and lighting as surface heat flux. Infiltration enters as an adventitious leakage rate in ACH.
- Mesh the domain. Refine at supply and extract openings, along louvre and diffuser blades, and in the occupied plane where the results will be read. Coarse cells at a diffuser outlet smear the jet and change the whole room result.
- Run. Component studies converge in 1 to 3 hours, room-scale CHT in 2 to 6. Variants run in parallel, so a parametric sweep costs the same wall-clock time as one run.
- Check convergence before reading results. Residuals should be flat, and the integral quantities that matter (inlet-to-outlet mass balance, average CO2, area-weighted PMV) should be steady rather than still drifting.
- Post-process against the acceptance criterion. Export PMV and PPD on the occupied plane at 1.1 m seated or 1.7 m standing, CO2 in ppm at head height, age of air where fresh air delivery is disputed, and pressure drop curves for component work.
Ventilation Standards CFD Is Used to Evidence
CFD output is accepted as evidence against the standards below because each one specifies a spatial criterion that a single-zone calculation cannot produce.
| Standard | Scope | What the simulation produces |
|---|---|---|
| ASHRAE 55 | Thermal environmental conditions for human occupancy | PMV between −0.5 and +0.5, PPD below 10% across the occupied zone |
| ISO 7730 | Analytical determination of thermal comfort | PMV, PPD, and local discomfort indices including draught rate |
| ASHRAE 62.1 | Ventilation for acceptable indoor air quality | Delivered outdoor air per person, distribution effectiveness |
| EN 16798-1 | Indoor environmental input parameters (supersedes EN 15251) | Category I to IV comfort and CO2 banding |
| ISO 14644 | Cleanroom air cleanliness classification | Particle transport, recovery time, unidirectional flow uniformity |
| CIBSE Guide A and Guide B | UK design criteria for comfort and ventilation | Air speed, temperature gradient, ventilation rate by space type |
| LEED IEQ credits, BREEAM Hea 02 | Green building certification | Documented IAQ and comfort performance |
| ASHRAE 90.4 | Data center energy performance | Airflow distribution and thermal management, see the ASHRAE 90.4 guide |
Ventilation Simulation by Application
Each application changes the acceptance criterion, and with it the analysis type and the quantity you post-process.
| Application | Governing criterion | Walkthrough |
|---|---|---|
| Classroom and office comfort | PMV, PPD, CO2 | Thermal comfort in buildings |
| Displacement ventilation | Stratification height, draught at ankle level | Displacement ventilation design with CFD |
| Car park and garage | CO concentration, jet fan placement | Garage ventilation system design |
| Smoke control | Tenability, visibility, smoke layer height | Smoke and heat exhaust ventilation systems |
| Cleanrooms | ISO 14644 class, recovery time | Cleanroom ventilation |
| Isolation and negative pressure rooms | Pressure cascade, air changes per hour | Negative pressure room ventilation |
| Commercial kitchens | Capture efficiency, radiant and convective load | Kitchen ventilation simulation |
| Industrial fume extraction | Capture velocity at the source | Exhaust fume extraction |
| Server rooms and data centers | Rack inlet temperature, recirculation | Server room cooling |
Mesh and Setup Choices That Decide Accuracy
Three setup decisions account for most disagreement between a ventilation simulation and a measured building.
Turbulence model. k-omega SST resolves separation and reattachment at louvre blades, diffuser outlets, and duct bends, which is where component pressure drop is decided. k-epsilon remains adequate for bulk room mixing where no separated shear layer sets the answer.
Buoyancy treatment. Room-scale ventilation is frequently buoyancy-dominated, particularly with displacement systems, high occupant loads, or solar gain. Solving it isothermally produces a plausible velocity field and the wrong stratification.
Boundary condition realism. Two inputs are commonly underestimated: infiltration, which is often set to zero when real buildings leak, and occupant sensible load, which sets both the plume strength and the CO2 source. A model that disagrees with post-occupancy data usually disagrees here first, not in the solver.
Ventilation Simulation Software That Runs in Your Browser
SimScale is the world’s first AI-native cloud platform for engineering simulation, trusted by 800,000+ engineers. For HVAC and ventilation work, that means:
- Engineering AI automates simulation setup (mesh generation, boundary condition assignment, solver configuration) so engineers spend time on design decisions, not manual workflow
- Physics AI delivers instant predictions connected to high-fidelity CFD, enabling design space exploration across thousands of variants before committing to a full solve
- No HPC, no VPN, no installation: runs in a standard browser with elastic cloud compute on demand
- All physics, one platform: incompressible and compressible CFD, CHT, passive scalar, structural, and radiation in a single environment; no solver switching
- CAD-native imports: Rhino®, Revit®, SketchUp, AutoCAD® and more; geometry changes propagate directly into simulation
- Standards-aligned outputs: PMV, PPD, age of air, CO2 in ppm, discharge coefficients, and pressure drop curves for every major HVAC design standard
Teams that would rather commission the study than run it themselves use the same platform through SimScale’s engineering services and partner network, which is the usual route for one-off building ventilation CFD services, compliance submissions, and tender-stage work. Either way the model, the mesh, and the results stay in your account rather than in a consultant’s file.
For the platform overview and licensing, see HVAC simulation software.
Frequently Asked Questions
CFD ventilation simulation models airflow, pressure drop, temperature distribution, and contaminant concentration across HVAC systems and building spaces, predicting performance without physical prototypes.
HVAC simulation targets component design (AHUs, diffusers, louvres, fans, ductwork), optimizing pressure-flow characteristics. Building ventilation simulation analyzes how that equipment performs spatially: where air distributes, where CO2 accumulates, whether thermal comfort standards are met across the occupied volume. SimScale handles both scales in one environment.
Conjugate Heat Transfer (CHT) for building-scale work: resolves natural and forced convection together with buoyancy effects and passive scalar transport for CO2 and contaminants. Incompressible CFD for isothermal component studies (pressure drop, discharge coefficient).
CO2 is a passive scalar species with a defined diffusion coefficient. Sources are applied at occupant positions; the solver computes spatial concentration throughout the space, revealing exactly where stale air accumulates and where ventilation equipment fails to reach.
The gas turbine intake case study above achieved 16% pressure drop reduction (over 80 Pa) by replacing sharp bends with guide vanes and rounded corners. For a 160 MW turbine, a 250 Pa reduction is worth ~$480,000/year in recovered output. The same principles apply to AHUs, duct networks, and building systems.
Component-level studies: 1–3 hours. Room-scale building simulations: 2–6 hours. Multiple variants run in parallel, so a 10-configuration parametric study takes roughly the same wall-clock time as a single run.
Yes: external wind CFD for facade pressure coefficients and cross-ventilation potential; CHT for stack-effect and mixed-mode analysis. See the natural ventilation validation guide.
Rhino®, Revit®, SketchUp, and AutoCAD® import natively, along with standard neutral formats. Geometry changes propagate into the simulation without a rebuild, which is what makes multi-configuration parametric studies practical.
Meshing is automated. Manual refinement is worth applying at supply and extract openings, on louvre and diffuser blades, and across the plane where results will be read, because coarse cells at a diffuser outlet smear the jet and change the room result.
Age of air is the mean time elapsed since a parcel of air entered the space. Report it when the dispute is about fresh air delivery rather than temperature, since it identifies zones served by recirculated air that a CO2 map alone can under-state.
Yes, for standards that specify a spatial criterion: ASHRAE 55 and ISO 7730 for PMV and PPD, ISO 14644 for cleanroom classification, EN 16798-1 for comfort category, and CIBSE Guide A and B for UK design criteria. The simulation produces the distribution the standard asks for, which a single-zone calculation cannot.