Importance of Fan Curves for Fan Sizing
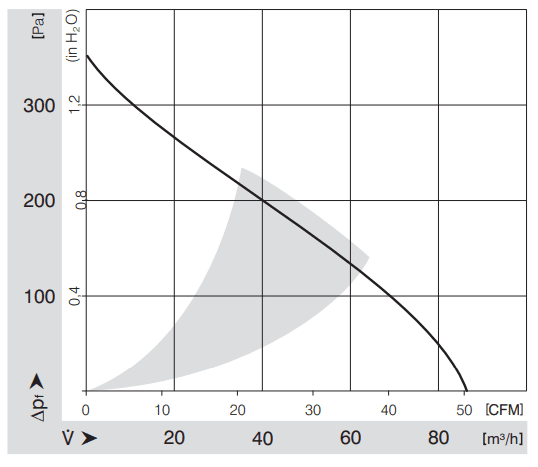
Forced convection cooling is an essential component of modern electronics where high power density devices and enclosures generate heat that needs dissipating. In many cases, natural ventilation-based heat rejection is not always enough, and fans must be used. Fan performance can be complex and based on several variables that need accurate representation in any modeling and analysis. Fan manufacturers provide a fan curve that describes the relationship between static pressure, power demand, speed, and efficiency values per-flow rate. This information is essential for cooling purposes, so we need to model the fan curve when possible. The pressure flow characteristics described by manufacturer fan curves dictate how the volume flow from a fan is affected by pressure drop. Most fan manufacturers provide this data based on standardized testing according to international standards.
Engineers evaluating different fan types and sizes in their device designs must be able to account for the fan curve and trust that it is a true reflection of how the fan might perform in real-world conditions. Creating a digital twin of the fan curve is an excellent way to simulate its performance. The SimScale platform is a cloud-native engineering simulation tool for general purpose flow, thermal and structural analysis. A typical application is the analysis of electronics enclosures for thermal management, specifically, scenario testing multiple cooling strategies. Fan behavior can be simulated in several ways in SimScale. A boundary condition where the fan inlet is placed can have a direct mass flow applied to it as a velocity inlet with appropriate fluid material properties and ambient temperature. Alternatively, a momentum source can be defined to represent the flow from a fan, and, most recently, engineers can now upload fan-curve data in a tabular format directly into the SimScale platform and use it as a boundary condition.
Thermal Performance of a Raspberry Pi Computer
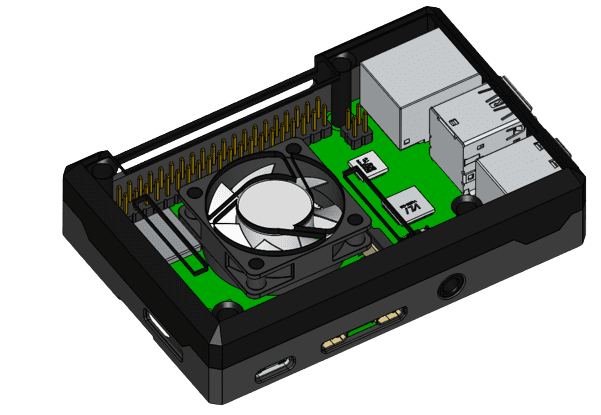
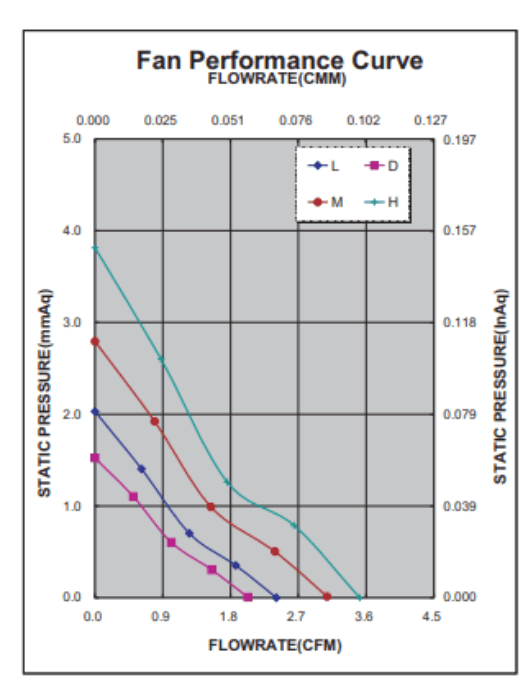
To demonstrate some of the fan modeling features in SimScale, we have simulated a Raspberry Pi computer using a publicly available 3D model of the device taken from GrabCAD. A conjugate heat transfer simulation with forced convection (fan) is used to model the computer using standard 30 mm fans for cooling. We have used manufacturer data for the fan performance, which comes in four different model types; each has a fan-curve providing data on volumetric flow rate and pressure drop (static) at ambient conditions. We have taken the 3D model and simplified it using the CADmode editing features in SimScale. The study is not interested in geometric changes to the enclosure, only in fan and cooling performance.

We can directly upload the manufacturer fan curve data and derive the fan operating points explicitly using simulation. We want to show how the manufacturer’s data can be applied to the former. We can extract the fan specification sheet data into a spreadsheet to upload into SimScale and perform a complete thermal analysis of a Raspberry Pi. In the latter case, we can conduct a flow rate study using simulation to derive the fan operating point, e.g. at what flow rate can we generate the given pressure drop and derive a system resistance curve. Using the parallel simulation capabilities in SimScale, we can run multiple operating points simultaneously and begin to generate the fan curve for evaluating how efficient these fans are for cooling purposes and whether they adequately cool the computer chips in the enclosure. This approach is instrumental when the full fan curve data is not available or to assess in-situ fan performance in the system or device (the manufacturer data is for a simple test setup).
A simplified evaluation might look like this:
- Use the original CAD model and a fan curve as the baseline case
- Derive operating points from simulation
- Derivation of system resistance curve from flow rate study
- Cooling efficiency comparison with different fan models
- Compare to directly uploading manufacturer data
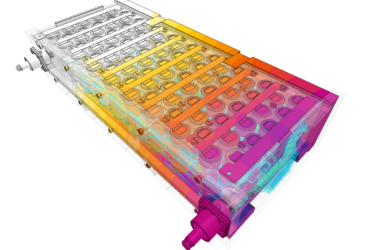
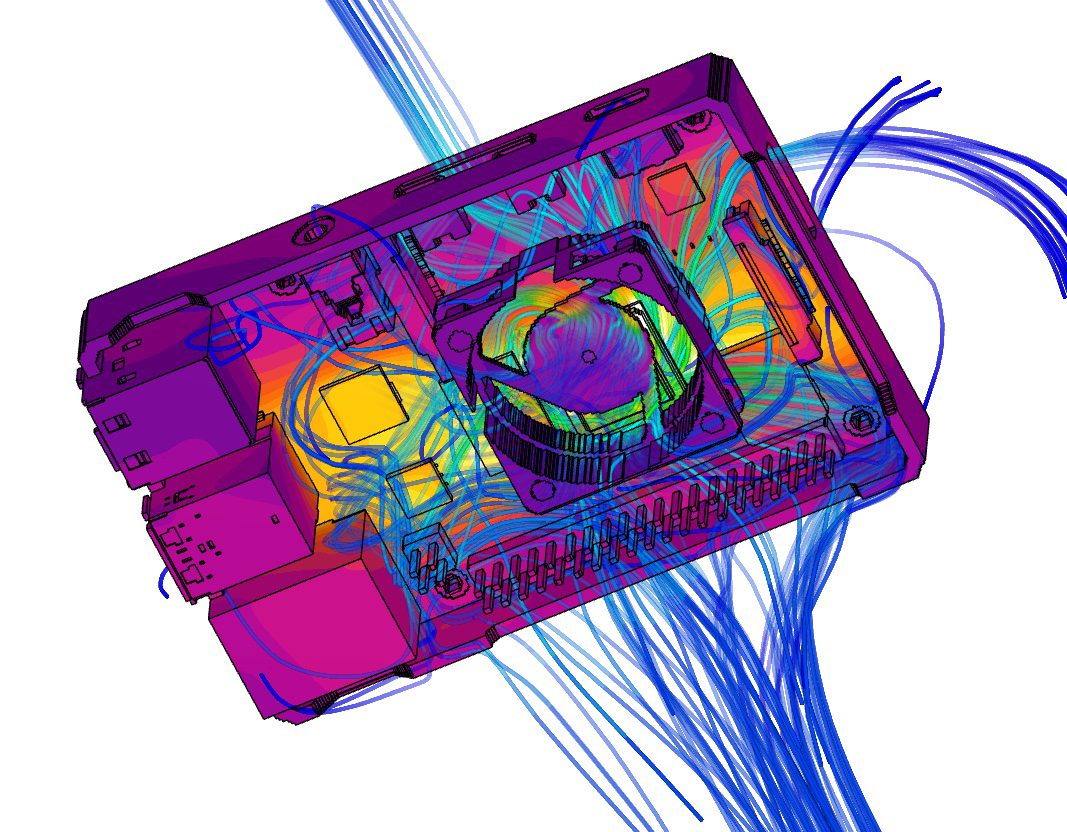
We have used the conjugate heat transfer (CHT) analysis type in SimScale. The CHT analysis type allows for the simulation of heat transfer between solid and fluid domains by exchanging thermal energy at the interfaces between them. Typical applications of this analysis type include heat exchangers, cooling of electronic equipment, and general-purpose cooling and heating systems. A multi-region mesh is required for a CHT simulation to have a clear definition of the interfaces in the computational domain. With the interfaces adequately defined, this is automatically taken care of in SimScale and, in this case, generates a five million cell mesh. For the simulation setup – fan inlet and pressure outlet boundary conditions are used, the air is used for the flow region, and several materials are specified for the chips and electronic components, including Copper, PCBs, Silicon for chips, and Aluminum for heat sinks. Power values represent the CPU (3 watts) and more minor chips (0.25 watts). The air inlet is ambient at 19.85 ℃, and a CSV file is used to upload the fan curve for later use.
Thermal Simulation of Electronics Cooling
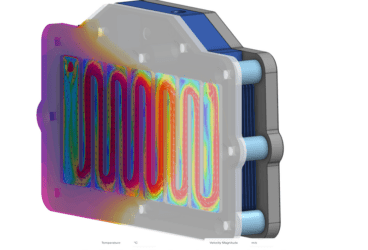
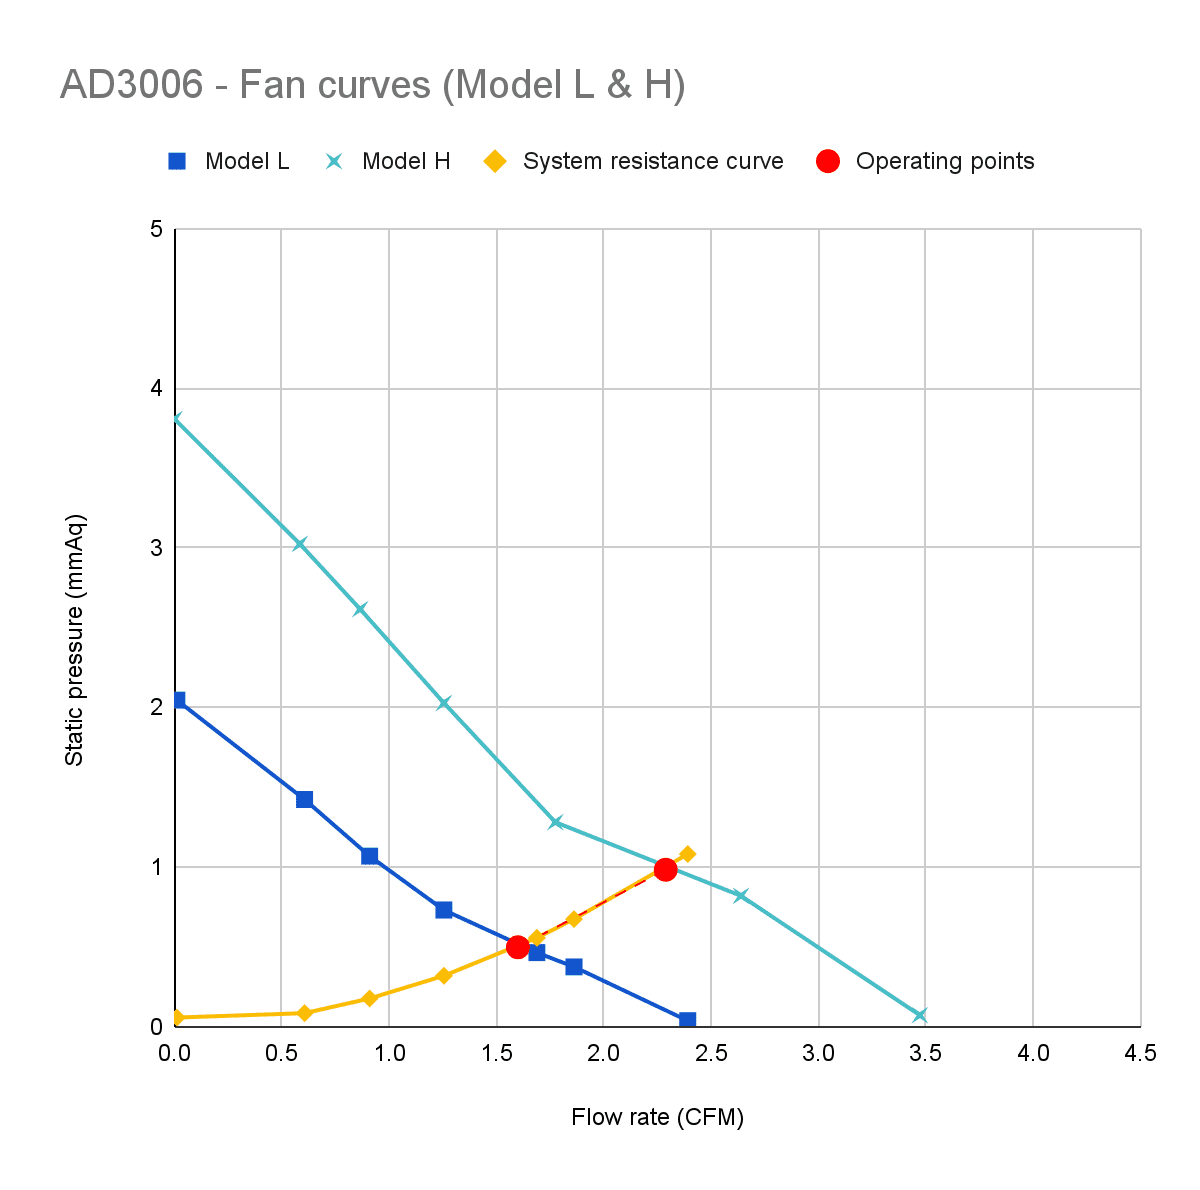
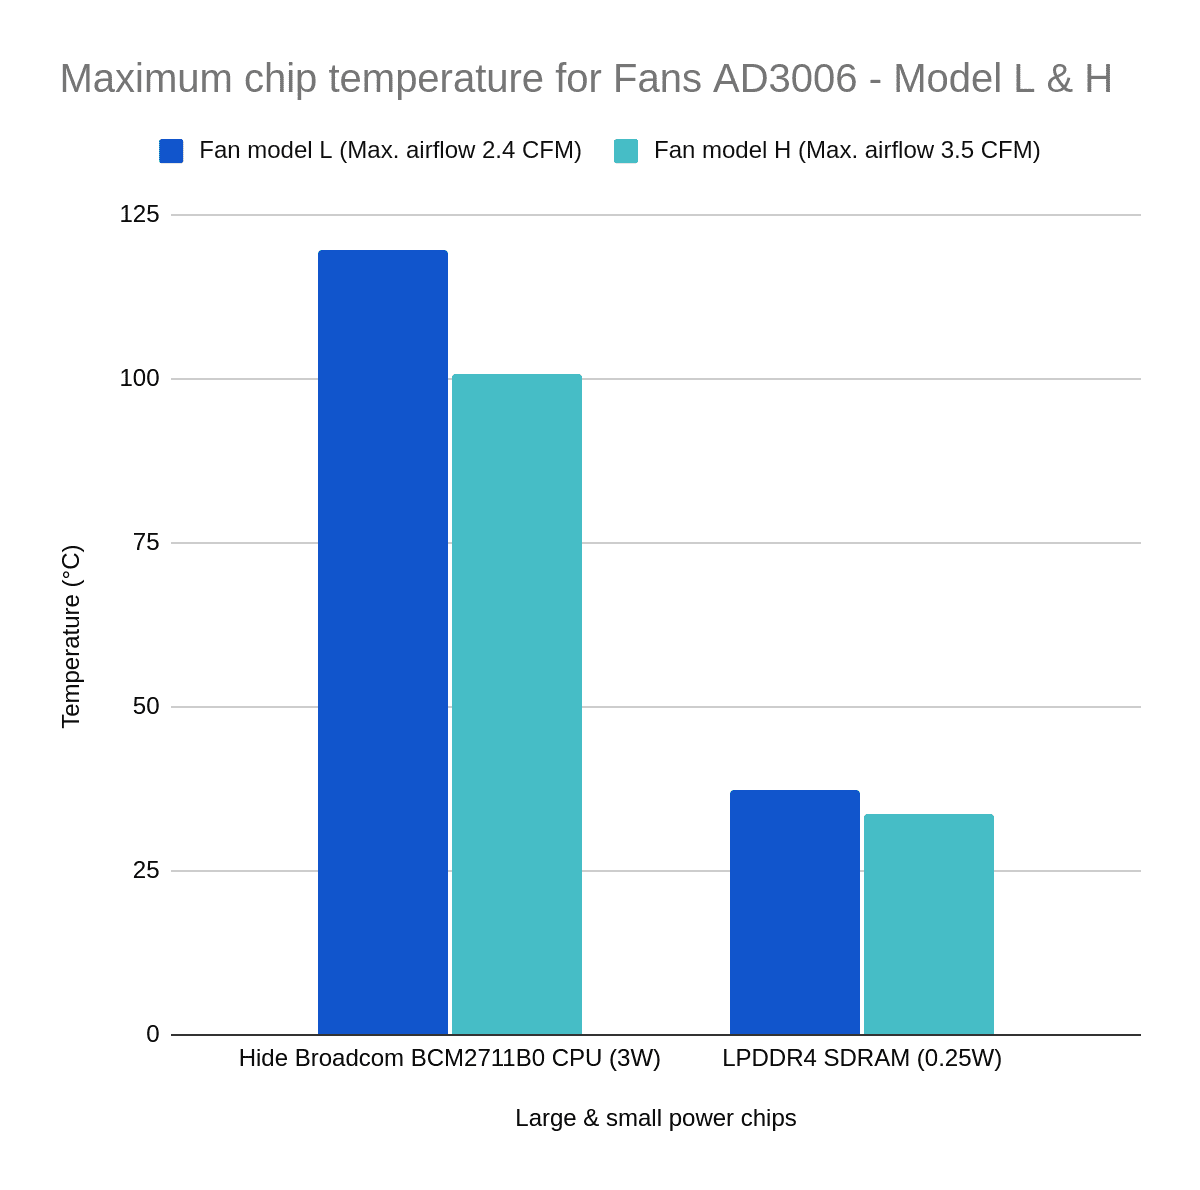
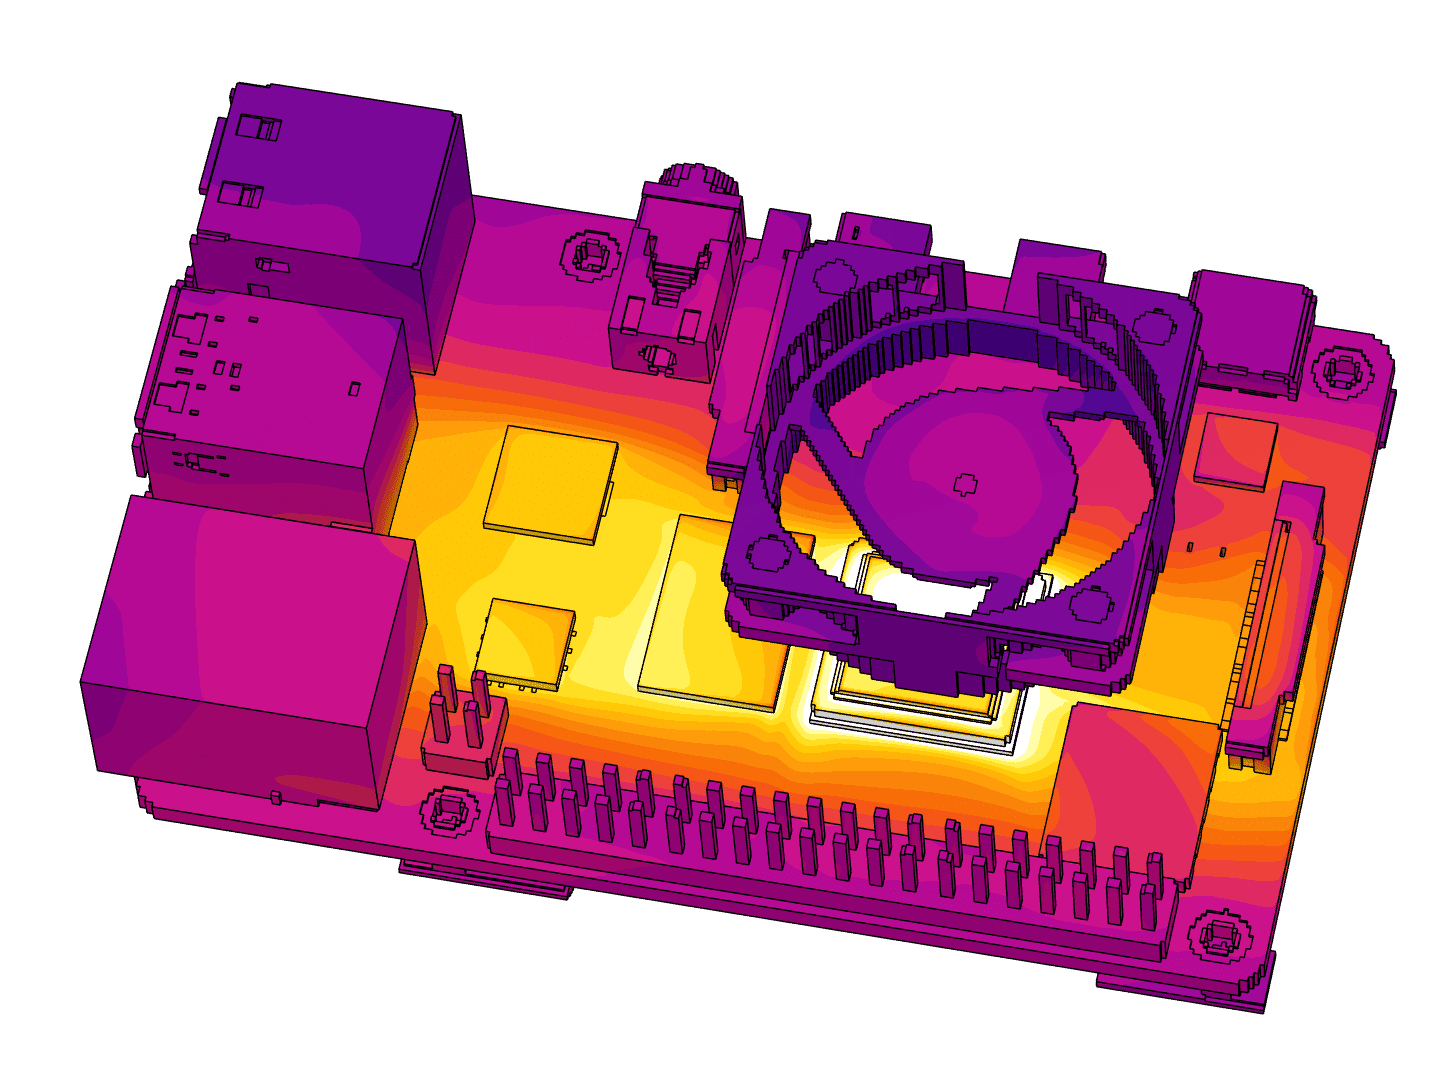
We can visualize heat removal on the chips by looking at surface area average temperatures. The images show up to 392 K on the CPU (max). SimScale will also extract point-specific data and pressure drop across inlets and outlets. Fan inlets show a 4.78 pascal (0.5 mmAq) pressure difference at a flow rate of 7.55e-4 m3/s, and this matches the fan curve data sheet for the baseline model (L). The fan outlets are at 0 gauge pressure as intended. We can easily switch the fan curve data to simulate a more robust fan (H) for comparison. Doing this shows us a 10 pascal (1 mmAq) pressure drop, and the two are compared in the image below. By doing this analysis, we can start generating a system curve for the enclosure (Raspberry Pi) derived from simulating various fan operating points (Orange line in the image below). Running ten simulations of different operating points in parallel, we generated the entire system curve for the Raspberry Pi in two hours. Chip cooling performance based on comparing the two fans is also shown, with the more substantial model H fan better at removing heat.
Fans as Momentum Sources
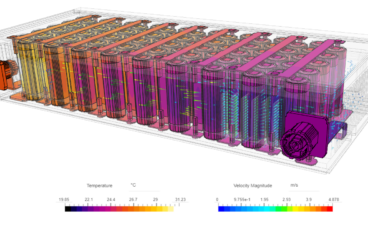
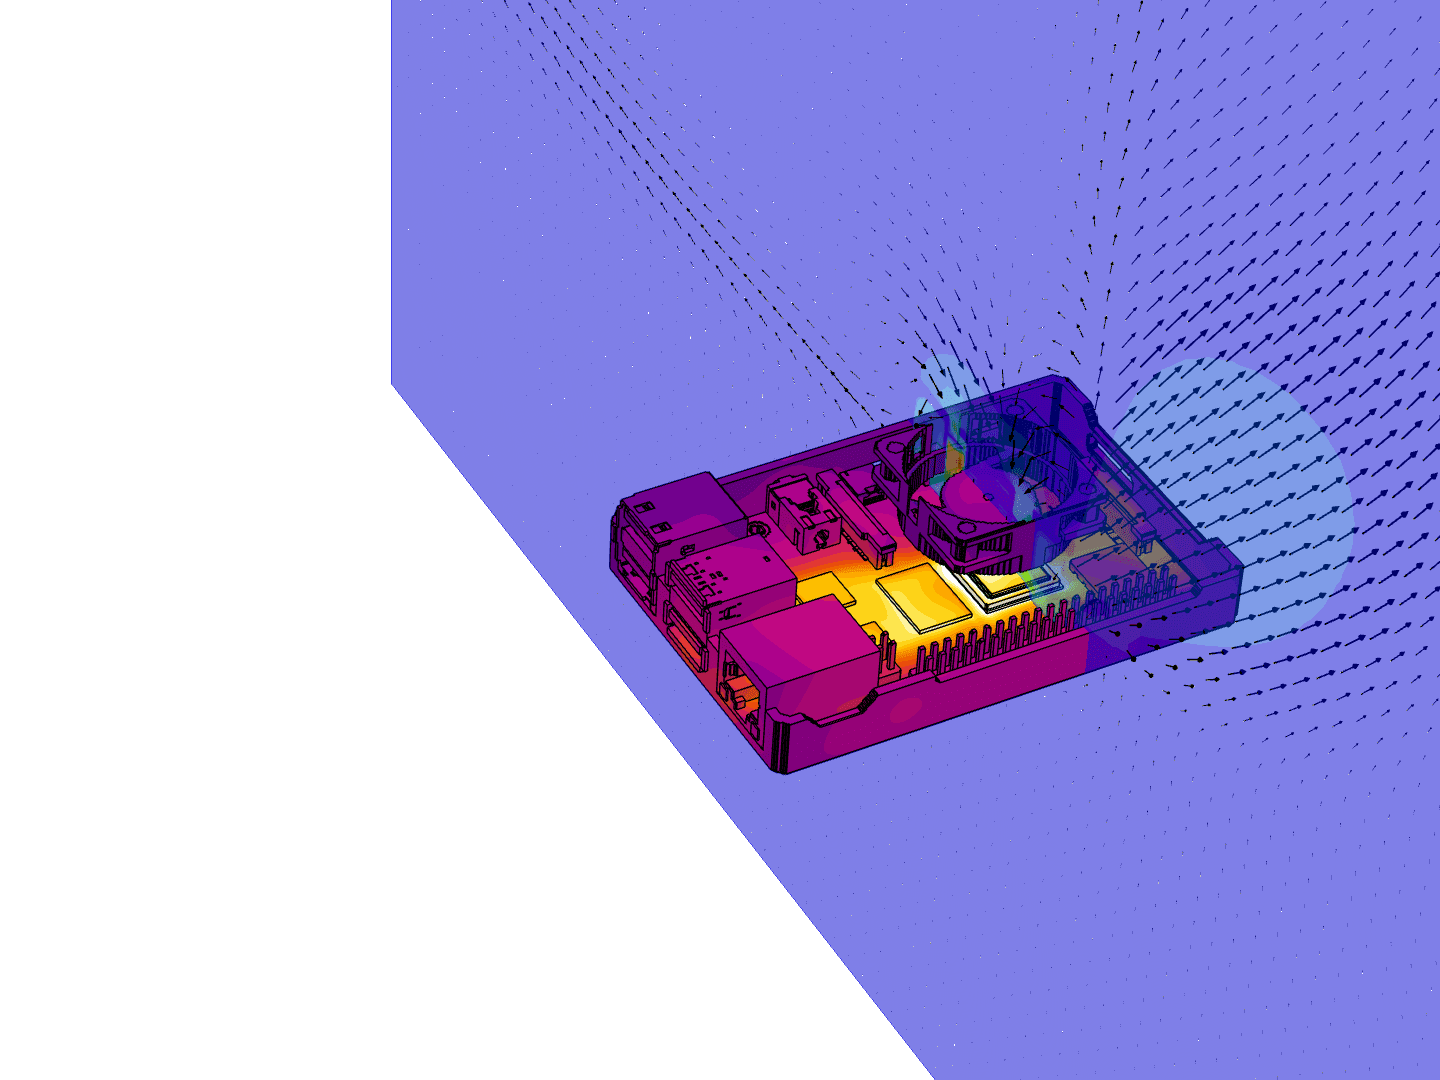
In some cases, modeling the fan as a momentum source might be needed. Momentum sources can be used to simulate fans, ventilators, propellers, and other similar fluid acceleration devices without having to model the exact geometry of the device. For instance, users might want to model a fan whose dimensions and output velocity are known. With this feature, it is possible to assign average velocities or fan curves to volumes of interest. An external flow domain is needed here to act as the air supply for the CAD opening where the fan would be, and a momentum source is used to define the flow behavior. Users can upload the fan curve, decide which direction the flow is going, and add a geometry primitive cylinder as the source. The external flow domain is used because flow enters the fan as it would do in a reality where the fan inlet is the interface of internal and external boundaries.
Summary
Simulation is now considered essential to optimizing electronic product design and performance. Using multiple methods to represent complex fan performance, engineers can quickly evaluate the cooling impact of fan types, and using the parallel simulation capabilities in SimScale, a more comprehensive range of scenarios can be evaluated. In summary:
- Fan curves: allows modeling of fans based on fan curves (flow rate to pressure drop relation)
- Fan boundary condition: users can specify a fan inlet or fan outlet as a boundary condition to model fans that are placed at the edge/outside of the enclosure domain.
- Fan Momentum Source: allows modeling of internal fans as a momentum source that are embedded within the model.
Furthermore, in the same platform, engineers can perform virtual shaker table tests, structural analysis, and more specialist fluid flow analysis using the same CAD model and simulation environment.
To learn more, watch the fan modeling webinar below: