Solar radiation has a significant impact on the indoor and outdoor thermal comfort of buildings and cities. As an additional heat source, its comprised of two components: the direct and the diffuse solar load. Since direct solar load is more important for the thermal assessment of a building design, implementing the direction is a critical step in simulating the thermal comfort of building designs.
To achieve this, SimScale has developed a tool that allows engineers to use real-life, real-time data to implement accurate solar data. This case study applies this new feature to a fictional office building in Munich, Germany during the month of March.
Case Study: Radiation Setup with SimScale
Demo Building Features
The office building is comprised of three stories with an HVAC system on every floor. The model allows us to investigate buoyancy-driven stack effects in buildings and the influence of solar load. We will also be able to judge the thermal comfort of office workers in the building and simulate airflow.

As seen in Figure 1 the building has various windows facing different directions. We will later be able to see the influence of the window location on the internal solar load.
Solar Calculator Implementation
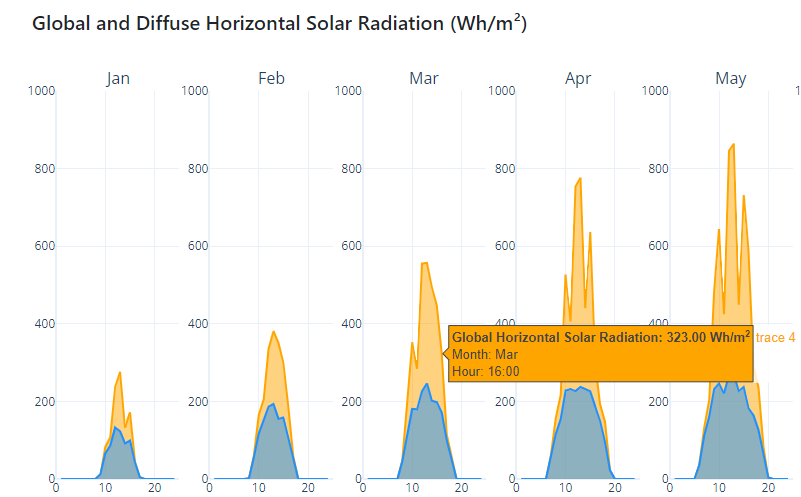
To apply the direction of the direct solar load, we need the location of the building, as well as the date and time of when we want the simulation to take place. For this case study, we have used data provided by the CBE Clima Tool of the University of California Berkeley. With the weather data from this platform, we know that the average direct solar load for central Munich at 4 pm is 323 \( \frac{Wh}{m^2}\) and the diffuse solar load is 171 \( \frac{Wh}{m^2}\). With this information, we can now implement the direction of the solar load.
The direction of the solar load depends on four main components: the orientation of the building, the location of the building, the date, and the time of the simulation. To set up the solar calculator in SimScale users follow a workflow of four steps.
1. Define the orientation of the building
For this, we will modify the north angle until the simulation setup matches reality. By default, the north direction is the positive X-Axis. Our demo office building is facing 60 degrees from the north direction. The direction used in SimScale will automatically be displayed in the viewer for you to check your setup.
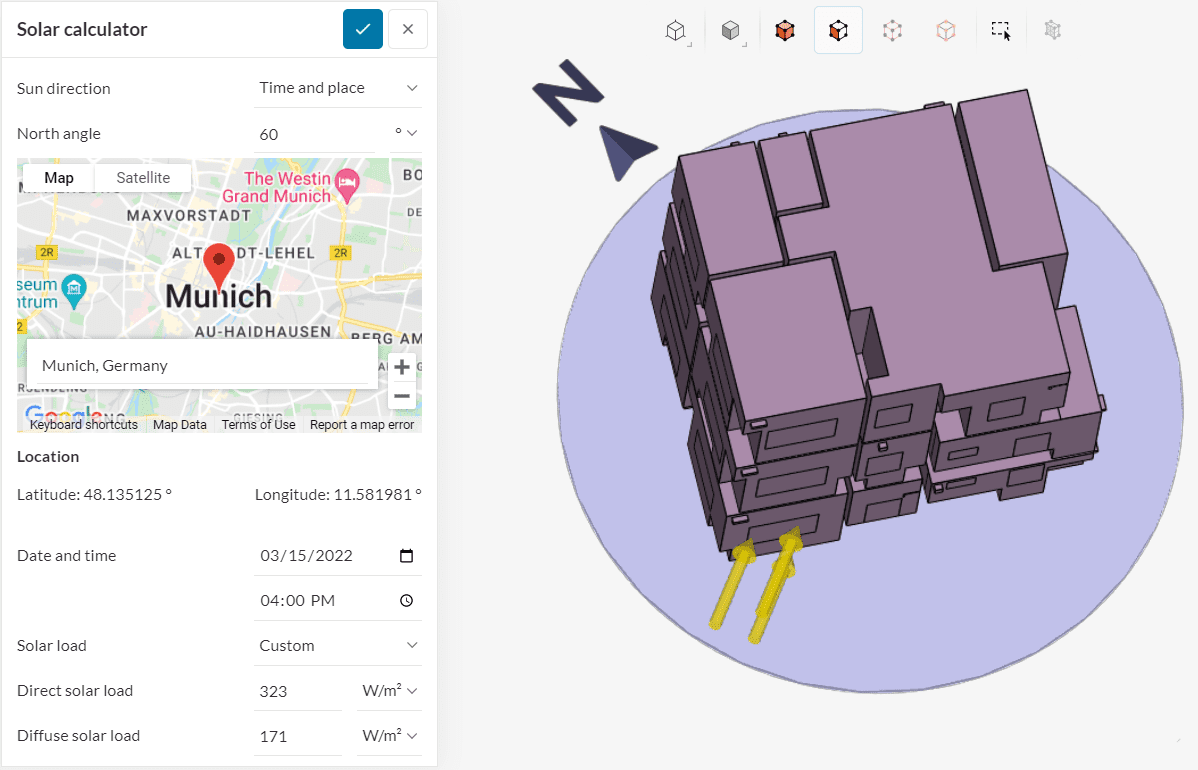
2. Enter the location of the building
This will be defined within the map of the solar calculator tool. The location entered will be marked with a pin for you to check that you have entered the right location.
3. Set the date and time for the simulation
For this case study, we are using the 15th of March at 4 pm.
4. Enter the solar load
This can be either done by direct calculation or by using custom values. Since we already have the data from the CBE Clima Tool we will use the custom option to enter the right values for the direct and diffuse solar load.
With this information, SimScale can now calculate the direction of the solar load, which is displayed with three yellow arrows. The complete setup can be seen above in Figure 3.
Demo Case Result Analysis
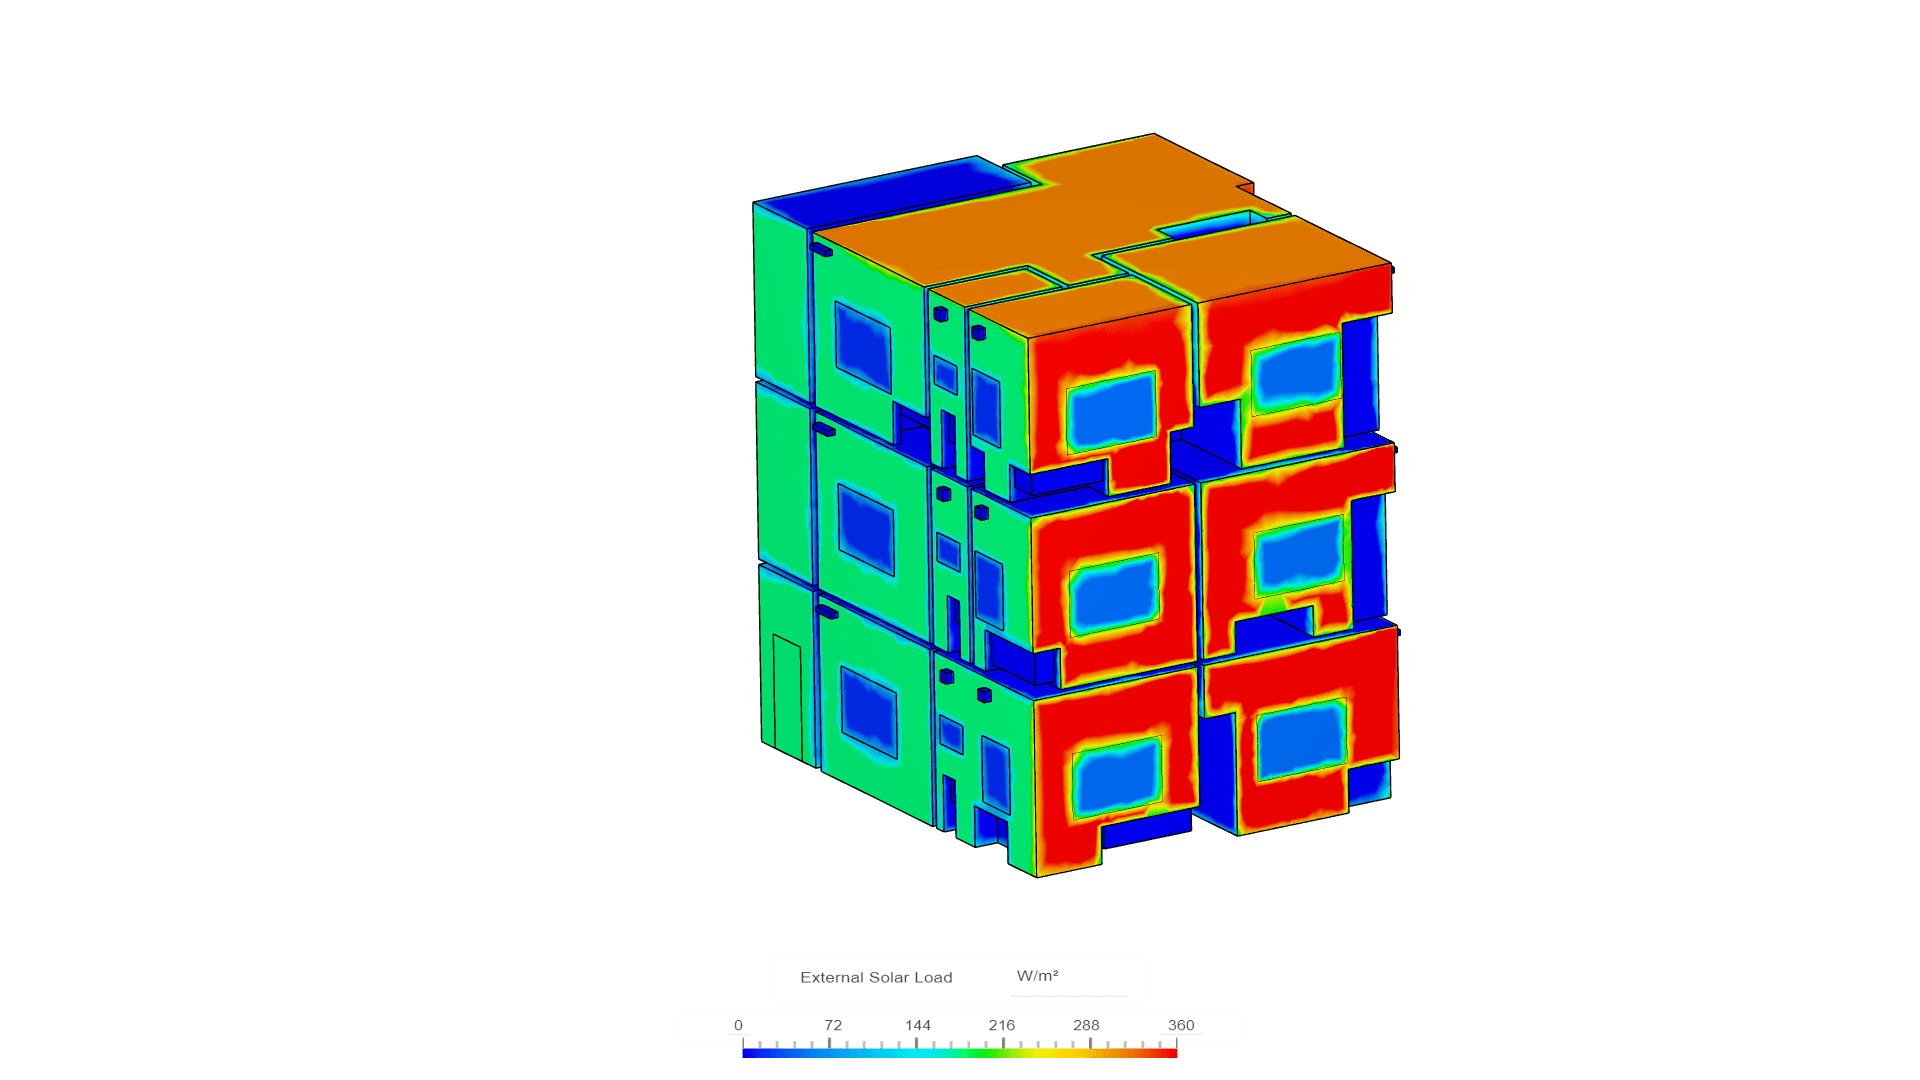
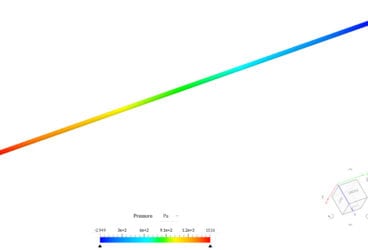
At first, we will assess the impact of the solar direction on the external solar gain. The results show the intensity of the solar load on the sides of the building facing in the direction of the sun. With the solar calculator tool, you don’t have to worry about the setup of the individual surfaces and their orientation to the sun.
Note that the roof surface shows zero external solar load. We can always overwrite the calculation tool with direct input. Here, we assume that the roof surface will be affected by a shadow that is cast by a surrounding object. Next, we will have a look at the effect of the solar direction on the internal solar load.
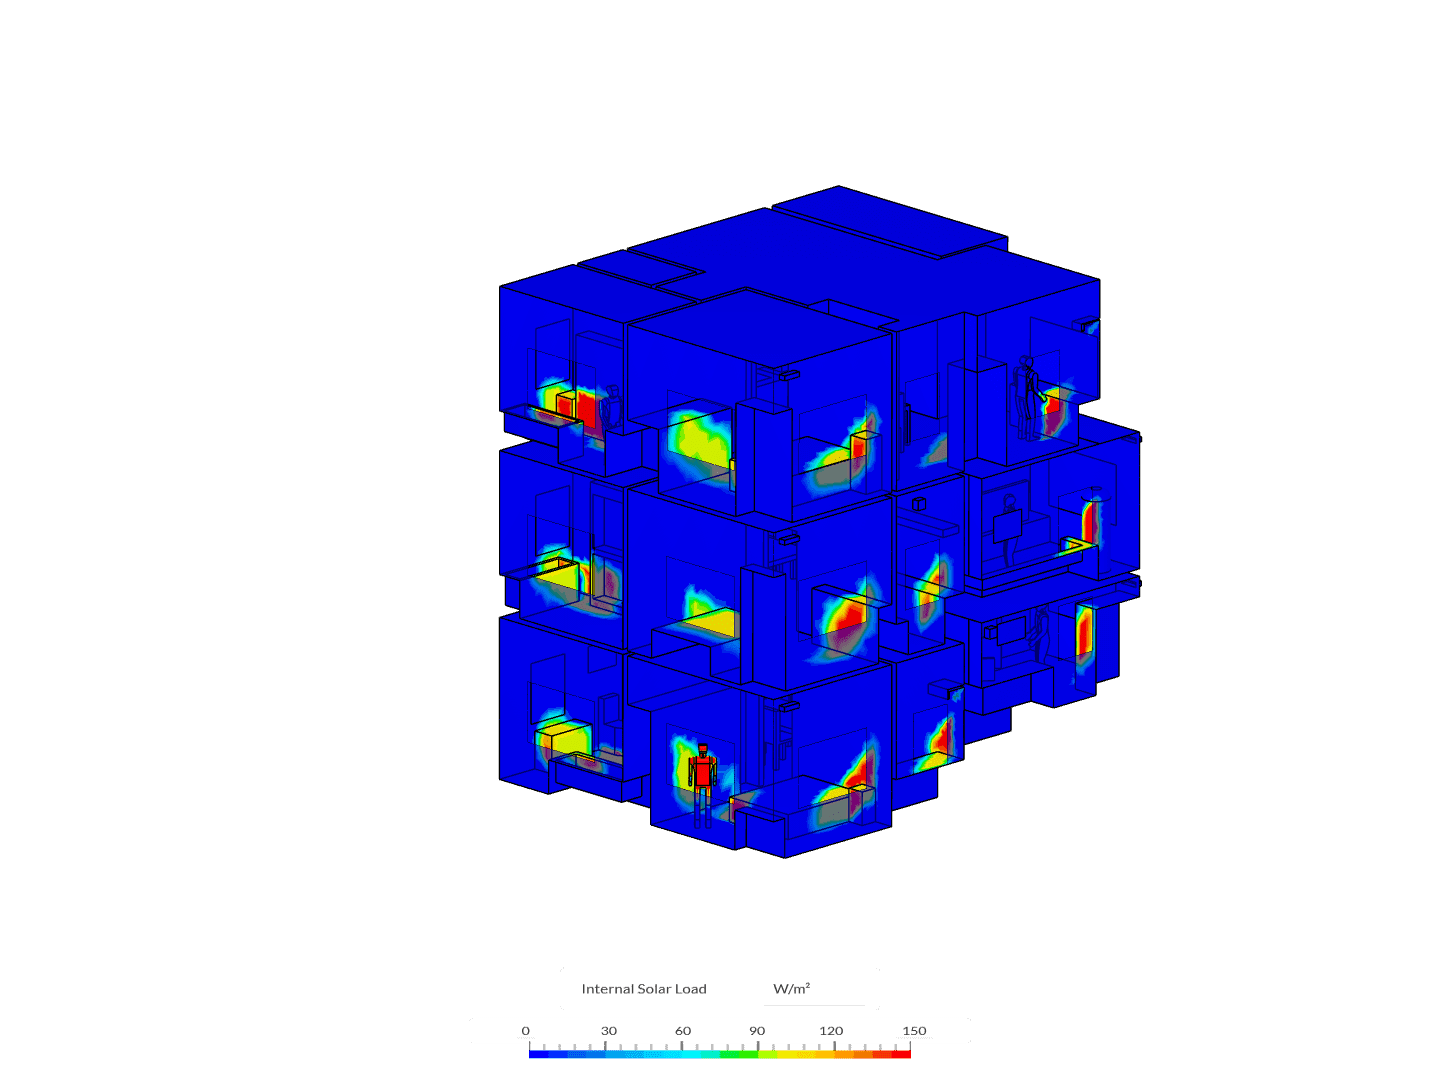
The results show that the distribution of internal solar load is mainly impacted by the sun’s direction, which was accounted for by the solar calculator. The internal incident solar radiation is as expected considering the sun direction, window material properties, and internal room layout.

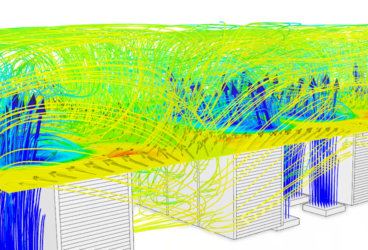
Finally, we can take a look at the temperature inside of the building. In the cross-section view of the building in Figure 6, we see the internal temperature. Due to the buoyancy of the warm air, higher temperatures in the higher floors are observed. There is also an increased solar gain in the top floors because of the higher incident radiation. Designers can simulate and visualize the difference in indoor temperatures due to solar gains and, what various devices like shading, low emissivity windows, etc. might have on thermal comfort.
As an architect or design engineer, we can use this information to address these issues early in the planning stages. More significantly, the advantage of CFD over other tools is the granular level of sub-zonal detail we can see inside a room. Visualizing the internal temperatures, stack effects from warmer air, and how air flows inside a room, can assist in the design and placement of appropriate HVAC systems and windows.
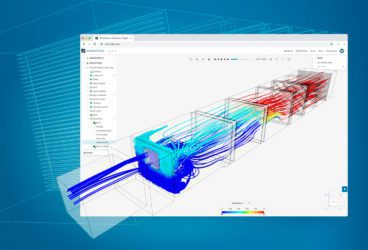
Cloud-Native Simulation for Solar Radiation Simulation
Cloud-native CFD analysis enables engineers to solve for internal and external flows, study indoor and outdoor thermal comfort, and scale HVAC device-level simulation results from room-level to building-level and beyond. With SimScale’s powerful cloud computing capabilities, multiple simulations like the one shown in this article can be run in parallel. This means that multiple solar load setups can be analyzed at the same time. For more information on the solar calculator tool, please have a look at the dedicated documentation page.