Most renewable energy sources come from the sun. Overall, hourly, the sun is estimated to provide the Earth with over 175 trillion kilowatt hours of energy and, of this, approximately 1-2% is converted to wind energy. Wind energy is a renewable, plentiful, and clean alternative to burning fossil fuels, and produces no greenhouse gas emissions. Wind turbines occupy little land and consume no water—inflicting far less damage upon the environment, compared to non-renewable energy sources. In the last decade, an emphasis on renewable energy sources and rapid growth of wind farm numbers has led to significant decreases in associated costs.
In the last decade starting in 1998, MegaWatt-sized turbines and large wind farms have revolutionized the wind energy industry, making it a potent source of renewable energy. Leading this revolution have been Denmark and Germany, who are also the largest wind energy markets.
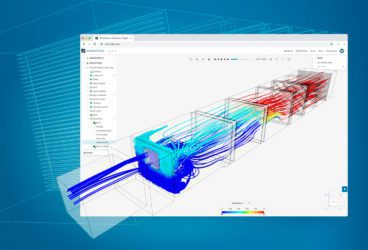
Simulation is becoming well-known as a tool for wind experiments, and in this article we explore the way the SimScale cloud-based 3D simulation software can be used for the design, simulation, and optimization of the power output of a wind farm.
Wind Farm Design Betz Law and Power Efficiency
The simplest way to assess the efficiency of a wind turbine is through the Betz Law.
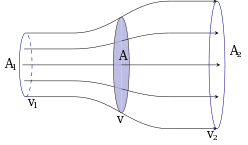
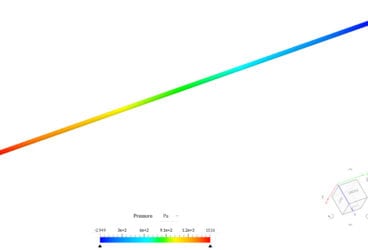
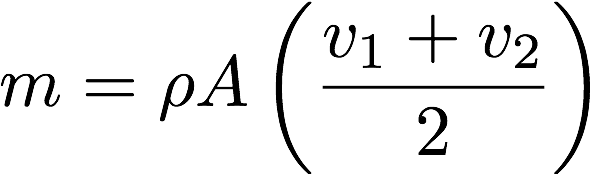
Consider the flow of air through an imaginary tube as shown in Fig 01. Initially, the velocity of undisturbed air, downstream, is v1 m/s and upstream; after passing through the wind turbine, is v2 m/s. The average mass of air (m) flowing through an area (A), can be written in terms of density and velocities as:
 The kinetic energy of the originally undisturbed air can be written as:

This change in velocity, as the wind passes through the rotating turbine blades, signifies the transfer of kinetic energy from the wind to the turbine. Using the above relation for mass, the change in kinetic energy of the wind can thus be written as:

A simple measure of the efficiency of the wind turbine can be given by the ratio of change in kinetic energy to the undisturbed energy of the wind, as: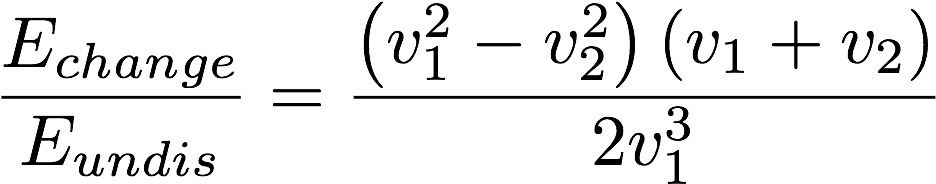
Wind Turbine CFD Optimization Parameters: Wind Farm
There are several aspects that are of importance in designing a wind farm. Some of the most important include:
- Roughness and roughness length – As one moves higher in altitude, the wind speeds are much less influenced by the ground, while at lower altitudes, the winds are affected by the friction from the ground. Roughness length is the length, above the ground, up to which the wind speed is considered to be zero. For example, the presence of cities and forests can slow down the wind considerably. In contrast, grassy or concrete land offers much less friction. Finally, water bodies offer almost no friction to the flow of winds. Now, that’s a clue as to why there are several offshore wind farms! Overall, the terrains are characterized in terms of roughness classes: water is roughness class 0; grasslands/concrete areas are 0.5; cities and large forests have a high roughness number of 3-4.
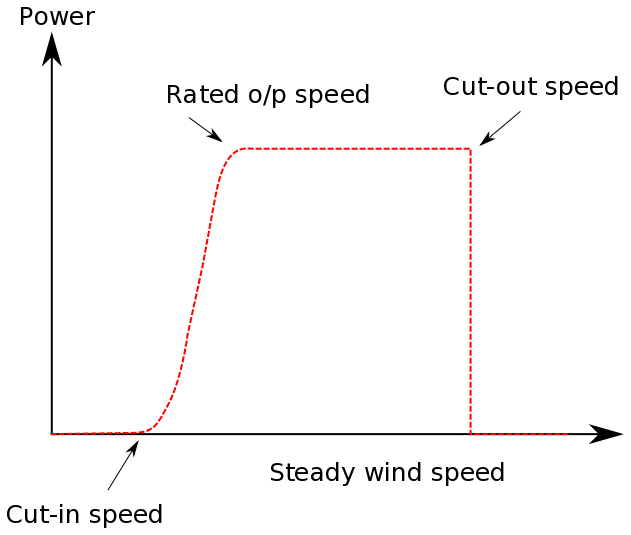
- Wind speed variability – The wind speeds are not constant—they vary through the day and also show seasonal changes. It is important to consider the magnitude of these variations. As shown in Fig. 02, the power output of the turbine depends on the wind speed and is only generated between preset cut-in and cut-out speeds. Wind conditions, as expected, are a critical parameter in optimization.
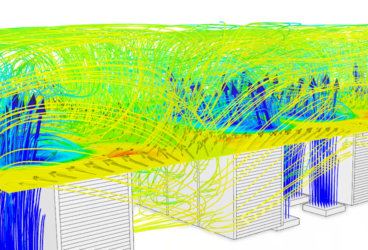
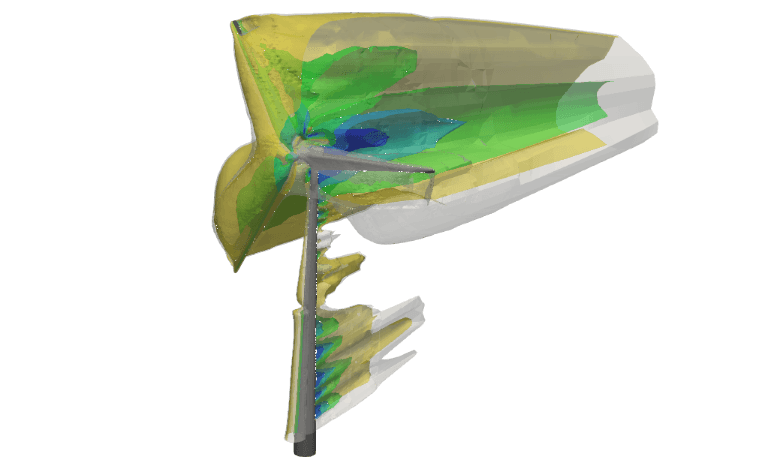
- Wind obstacles – Obstacles are presented by various objects such as cities, forests, and houses. In the presence of such obstacles, wind speeds are decreased to a large extent. In addition, they cause turbulence which can decrease the quality of wind energy. A rule of thumb here would be that the hub is at least 9 m (30 ft) higher than the nearest obstacle. In addition, several other effects commonly observed include the park, tunnel, and hill effects as shown in Fig. 03. Park effect refers to the distance between the towers. Each wind turbine produces a wake and placing a turbine in the wake can lead to significant inefficiency. The latter part of the article demonstrates the park effect in more detail.
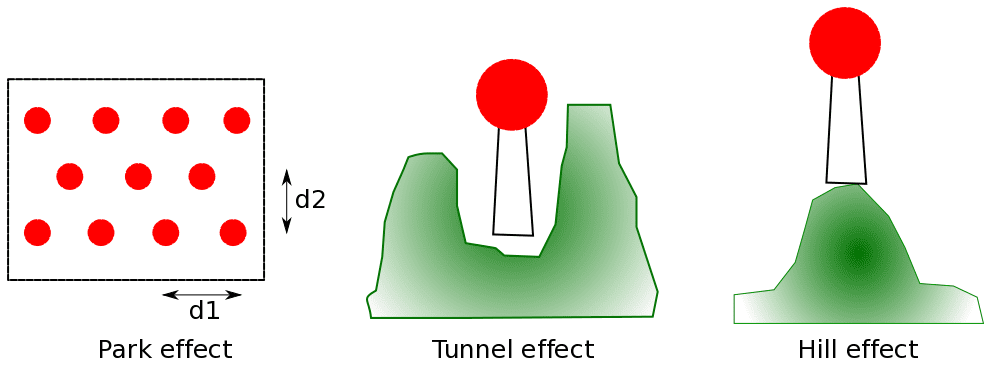
- Tunnel and hill effects – As we have generally observed, the wind speeds are much higher when compressed into smaller places like between mountains, buildings or at high altitudes. Strategically, placing the wind turbines in valleys or above hills (and elevated locations) can improve the wind speeds and the overall efficiency of the system. However, if the mountain terrain is significantly rough, it can also increase the surface roughness and needs to be accounted for in the design.
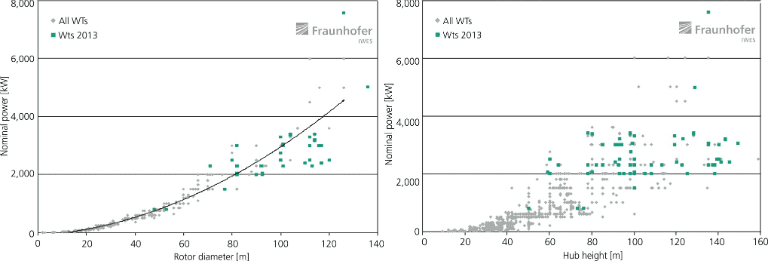
- Tower heights – It is generally expected that the hub height (or height at which the rotor is attached), is at least 9 m (30 ft) higher than any obstacle in the nearby vicinity of 100 m. The rotor diameter and hub height largely determine the power that can be generated by a wind turbine. The area of the rotor determines how much wind energy can be collected and transformed into electrical energy. The wind speed increases with height. Given that the power generation is proportional to the third power of the wind speed, the hub height has a major effect on the overall power output of a wind turbine. Fig 04 shows the variation of nominal power with rotor diameter (left) and hub height (right), while Fig. 05 shows the evolution of these over the recent decade. Over the last two decades, possible rotor diameters and hub heights have increased making wind energy a potent source for the coming decade.
- Tower arrangement – Finally, the arrangement of towers is one of the most important aspects. This is also more commonly known as the park effect. The general rule of thumb is that the distance between turbines is about 7 times the rotor diameter along the headwind. Along the crosswind, the distance is expected to be at least 4 times the rotor diameter. However, recent studies have shown that it should be at least double of this. There have also been recent studies that are using the ideas from nature (like fish schooling, the flight of long-distance birds) to better understand how wake and turbulence could be used to boost overall efficiency. This article specifically discusses how SimScale could be used to simulate the tower arrangement and optimize for best possible solutions.
Wind Turbine Simulation Software Simulation of Wind Farm
In this article, wind turbines with a hub height of around 82 m and the rotor diameter of 80 m are considered. Rotor speed is considered to be constant with an angular velocity of 1.8325 rad/s. Such a system is generally rated around 2 MW. The international standard for measurement of wind speeds is at a height of 10 m from the surface and the velocity varies as:
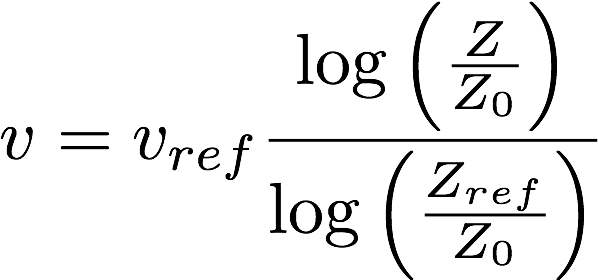 where Z0 refers to the roughness length, Z to the distance from the ground, Zref is the reference height at which the measurements are made (here 10 m) and vref is the wind velocity at the reference height (here 5 m/s). We assume that the roughness is significantly small and of the order of 0.1 m. In the simulations discussed below, in order to avoid the singularities of a log function, the above relation is simplified to an affine function as:
![]()
The fluid flow can be considered as an incompressible turbulent flow in a steady state. Here the k-omega SST turbulence model is used. The entire project can be accessed in the Public Project Library and can be imported to your account. Different arrangements are considered to analyze their effect on the wind velocity profiles and related turbulence.
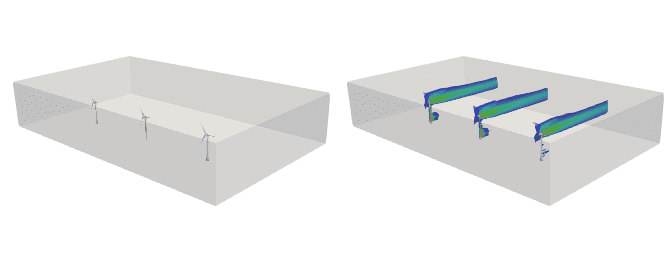
Configuration 1: Wind turbines placed one behind the other
Starting with the worst case scenario, where three wind turbines are aligned one behind the other as shown in Fig. 06.
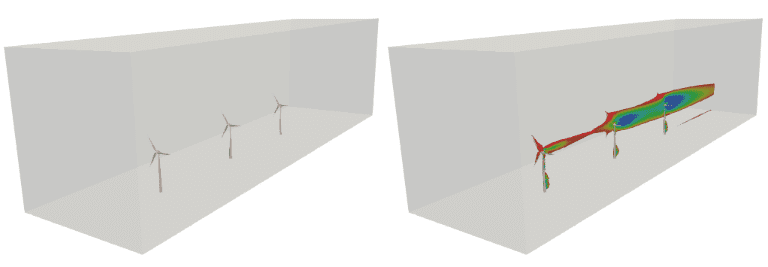
Fig. 06 also shows a cut slice of the simulation box and the influence of the first turbine on the subsequent turbines upstream is visually evident. A simple estimate shows that the input velocity for the first turbine is around 20 m/s and the output is around 10 m/s. On the contrary, the velocities downstream and upstream of the second and third turbines are almost same and leading to nearly zero power efficiency in them.
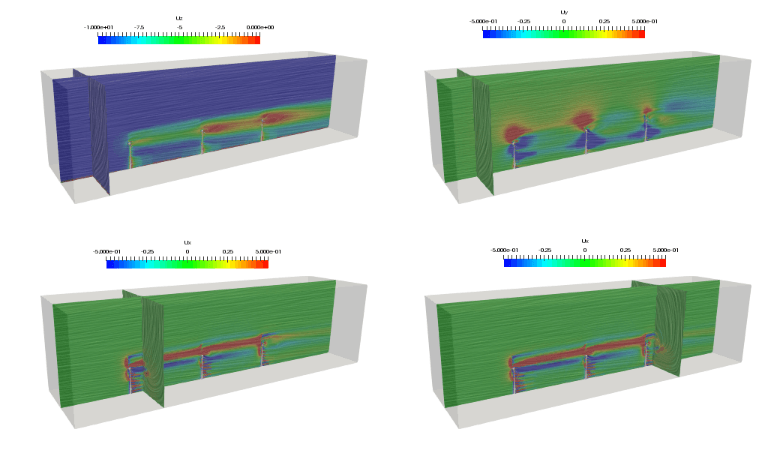
The above velocity profiles in Fig. 07 confirm the conventional knowledge that such a placement is highly undesirable. There is a significant influence of wakes and turbulence from the turbines in front. However, if the turbines are placed reasonably far away, the effects of such wakes can still be negotiated.
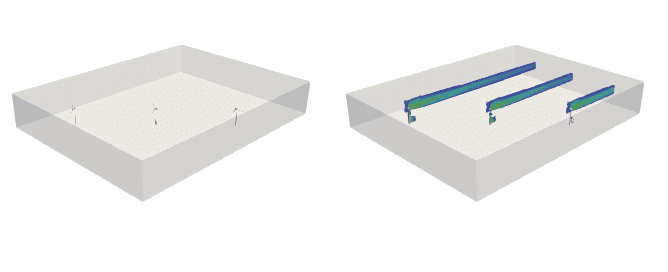
Configuration 2: Wind turbines placed one beside the other
Alternatively, it is possible to place the turbines one beside the other, to the direction of the headwind, as shown in Fig. 08.
Unlike the previous configuration, now if the wind turbines are placed beside each other as seen in Fig. 08, all the turbines are faced with the same wind speeds. Thus, as the air flows across the turbines, the turbines can be equally effective.
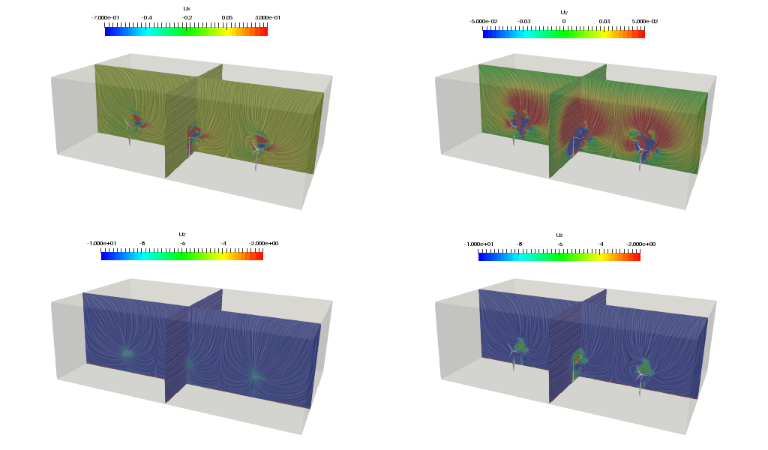
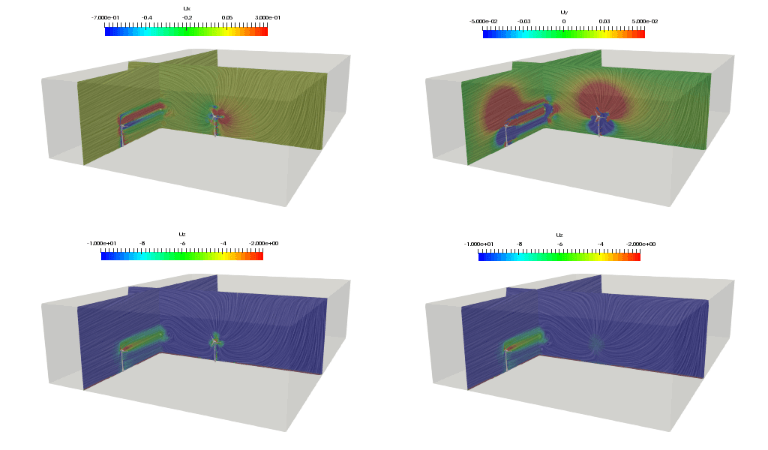
Fig. 09 depicts the velocity profiles. The downstream velocity profiles for u-x and u-y show minor interaction between the turbines. The turbines are just placed about three rotor diameters away in these simulations and such an interaction should be expected. At double these distances, such interactions tend to zero. Such simulations can be easily performed with SimScale with much larger distances to optimize the wind farm.
Configuration 3: Wind turbines placed along a diagonal
The last configuration is to place the turbines one beside the other, along a diagonal, to the direction of the headwind, as shown in Fig. 10. Most commercial wind farms use such configurations.
Wind turbines need to always face the direction of the wind since any wind from the side will not cause the rotation of the turbines. Thus, the turbines are allowed to “yaw” or rotate towards the direction of the wind. Placing the turbines along a diagonal can also result in much smaller areas required. As shown in Fig. 11, as long as sufficient distances are maintained along the two directions, it can provide a compact way of packing more turbines in the same area.
As shown in Fig. 11, the diagonal distance between the turbines is the same as the horizontal distance in the previous configuration. Yet, just assessing pictorially, the interaction of wakes generated by the turbines are much smaller.
Wind Farm Design Conclusion
It’s important to note that a simulation does not necessarily need to have the same number of turbines as the real farm. Using periodic boundary conditions that couple two opposite faces will allow the simulation of a wind farm of any size.
This is just a glimpse of how SimScale could be used to simulate various practical problems related to wind engineering. A much larger wind farm can easily be considered to test the fluid flow patterns and optimize the turbine placements. In addition to the park effect discussed above, hill and tunnel effects, the effect of rotor diameter and/or hub height could also be explored using SimScale. The next time you plan to build a wind farm, take advantage of the SimScale simulation environment.
Want to read more? Discover this success story about the testing and optimization of a micro wind turbine with CFD software from SimScale.
Discover all the simulation features provided by SimScale. Download the document below.