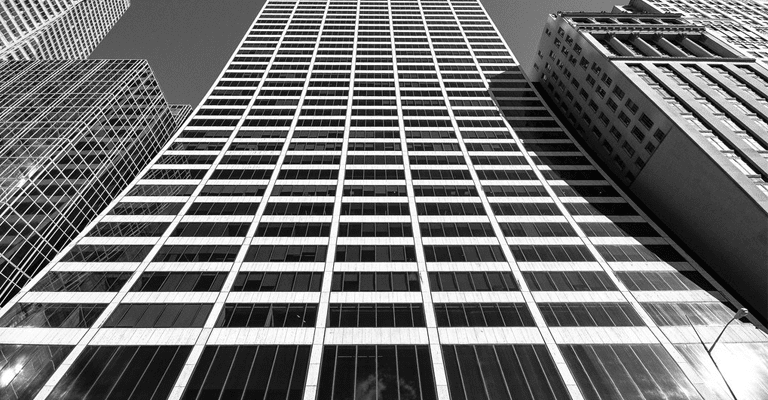
The W. R. Grace Building is one of the most notable skyscrapers ‘gracing’ the NYC skyline, and has been since 1974. Located at 1114 Sixth Avenue, the building overlooks Bryant Park and the New York Public Library’s main branch. One of the distinguishing factors of this 50-story midtown skyscraper is its unique shape, as the facade slopes upward from the base of the building. The Grace Building takes up 30m by 135m of some of the city’s most coveted real estate, and is home to many offices including Insight Partners.
Inside the Grace Building: Insight Partners
Insight Partners is a leading global venture capital and private equity firm investing in high-growth technology and software companies that are driving transformative change in their industries. If you haven’t heard already, Insight Partners led SimScale’s Series C funding round, with participation from existing investors such as Earlybird, Union Square Ventures, June Fund, Vito Ventures, Bayern Kapital, and High-Tech Gründerfonds.

To read the whole story, check out this article from BusinessWire. As this news came to press, we decided to show our appreciation and as a small token of gratitude, simulate their office building for pedestrian wind comfort.
Wind Comfort Around Insight Partners’ Office Building
The Grace Building, with its unique surroundings in downtown Manhattan, offers interesting features from a wind engineering and pedestrian wind comfort perspective. One differentiating factor in terms of expected wind effect for the Grace Building is the nearby Bryant Park, which we will explore in more detail.
How Does Bryant Park Effect Wind Comfort Around the Grace Building?
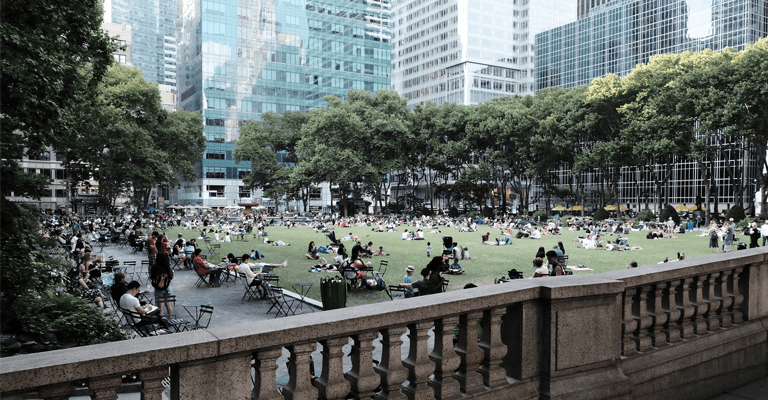
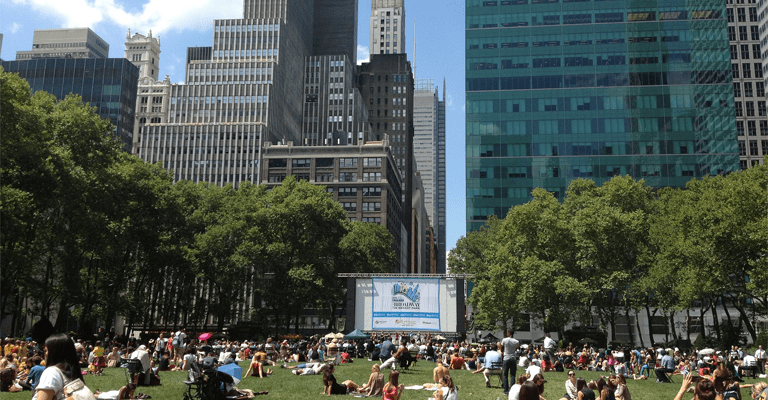
This privately-managed public park spans 9.6 acres, and hosts free and fun events for city dwellers and tourists alike, such as ice skating, entertaining shows, and even winter bumper cars. Additionally, it is a prime spot to find employees from neighboring offices having a coffee or a quick bite to eat. Yet, the park wasn’t always a popular destination. It was only after a large restoration project in the 1930s that it began to see regular foot traffic.
One of the key renovations was aimed at improving the overall landscape, and the planting of around 300 trees. Although this effort was aimed at providing shade to summertime strollers and park dwellers, we couldn’t help but wonder, what impact did this have on the overall pedestrian wind comfort of the area?
The Question: Do Trees in Urban Areas Mitigate Negative Wind Effects at the Pedestrian Level?
For this project, we simulated two different scenarios, one using a model without the integration of trees around the park and near the building, and the second including the effect of these trees. The purpose of this was to find out if planting trees around urban high-rise buildings can be an effective strategy to mitigate the undesirable effects of airflow, leading to wind discomfort at the pedestrian level.
To begin, we used CADmapper to extract the 3D model of the surrounding city area. We wanted to have the right level of detail for the building itself, as well as include some more iconic buildings like the NY public library and the Bank of America building. For this, we extracted the 3D models of these buildings from the Sketchup online CAD library. We then inserted them into the main CAD model, for a more holistic simulation.
Pedestrian Wind Comfort Simulation Setup
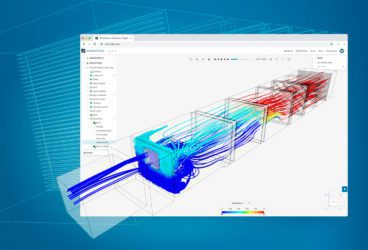
Once the final CAD model was complete, we imported it into the SimScale platform. Next, it was time to collect known wind data. From the wind rose data imported from our meteorological 3rd party partners, we observed that the predominant winds affecting the region could lead to pedestrian-level discomfort, especially in the front of the Grace Building (in Bryant Park).
Area of Interest
For the next step, we selected an area of 300m radius around Bryant Park and ran 16 different wind directions simultaneously, for both cases (with trees surrounding the area, and without trees). The magnitude and the frequency of these wind directions were defined by collected meteorological data.
Porous Region Integration
Luckily, this case created the perfect scenario to test out our latest feature, porous region integration. This feature allows users to define certain regions or volumes that would correspond to trees and bushes. Porosity values can now be used to define how well or how poorly the air would flow in these zones. Therefore, we used this feature to better define the trees in the immediate area.
Interpreting The Results Using Lawson Comfort Criteria
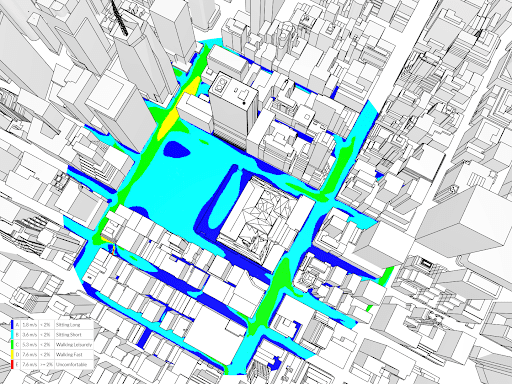
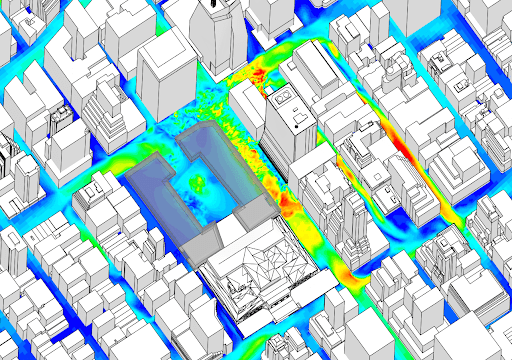
The simulation results (pictured above) show the Lawson Wind Comfort criteria plot, combining the data from both the velocity results at 1.7m above the ground as well as the given meteorological data.
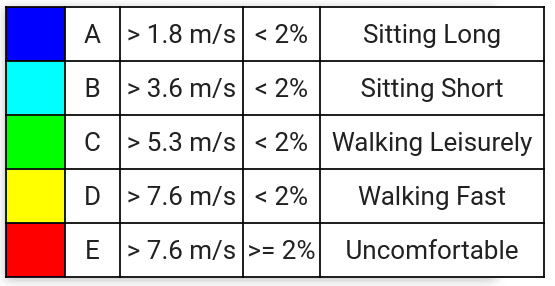
With this particular comfort criterion ranging from “Sitting Long” in dark blue to “Uncomfortable” in red, the color map below highlights zones of discomfort for certain activities around the Grace Building. Next, we went one step further to determine the most interesting wind direction out of the 16 evaluated, as well as what this means for pedestrians around the Grace Building.
Interpreting Wind Analysis Results: South-South West Direction
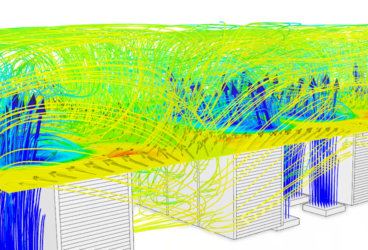
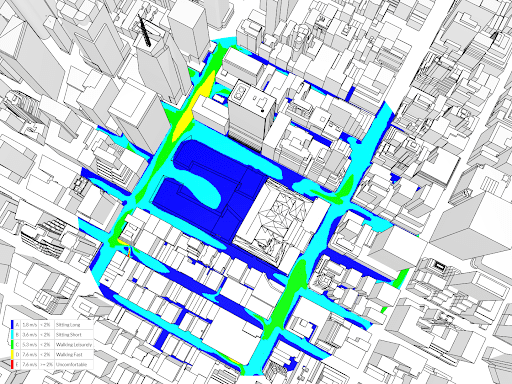
The images below show the results of velocity data, focusing on the wind direction with the most interesting effect, as it creates a downdraught on the building facade. This can be clearly seen by the color scheme from blue (slow) to red (fast). Narrow passages between streets, for instance, will generally experience higher levels of wind velocity. The reasons behind specific zones experiencing accelerated wind levels, and therefore higher discomfort, are explained in one of our recent webinars about building aerodynamics and wind effects, where we establish and extrapolate on the connection between wind effect generated by urban landscapes and the comfort that passersby experience.
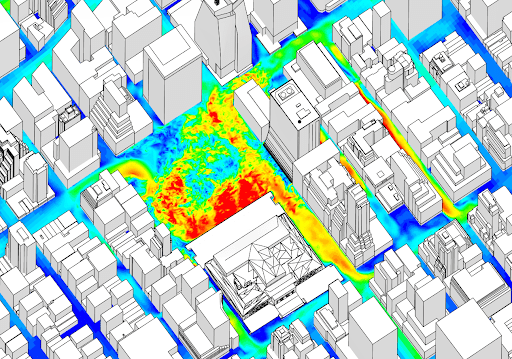
The wind velocity map confirms that the incorporation of trees does, in fact, improve wind comfort in the area facing the Grace Building, as well as behind the NYC public library (as shown below). As wind gusts reach this area, the velocity will decrease from the “porosity” that the trees and their leaves create. This result shows that based on the number of trees planted in the area, wind speed is decreased in an inversely proportional rate. In laymen’s terms, the more trees, the better!
This effect is especially appreciated in this particular place, where a downdraught effect can be observed on the Grace Building facade when the wind comes from a South-South West. This wind phenomenon appears when a tall building facade overlooks lower buildings that are facing the wind and redirects the airflow downward. This created undesirable acceleration of the air, and vortices at the pedestrian level as it can be seen below.
All and all, one can see that the trees play an important role in the airflow pattern, mitigating the downdraught effect of the wind coming onto the face of the building.
What Does This Mean for Employees Working in the Grace Building?
Looking at the results of both simulation scenarios (pictured above), one can notice a significant improvement in overall comfort level with the inclusion of trees and shrubbery, especially in the central zone, facing the Grace Building. The dark blue “Sitting Long” category is much larger (shown in the above images), expanding even to the middle section of the park, and following the shape of the aforementioned tree plantation. This finding concludes that the Bryant Park restoration efforts of long ago had a significant impact on the pedestrian wind comfort of today!
In conclusion, through wind analysis from SimScale, we have determined that there is a large area around the building where pedestrian comfort is achieved, and our friends at Insight Partners as well as other employees working in the Grace Building can benefit from enjoying outdoor seating for coffee or lunch breaks, as well as relaxing in or strolling through the park without worrying about windy discomfort.
Interested in Learning More About Wind Comfort Analysis? Check Out These Resources From SimScale:
- Wind Comfort Criteria: Lawson, Davenport, and NEN 8100
- How to Analyze Pedestrian Wind Comfort with SimScale
- Sustainable Wind Engineering: The Stockholm Royal Seaport Project