When thinking about the life of traditional lighting technology such as incandescent lamps, engineers can easily picture a catastrophic failure when the filament suddenly burns out, and the lamp bulb no longer emits any light. Light-emitting diodes (LED), as a more recent lighting solution, don’t fail in such a way if they employ a proper LED cooling strategy. Instead, their light output slowly diminishes over time.
Over the course of their lifetime, very often over the 50K hour mark, most will continue to emit light until it diminishes in such a way it provides notice to its users; time to replace the bulb.
Gauging the Lifetime of an LED
Due to this unique characteristic, a metric called the lumen maintenance, or lumen depreciation, is used to determine the lifetime rating of an LED light source. It is defined as luminous flux that an LED, or rather the LED performance, maintains until falling below a specified percentage.
For industrial applications, the most commonly used lumen maintenance is L70, which refers to the number of hours for which the LED light output has dropped to 70% of its original lumen level. In-depth research conducted by ASSIST (Alliance for Solid State Illumination Systems and Technologies) highlighted this value after having observed that most users hardly notice a decrease in light intensity, even past 70% of their original luminance value.
Every lighting device manufacturer following industry standards aims at providing such a quality metric to its customers as a reputable and accepted standard in the industry. Obtaining such a value is essentially a combination of physical testing and extrapolation-based data thereon.
Physically testing LED performance, and ultimately its LED cooling strategy, for the entire lifetime (50K+ hours) would mean the light would need to be turned on 24/7 for 5.7 years. As this testing timeline innately lacks feasibility, the IES (Illumination Engineering Society) created the LM-80-20 specification.
The LM-80-20 Specification
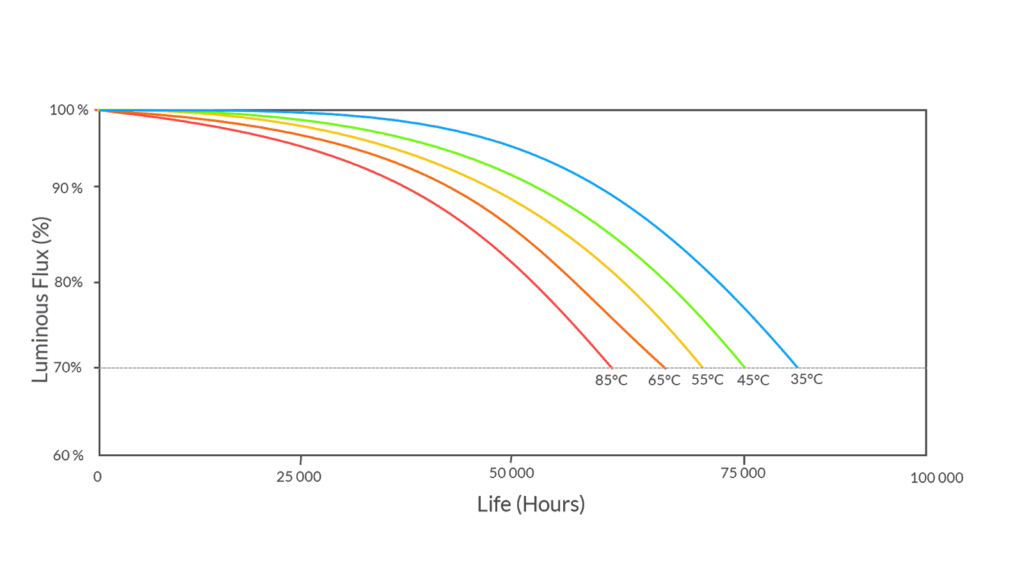
This standard is an approved method for testing LED lamps, arrays, and modules. It aims to determine the lumen depreciation characteristic and report the results over a period of 6K hours to 10K hours. A respective device is tested at 3 junction temperatures; a temperature that the manufacturer selects, 55°C, and 85°C.

In this test, the junction temperature refers to the temperature of the LED die inside the LED lamp as it is considered an excellent indicator of the quality of the thermal management of the whole system. Indeed, the higher the temperatures, the higher the luminance depreciation is, as shown in the graph below.
Once the LM-80 testing has been carried out with a minimum of 6K hours, the collected data points are used to extrapolate the lumen maintenance life to determine the L70 value. This method of extrapolation uses an exponential curve fit which is described by the TM-21 specification and is now recognized as the predominant standard for extrapolating luminous flux values. With this extrapolation method, the time to drop to a certain level of luminous flux can be calculated and would typically range from 36K to 60K hours.
As mentioned previously, the lumen maintenance over the lifetime of the LED will largely depend on the operating temperature of the LEDs, and therefore an efficient thermal design, aka LED cooling, is paramount. In this context, design engineers must ensure that their product design maximizes heat dissipation so that the LED temperature is as low as possible under the given operating conditions. While physical testing for thermal management is common, the cost and labor that come with it make the use of numerical simulation a viable addition for faster and more reliable predictions and optimization.
LED Cooling Testing With Thermal CFD Simulation
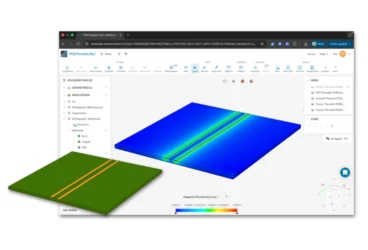
Numerical simulation, in the form of a computational fluid dynamics (CFD) simulation, comes with a number of advantages when compared to physical prototyping and testing. With 3D modeling being recognized as a standard design tool, it is easy to use these digital assets created to form a digital prototype that can then be simulated under operating conditions. These include multiple LED cooling strategies; forced or natural convection, liquid or air-cooled.
LED Cooling: Lighting Simulation Setup
The simulation setup can be easily carried out with minimum investment in time, cost, and training, over a vast array of designs that can be simulated in parallel. The most efficient design in terms of geometry, size, layout, and material selection can, therefore, be easily identified. In physical testing, it is typically very difficult to measure the LED die temperature by direct mechanical means, and it can often lead to inaccurate results.
Some manufacturers use some approximations, with the solder point temperature (the temperature of the thermal pad on the bottom of the LED lamp), the thermal resistance between the LED junction and the solder point of the LED lamp, the current, and the voltage through and across the LED lamp. With the use of CFD simulation, this junction temperature can be easily assessed through a surface temperature probe. In addition to that, numerically simulated prototypes will give an accurate representation of the temperature distribution across the entire system, highlighting hotspots, excessive pressure drop, and flow recirculation zones. This kind of qualitative result gives explicit information that leads to better performance and efficiency. For instance, recirculation flow regions can be identified and design changes in certain areas can be made so that such effects are mitigated.
To find out more about the technical details of our new CHT solver, download and read the white paper below.
Case Study: LED Cooling Through Liquid Cooling
This LED cooling project illustrates a typical use of thermal CFD analysis as a temperature and water cooling performance prediction tool for a 2x160W COB Series UV LED. These devices are primarily used for curing applications, as they emit light at specific wavelengths. The main objective here is to determine the temperature of the boards and make sure they stay below the recommended temperature of 40°C with the suggested water cooling block design running with 0.2m/s inlet velocity.
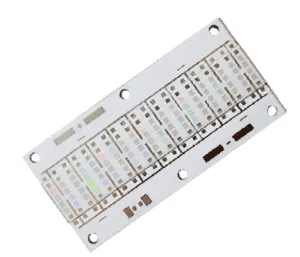
The setup starts with importing the 3D geometry that represents the COB LED and its proposed design for the cooling block onto the SimScale workbench. The exploded view below shows the COB LED and its components.
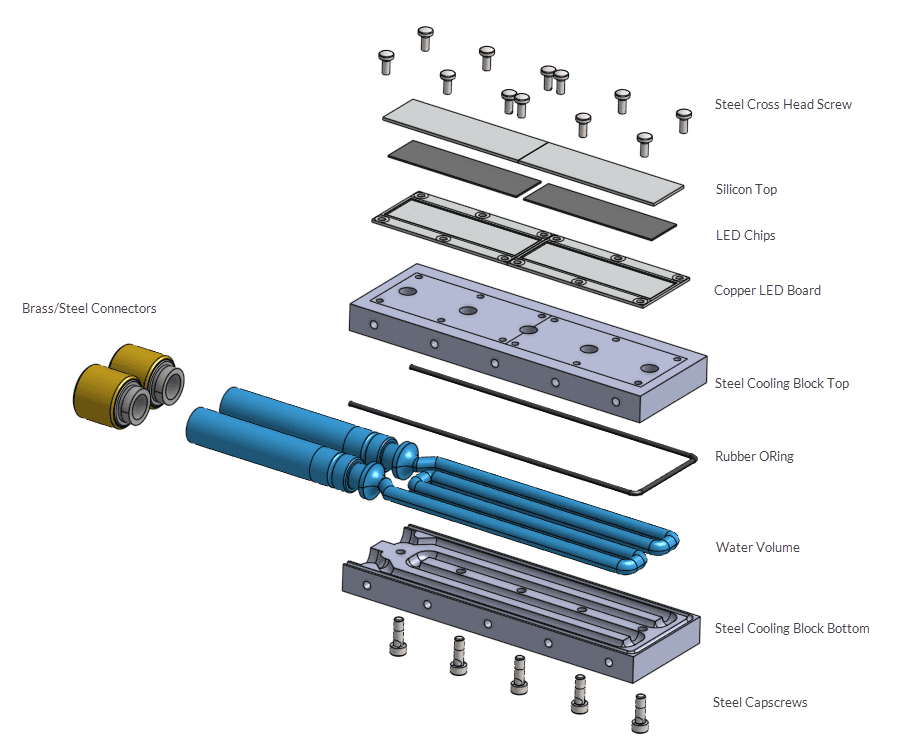
The two COB LEDs are placed side-to-side on top of a steel cooling block. The cooling block is split in half horizontally through its middle plane so that a channel can be machined on both sides. An O-ring is placed around it to prevent any leakage. The blocks are held together with five cap screws. The COB LEDs are also screwed to the top cooling block with set screws.
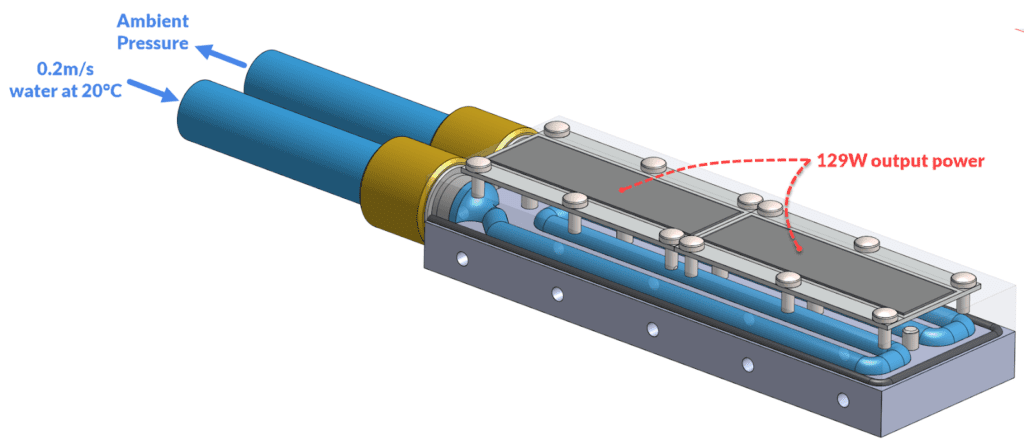
The material properties for each component can then be assigned for each volume of the geometry followed by the flow conditions that represent a specific operating condition of 0.2m/s, and water at 20°C.
For LED lamps, it is known that about 80% of the power received is converted to thermal energy, therefore, 129W is assigned to each LED chip. This project uses the thermal resistance network definition to simulate the heat resistance in all directions from the LED chips (see more about thermal resistance network here).
With these known values of inlet mass flow rate and thermal power, an analytical solution for the temperature at the outlet can first be determined with the following equation:
$$ \dot Q=\dot m Cp \Delta T $$
With a mass flow rate of 2.87e-2 kg/s, a water specific-heat of 4180 J/(kgK) at 20°C and the previously stated power source of 129W, the outlet temperature is expected to be 22.1°C.
LED Cooling Results & LED Performance
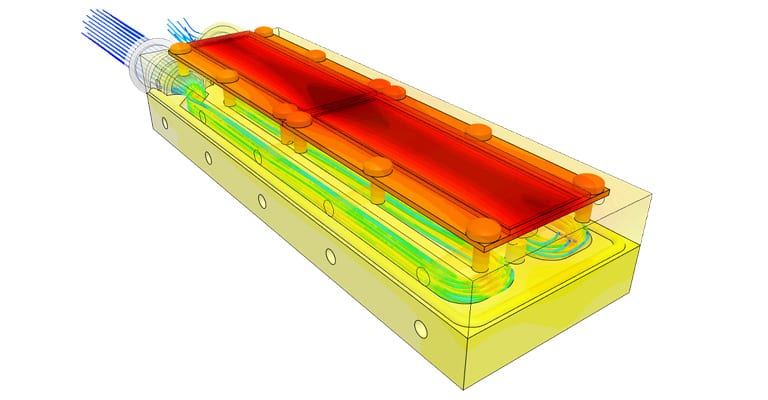
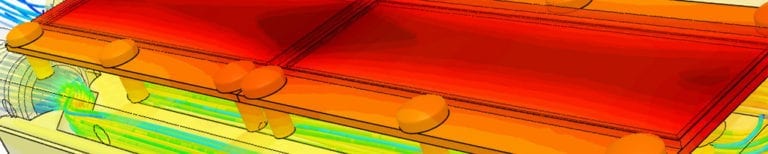
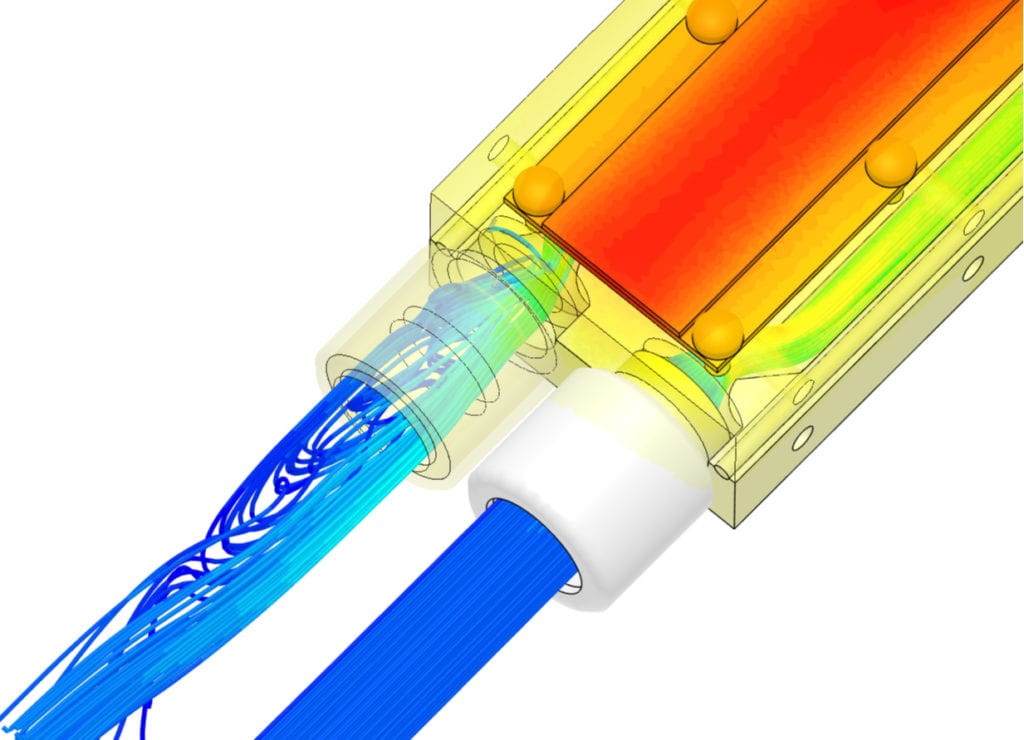
Benefiting from the power of cloud computing, the simulation runs take 60 minutes to complete. The temperature distribution can be visualized over the device and particularly at the faces between the LED board and the LED cooling block. One can easily identify the hottest spot on the LED boards, especially towards the center, where the two boards touch. The temperature then gradually decreases through the block. The surface of contact between the LED board and the cooling block shows a temperature of 36.15°C.
For the flow region, the computed temperature at the outlet is 22.45°C, whereas the temperature analytically calculated is 22.1°C. The velocity streamlines indicate the overall flow pattern of water inside the cooling block cavity. The velocity increases at each elbow and at the reduction in the cross-section area between the connectors and the cooling block cavity. A recirculation zone is clearly identified at the output connector with streamlines circulating back towards the cavity of the block.
This unwanted phenomenon, where energy is spent towards flow circulating in the wrong direction, means that some improvement could be made in either the cooling block cavity or the connector, smoothing out the exit cavity or minimizing steps in the geometry.
The pressure drop across the device is 740Pa and corresponds to 0.021W of hydraulic power at 0.2m/s inlet velocity. This value would, therefore, help to select a suitable pumping device for the job.
LED Liquid Cooling Conclusions
This LED cooling CFD project gives a practical example of a CAD design that can be numerically tested as a digital prototyping method. This type of simulation can predict the junction temperature of a COB LED, liquid-cooled with a water-cooling block. The temperature values give important indications when it comes to assessing the overall lifespan, reliability, and lumen maintenance of the device.
The LED cooling results show that the temperature at the contact face between the copper LED board and the cooling block has satisfactory cooling conditions at 36.15°C (temperature max 40°C recommended). The temperature could potentially be lowered, and the design overall improved, by using a more thermally conductive material for the cooling block, for instance. This would improve further the lifespan and lumen maintenance of the COB LEDs. Improvement in hydraulic power consumption can be made in order to reduce the energy consumption of the device by eliminating recirculation zones.
To read more about electronics and LED cooling with SimScale, check out these recent blogs:
- Cloud-Based Battery Thermal Management for Electric Vehicles
- Electronics Cooling Project: LED Spotlight
- Battery Cooling: Challenges & Solutions
- 5 Ready-To-Use Electronics Cooling Simulation Templates
- Thermal Design Optimization for Better Electronics Cooling